Foggy markets

Bitcoin and the traditional markets showcased significant volatility last week after the release of the U.S. Consumer Price Inflation (CPI) report. However, both sellers and buyers failed to push the price beyond the month-long trading range between $18,100 and $20,400.
The CPI print of 8.2% in September was worse than market expectations by 0.1%. As a result, BTC went down to $18,100. However, buyers later staged a strong recovery toward the psychological $20,000 resistance level. The traditional markets fared in a similar fashion, giving rise to the possibility of peak inflation narrative-driven rally in risk assets similar to the one in July-August 2022.
However, the bullish sentiment could be premature until the Fed confirms a slowdown in rate hikes. The CPI report showed that inflation is turning from a food and energy problem to a core problem, spreading into several industries, such as medical services, insurance, and shelter. Hence, there’s no reason to expect a Fed pivot soon.
The ongoing Russia-Ukraine war and a warning from the International Monetary Fund that more than a third of the global economy will contract in 2023 as the three largest economies—the United States, the eurozone, and China—further amplified uncertainty in the markets.
While the next Fed meeting will likely include a steep rate increase, creating a headwind for risk assets, uncertainty over the midterm election result in early-November remains a looming threat to shorts.
For now, uncertainty is the market’s central theme and is likely to persist unless a catalyst can move Bitcoin’s price beyond its current range.
Dollar Losing Strength
Over the last few weeks, I have been giving regular commentary on the U.S. dollar index because it is dictating the state of play and has been approaching a critical juncture in terms of direction.
The index recovered toward the 114.00 level early during the week. However, the down move after a strong CPI print was certainly unusual based on the recent trend of higher dollar due to Fed rate hike expectations. The mighty sell-off hints that a down move could be brewing in the greenback.
Some of the leading top fiat currencies, like the British pound and Canadian dollar, are also sporting large Doji-styled reversal candles against the U.S. dollar on the daily and weekly time frame. A Doji pattern often leads to major market reversals in foreign exchange markets, where the volatility is usually low. The seasonal trade of the strong equities market following the U.S. midterm elections on November 8 will also act as a headwind for the dollar.
On the other hand, the yield on the benchmark 10-year U.S. Treasury note rose to 4.005%, its highest since October 2008. Consistently higher interest rates from the Treasury market make investors less willing to risk investing in stocks and cryptocurrencies and stick to the dollar.
Moreover, on the long-term horizon, there’s still a possibility of DXY touching 120.00, which will counter bullish rallies in BTC. I suggest keeping a close watch on the U.S. dollar over the coming weeks. The peak inflation narrative has not been confirmed, but we might just see more U.S. dollar weakness leading up to the midterm elections.
Economic Calendar for the Week
The economic calendar is very light this week, so it will probably give the market a chance to focus on other narratives, such as inflation, Ukraine, stock markets, and the upcoming Federal Reserve meeting on November 8.
I don’t see anything on the economic calendar that will be particularly market-moving for BTC. I will say that a select few Federal Reserve members are scheduled to speak this week, so this could potentially be another driver to watch.
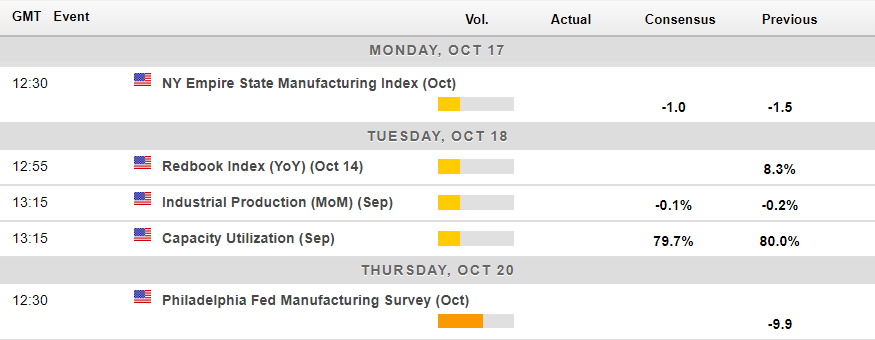
Economic calendar for this week (Source: Forexlive).
Wait for the Signal
In last week’s update, we saw that smart money represented by mid-tier whales (1,000 to 10,000 BTC) and miners were moving oppositely to each other, with miners buying and smart money selling. During the week, the trend turned entirely bearish as mid-tier whales joined the miners in selling. The absence of smart money buyers suggests that upcoming rallies will likely be weak.
Retail investors (holding less than 10 BTC) dominated the buying action after the CPI. It raises a yellow flag as retail traders usually have poor market timing.
There was a slight ray of hope from addresses holding 100-1,000 BTC and 10,000 to 100,000 BTC. It is possible that some sophisticated buyers might be looking to join the peak inflation hype. However, the majority still appear to have doubts that it might be premature without confirmation from the Fed that it will slow down interest rate hikes.
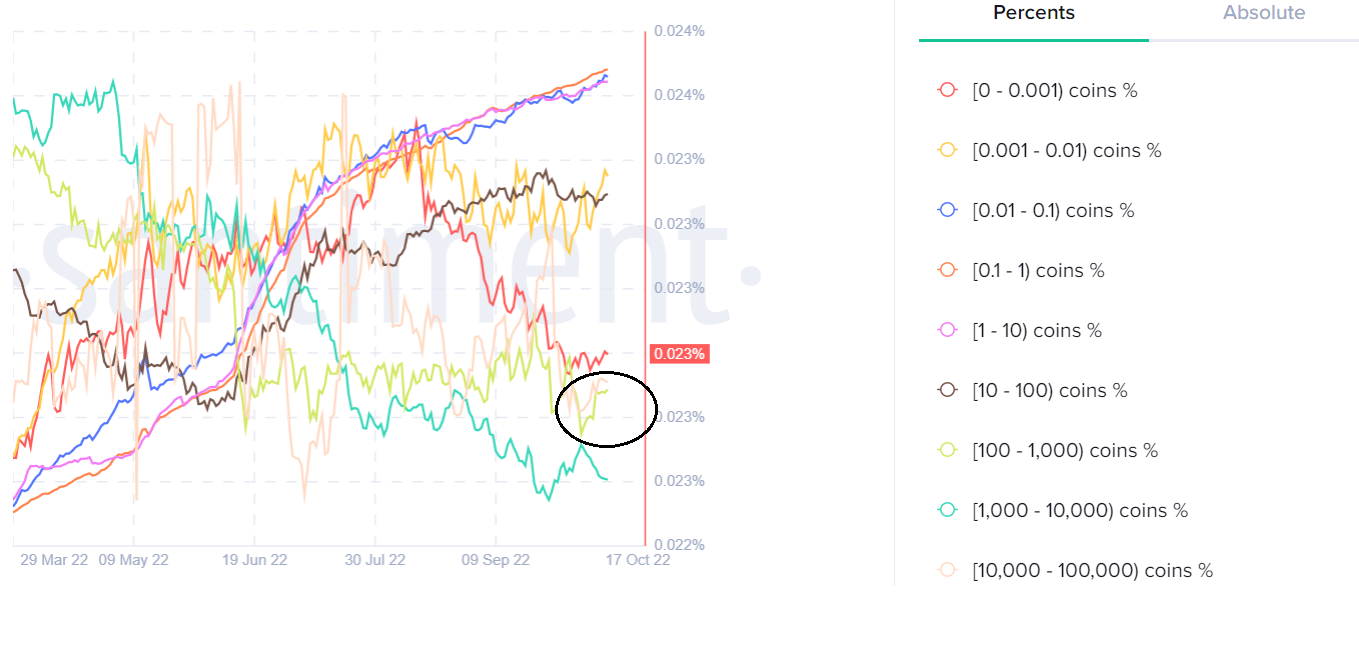
BTC supply distribution by balance of addresses (Source: Santiment).
The Weighted Social Sentiment indicator, which quantifies how positive or negative users are on social media platforms about an asset, further alludes to the possibility of a bull trap. The market sentiment has remained bearish for the better part of this year, so Thursday’s bullishness is likely to fade quickly.
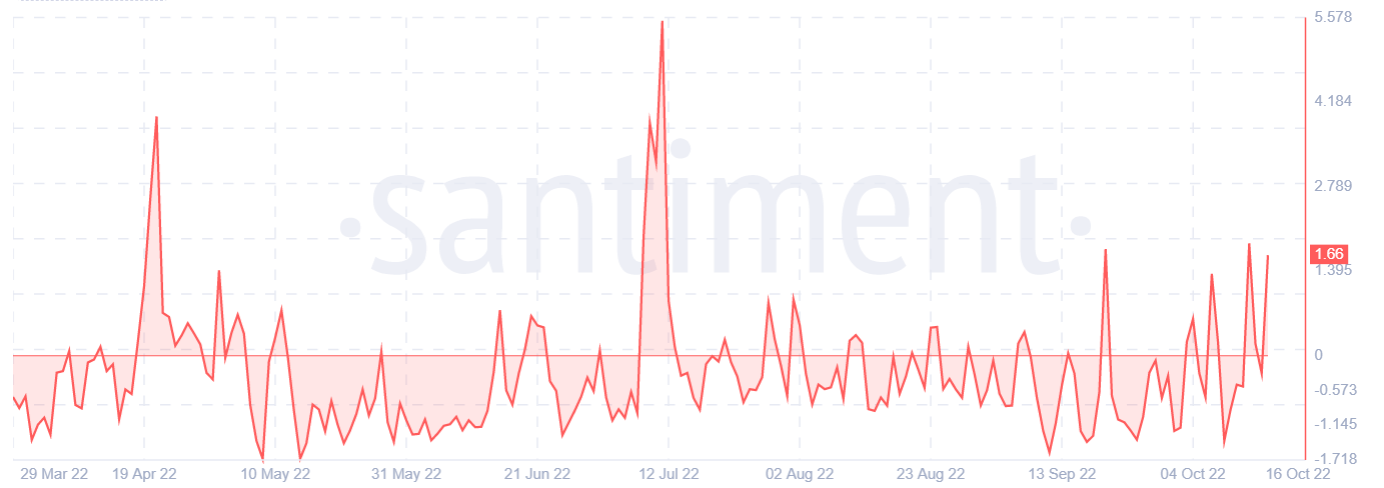
Bitcoin’s Weighted Social Sentiment (Source: Santiment).
Having said that, long-term bottom indicators signal that the market is close to entering the long-term consolidation phase. The market value-to-realized value (MVRV) ratio indicates how overbought or undersold Bitcoin is relative to its fair value or realized value. Currently, it’s trending near the previous bottom levels of 2019 and 2020.
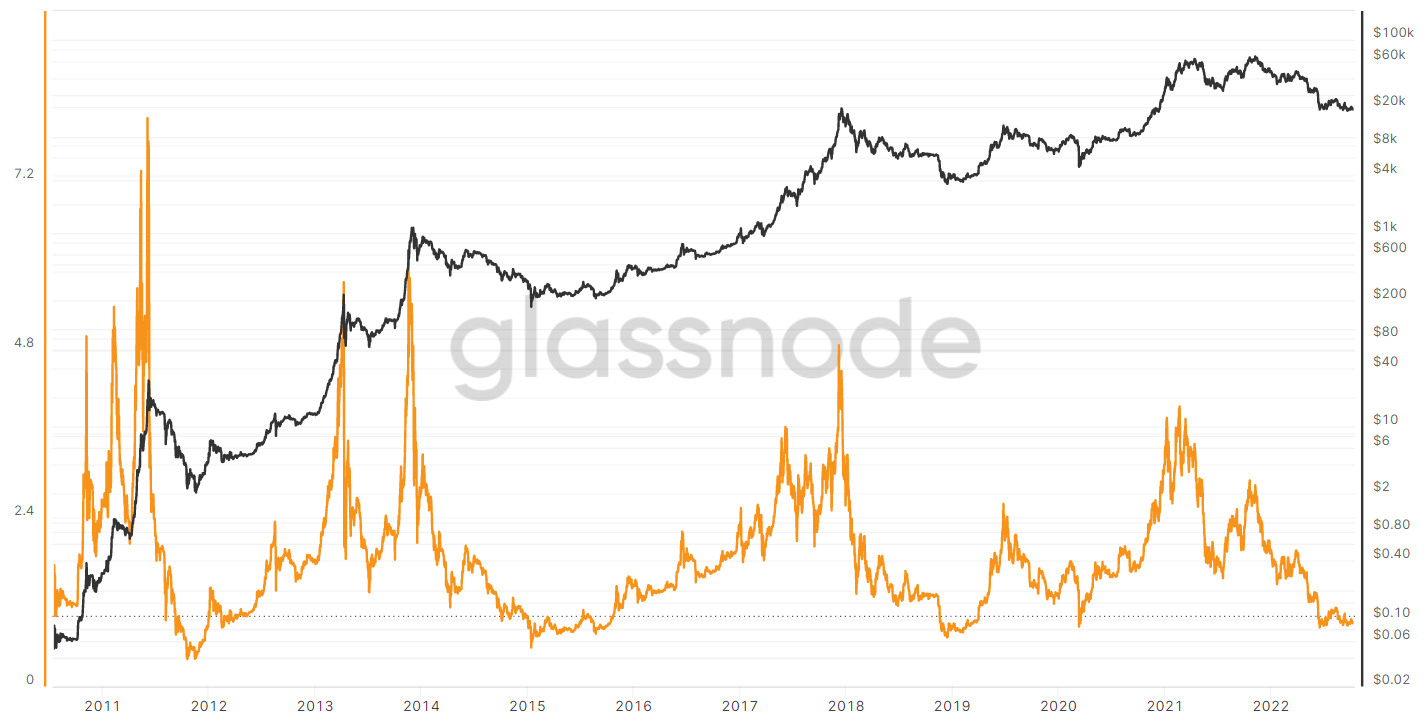
Bitcoin’s MVRV ratio (yellow) and price (black) (Source: Glassnode).
The problem is that it may take months for the consolidation to end, and the markets will likely remain choppy until then, meaning failure to establish a clear bullish or bearish trend.
Back To Square One
Bitcoin’s price is back to where it started last week after a promising recovery toward $19,900. The current trading range is set between $18,100 and $20,400 levels. Bitcoin tested the bottom of the range after failing at the top.
A failure to find direction beyond the current price range sets up another uncertain week for the top coin and the rest of the crypto market. Range traders would have had a great time if they pulled the trigger last week, but for swing, or trend traders, like me, it has been an incredibly boring last few weeks and months.
If we see a break of the channel’s ceiling this week, expect a test at $21,300 and then $21,700. Conversely, a break under $18,000 support could support one mighty drop toward $16,400.
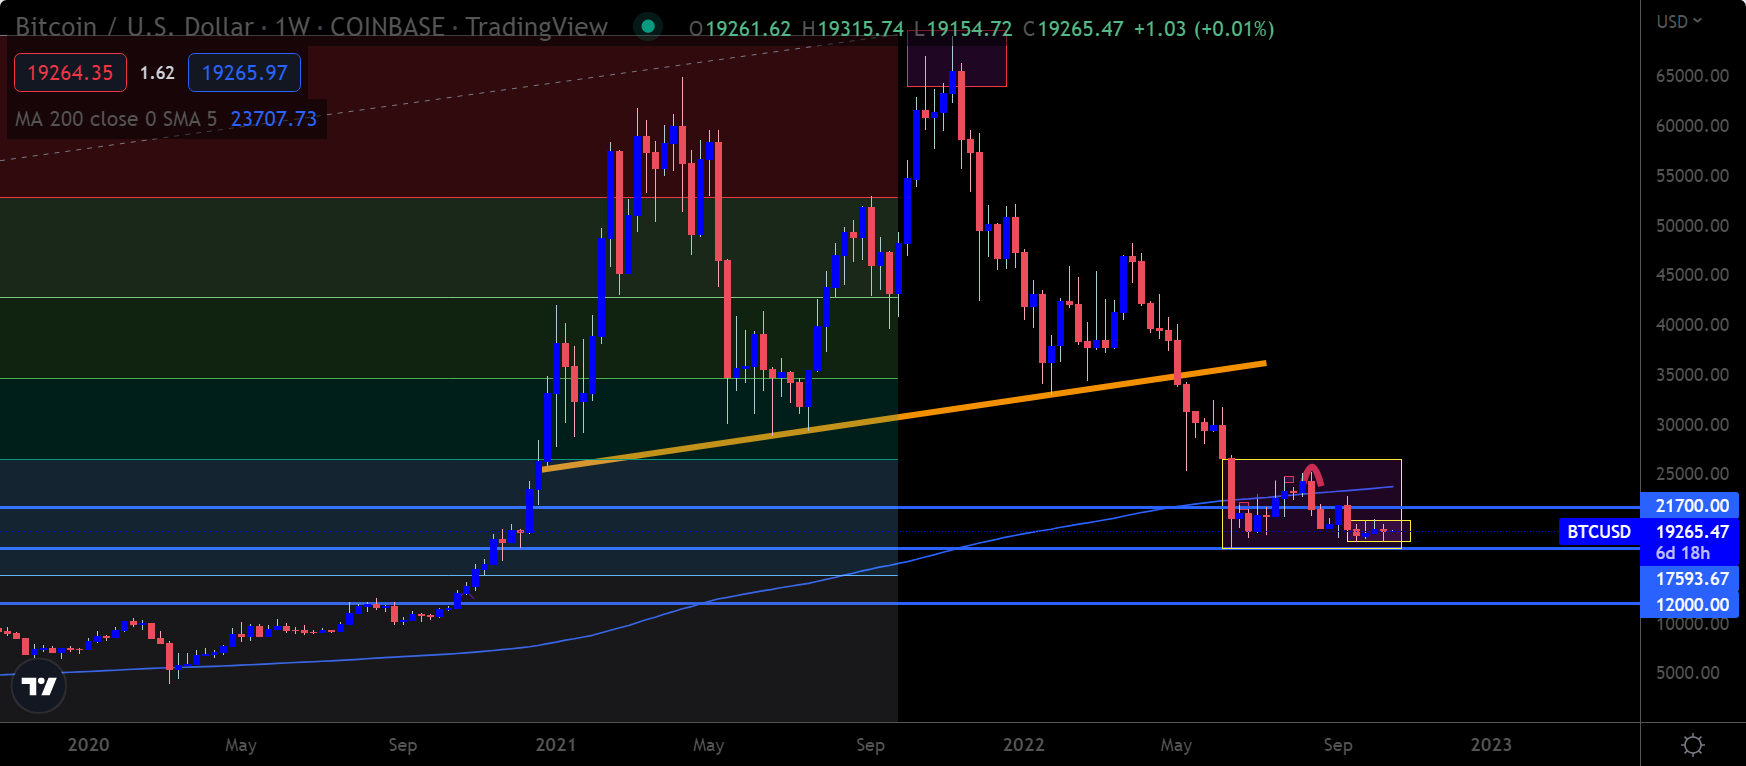
BTC/USD four-hour chart (Source: TradingView).
Only above $1,420
ETH still looks weak across the short, medium, and long-term timelines. Like BTC, ETH/USD is currently trading between $1,190 and $1,420. Unless there’s a breakout from this range, I don’t think a lot has changed technically. Moreover, it appears ETH is unlikely to break out from its range until BTC does.
Should we see an upside breakout, we could reasonably expect a move toward the $1,580 or $1,650 area. To the downside, $1,000 and $800 are the obvious downside targets.
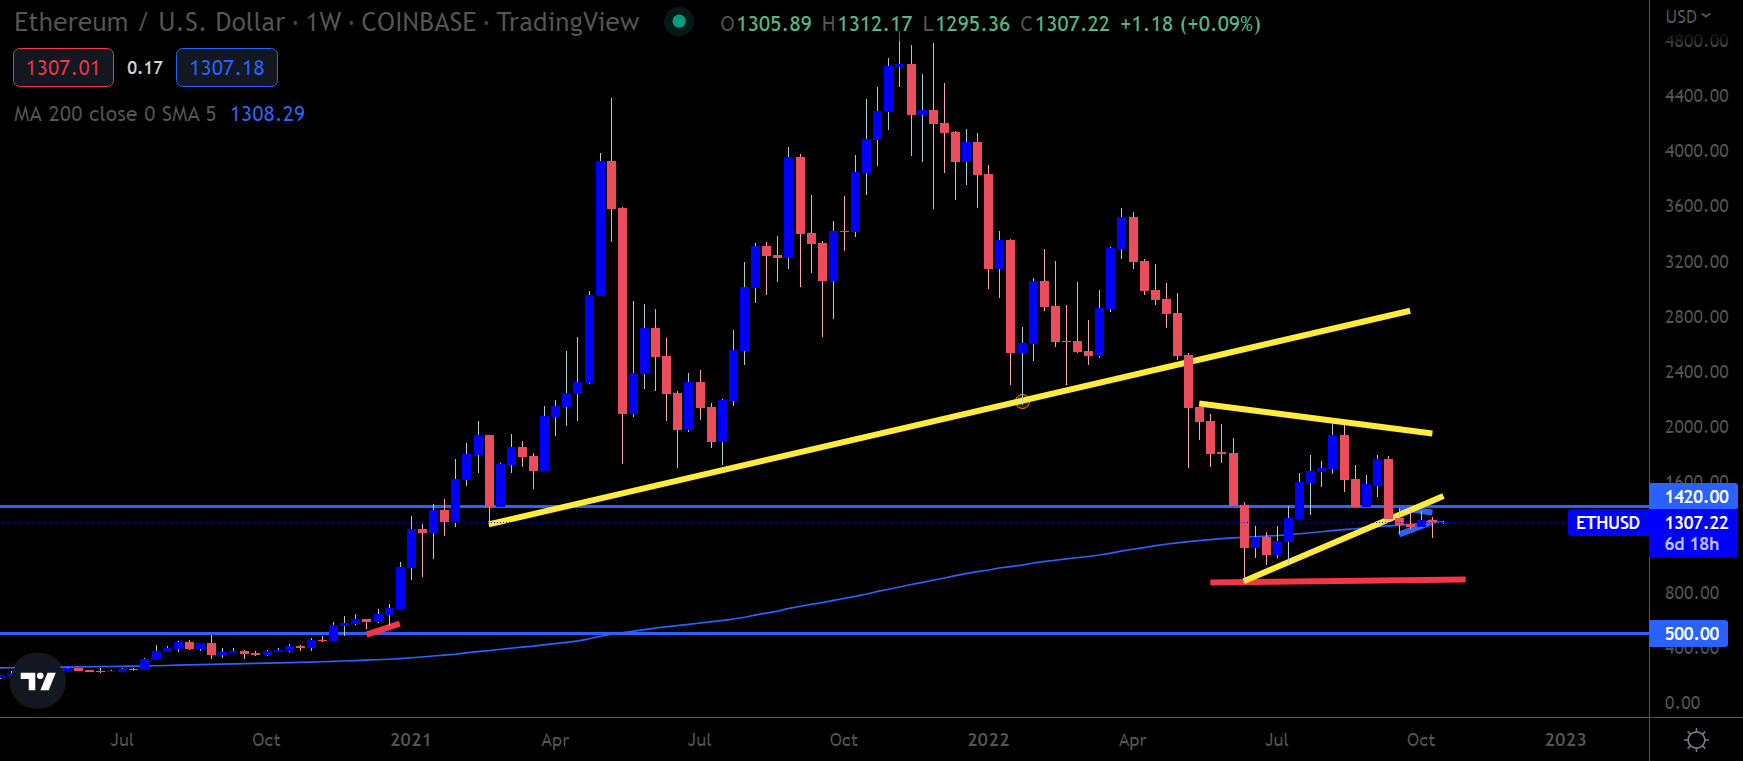
ETH/USD four-hour chart (Source: TradingView).
Waves Sellers On Edge
Since May, WAVES/USD has been bouncing back from the $3.00 area. If you bought WAVES every time it dropped towards this area over the past few months, you would have been doing better than most traders.
However, Waves obviously has its issues, to say the least, meaning that it has dropped from above $60.00 back to where it is today. Its association with Russian state-owned companies has become a massive roadblock for Waves this year as the Western Alliance has imposed economic sanctions on Russia.
WAVES has been bouncing from a critical weekly trendline since last year. The trendline’s support is currently located around $2. I would expect Waves to move back towards this area if we did see another downturn. On the upside, buyers will look to target the recently broken support level around $4.5.
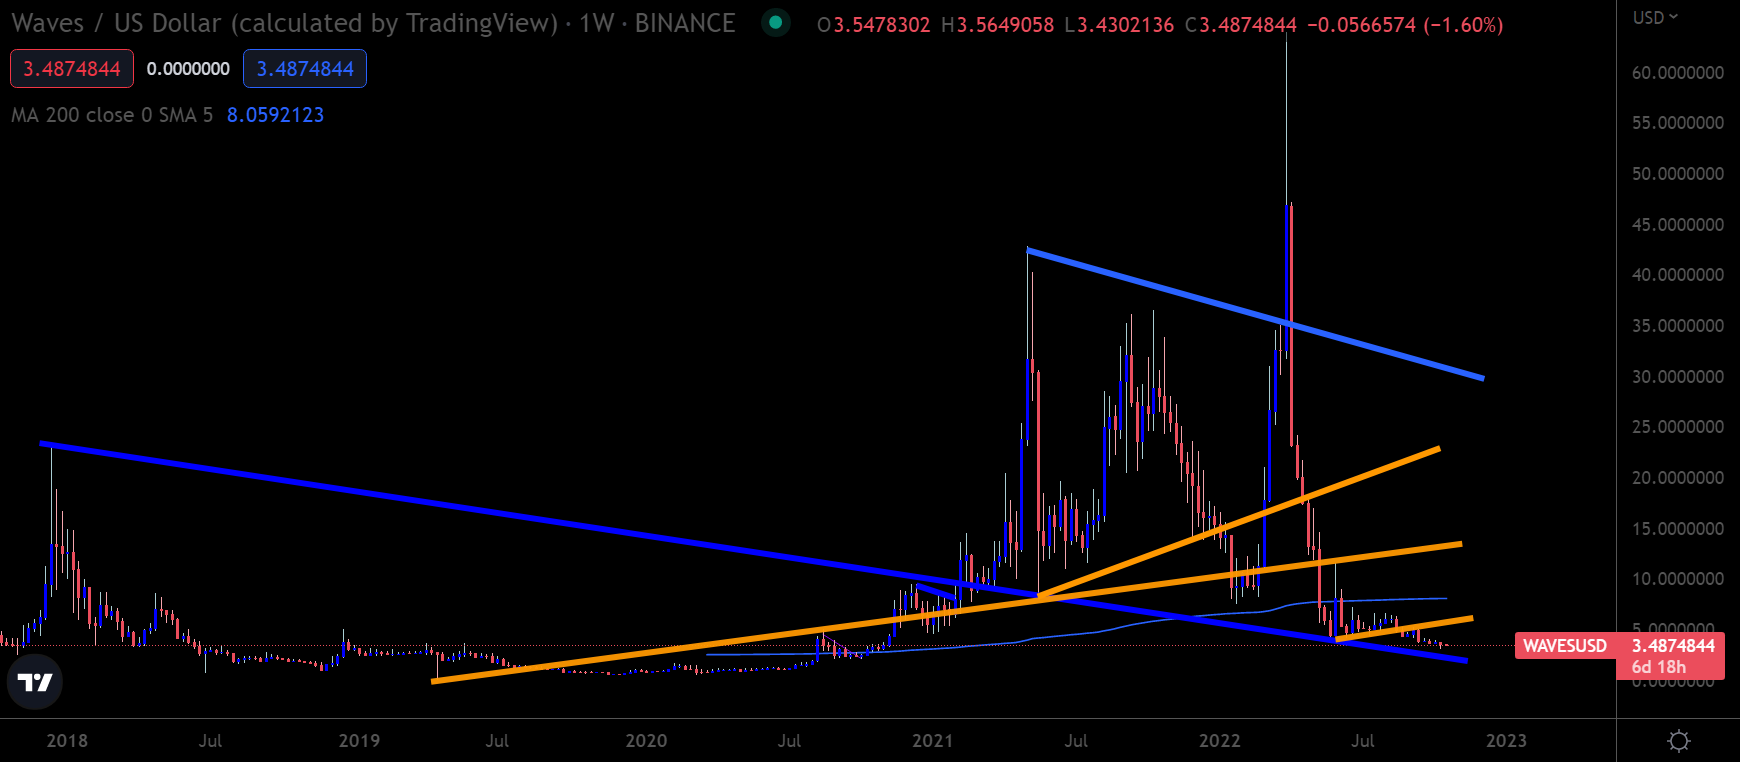
WAVES/USD four-hour chart (Source: TradingView)
A Narrow Path
Supreme boredom reigns in the crypto market at the market for trend traders. Thursday’s recovery after the CPI print faded away quickly, creating more uncertainty until BTC breaks the established ranges.
I would suggest crypto probably needs to see a bullish catalyst that is crypto-specific to get anywhere near $24,000 or even $25,000 over the coming weeks.
The midterm elections could be a minor non-crypto-related bullish catalyst. Still, I don’t expect it to generate a significant price volume or help return institutional and spot buying volumes to 2021 levels. Overall, I expect more of the same this week until the $18,000 to $20,400 price range finally breaks.
