CPI print week

Last week, buyers failed to break above the resistance from Bitcoin’s four-week price range between $18,000 and $20,400. The weakness can be primarily attributed to the growth in the U.S. economy, which provokes fear of interest rate hikes in the future.
The American unemployment rate dropped by 0.2% in September compared to the previous month. A solid job sector caused top equities indices, the S&P 500 and Nasdaq 100, to revisit their yearly lows. This week’s futures market also opened in the red, adding to the negative pressure.
On the bright side, Bitcoin has shown signs of decoupling with the stock market. The top crypto resisted selling pressure and had an increased price correlation with gold last week. Data shows BTC and yellow metal enjoyed this year’s strongest price correlation. If this trend gathers momentum, it can benefit Bitcoin’s price in the face of an economic meltdown.
However, for the above theory to successfully play out, the market probably needs confirmation of a generational top in the dollar’s value relative to other fiat currencies, which hasn’t arrived yet.
According to Arcane Research, the open interest (O.I.) volume for perpetual Bitcoin swaps spiked to an all-time high of 450,000 BTC. Perpetual swaps are the most popular leveraged trading contracts offered by cryptocurrency exchanges like Binance and FTX. It suggests that the market can expect heightened volatility levels shortly.
On-chain indicators sound alarm for buyers as miners and whales sold heavily last week while the retail investors continued to buy. The movement of miners and whale holdings will be crucial after two important data releases on the U.S. economy this week.
Dollar remains crucial
One of the central themes of the coming week will be what direction the U.S. dollar index decides to take. Will the greenback continue to surge to new multi-decade highs, or is a meaningful price top already in?
Over my years of trading, I have seen a typical characteristic around price tops: the speed with which the price moves usually occurs on both sides. First, you get a parabolic move to the upside followed by a correction lower equivalent to the initial parabolic price move.
If we judge the U.S. dollar’s recent move above 110.00 by those metrics, then a significant price top is likely already in. If this is the case, we probably need also to consider that a bottom has been formed for BTC and, indeed, gold.
The main problem with that theory is that it does not fit current fundamentals. Aggressive rate hikes from the Fed, geopolitical uncertainty, and a looming global economic recession all favor more capital deployment into the buck. The crucial support and resistance levels for the Dollar Index (DXY) stand at 110.00 and 114.70, respectively.
Economic Calendar for the Week
Wednesday and Thursday are the most important days on the economic calendar as we have the release of last month’s Federal policy rate meeting minutes and inflation prints from the United States.
Fed Chair Jerome Powell noted after the September meeting, “I wish there were a painless way to beat inflation, but there isn’t.” I don’t expect a Fed pivot from the minutes.
As for the Consumer Inflation Index (CPI), the markets experienced a big shock after CPI print for August came in hotter than expected. Don’t be surprised to see more of the same this week. I think a strong case can be made for more upside shocks in inflation given the Ukrainian situation, supply constraints, and rising consumer costs.
The price action of Bitcoin after the announcements will also help in determining whether it has successfully detached itself from risk assets, or its recent strength was a temporary affair.
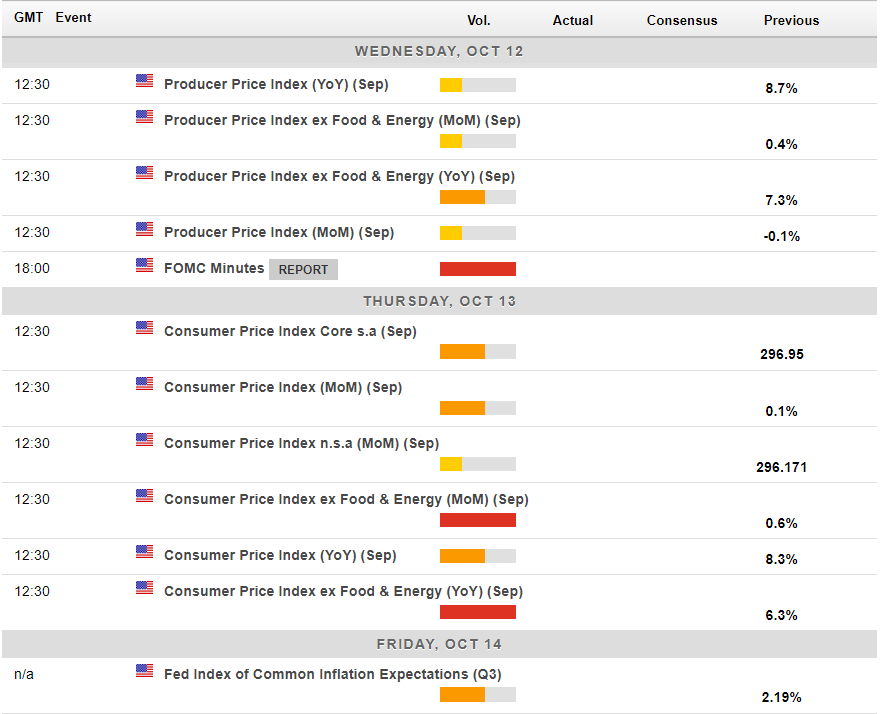
Economic calendar for this week (Source: Forexlive)
On-Chain Warnings
Bitcoin’s on-chain indicators bear a warning for the next couple of weeks as miners and whales are in sell mode while retail buyers are highly optimistic.
The one-hop supply of miner’s chart below represents the BTC balances of addresses that received Bitcoin from mining pools. These addresses have reduced their holdings significantly in the last two weeks, taking their supply to April 2022 lows. Last week alone, miners unloaded nearly $1 billion worth of Bitcoin, which is a potent red signal.
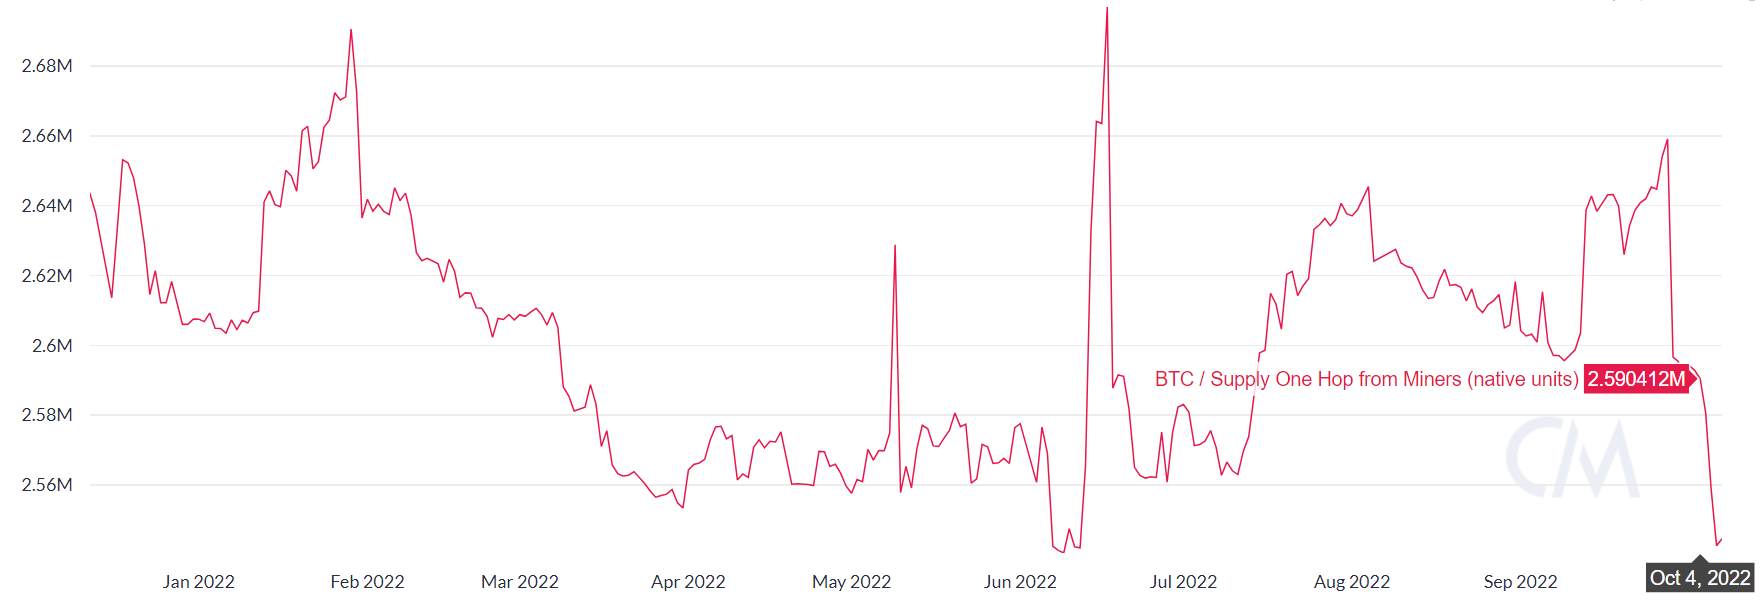
Bitcoin one-hop miner supply (Source: Coinmetrics)
The holdings for mid-tier whales—addresses holding 1,000 to 10,000 BTC—increased during the week. However, super whales with 10,000 to 100,000 BTC sold aggressively. It will be interesting to see the movements of these wallets this week after the important announcements from the U.S. economy.
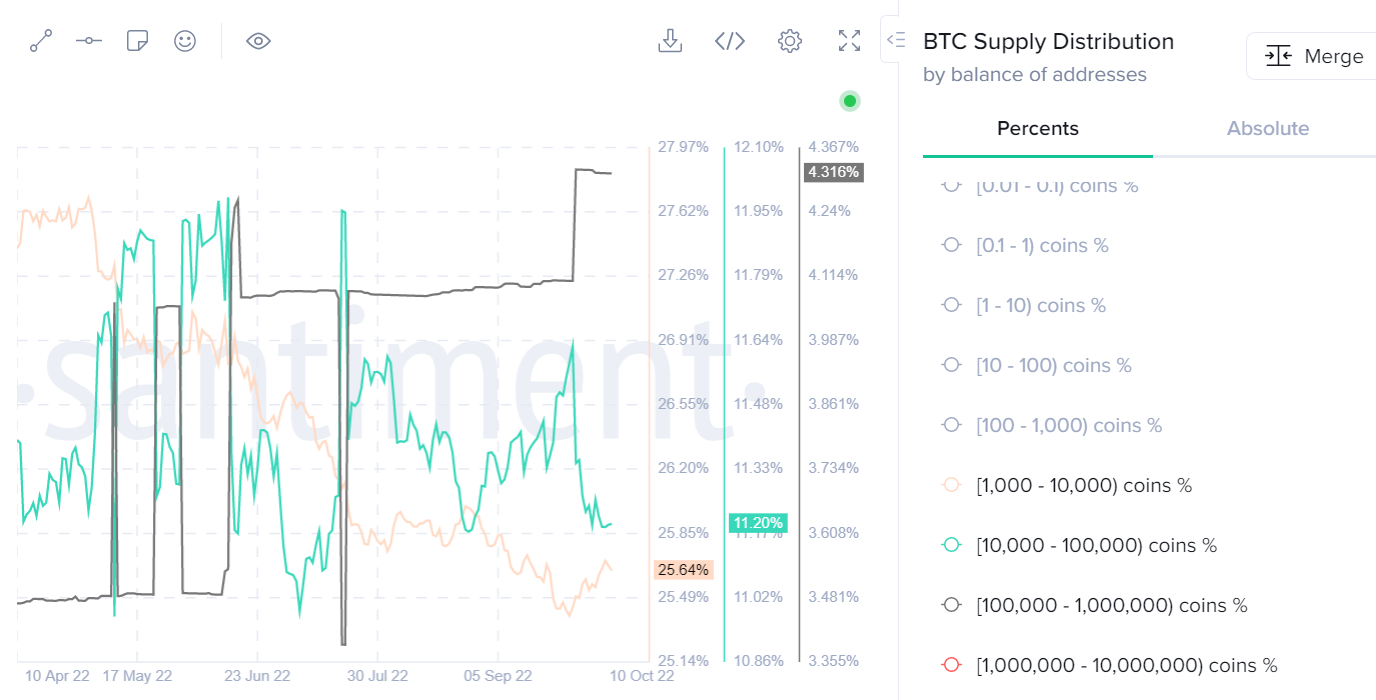
BTC Supply Distribution (Source: Santiment)
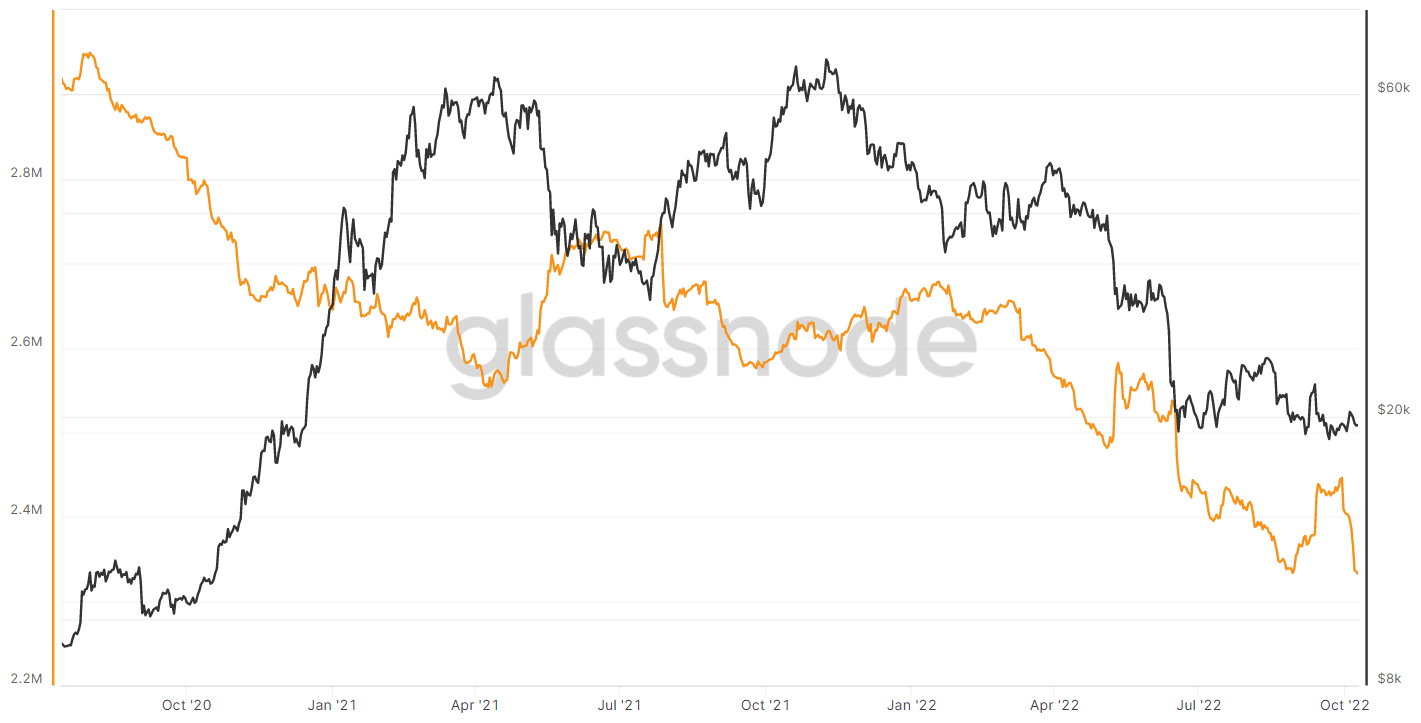
The exchange balances dipped sharply last week. Combining exchange balances with the whale movements indicates that retail buyers aggressively bought during last week’s dip below $20,000. This is a negative signal for buyers as the market usually moves in the opposite direction to retail bets.
Bitcoin’s Range Boredom
For four weeks, Bitcoin has been trapped within the $18,100 to $20,400 price range. There is very little to say in such circumstances, but until the range break occurs, relatively dull trading conditions are here to stay.
Regarding the price targets, I suspect the $21,700 level would be the initial target for bulls and a defining moment about whether we see a strong rejection or a continuation.
If a continuation of the upside breakout past $21,700 happens, buyers’ next level of interest would be the $22,500 level. Both targets are still a distant pipe dream for bulls.
On the downside, a break under $18,100 would be very bearish. And in this instance, I think a quick drop toward the $16,400 level seems plausible. The $15,000 level below also offers solid support.
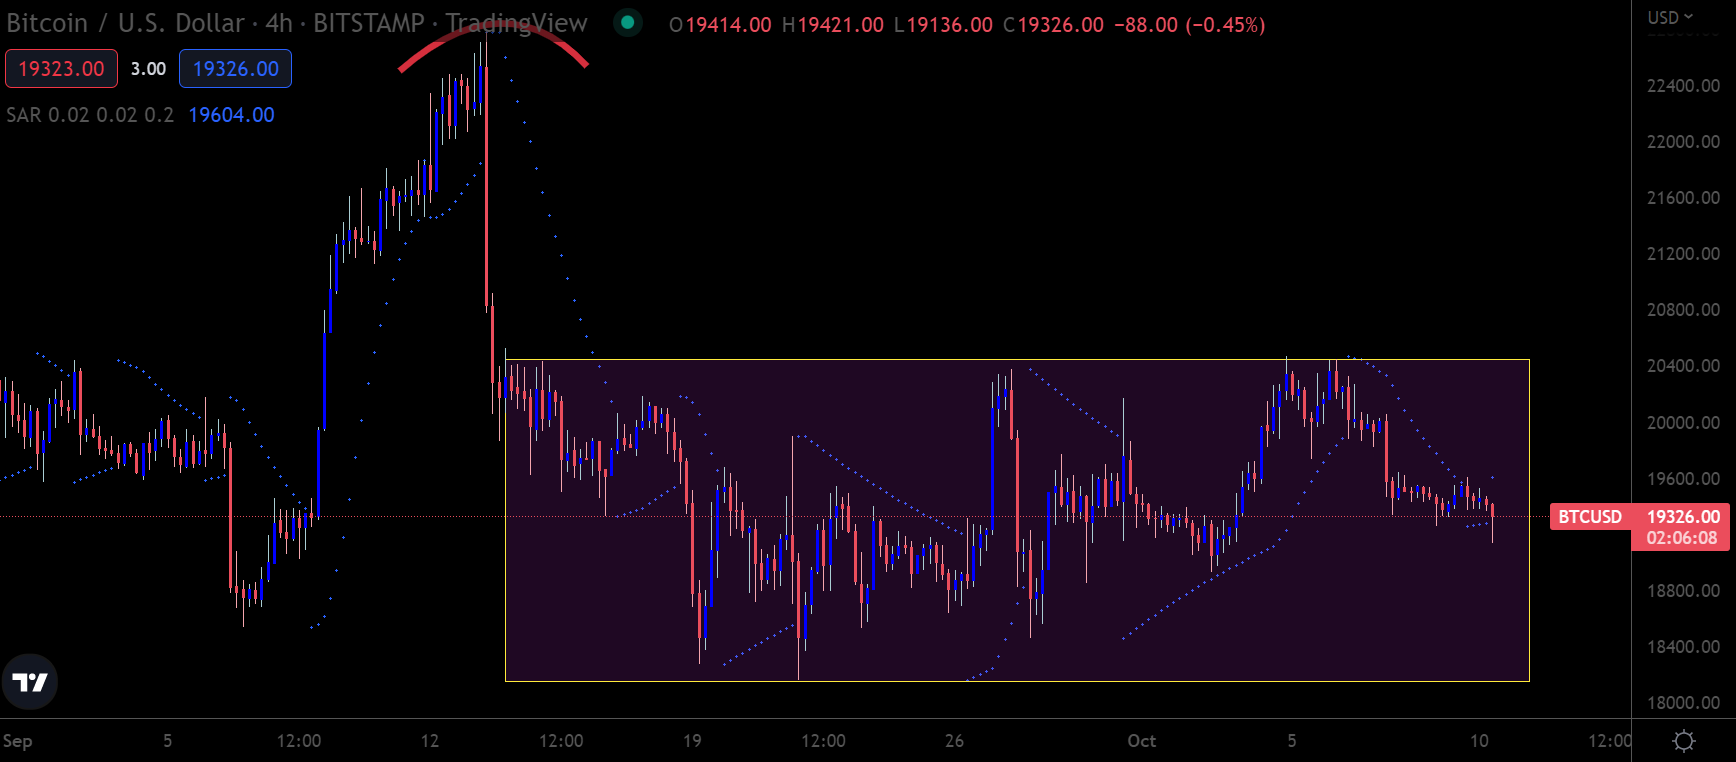
BTC/USD four-hour chart (Source: TradingView)
Weakness Persists in ETH
As stated numerous times in the weekly Crypto Market Roundup, ETH remains in trouble while trading below the $1,420 level. Last week’s closing around $1,320 added to Ethereum’s technical weakness.
Indeed, if BTC were to stage a surprising upside recovery, ETH would likely be dragged higher. Buyers could expect the $1,540 or $1,700 level to be tested in such a situation. Currently, I remain skeptical about this scenario.
Far more likely at this juncture is a down move towards the $1,000 area over the next few weeks. As I have been saying for some time now, if BTC crashes to $12,000, then all bets are off for Ethereum.
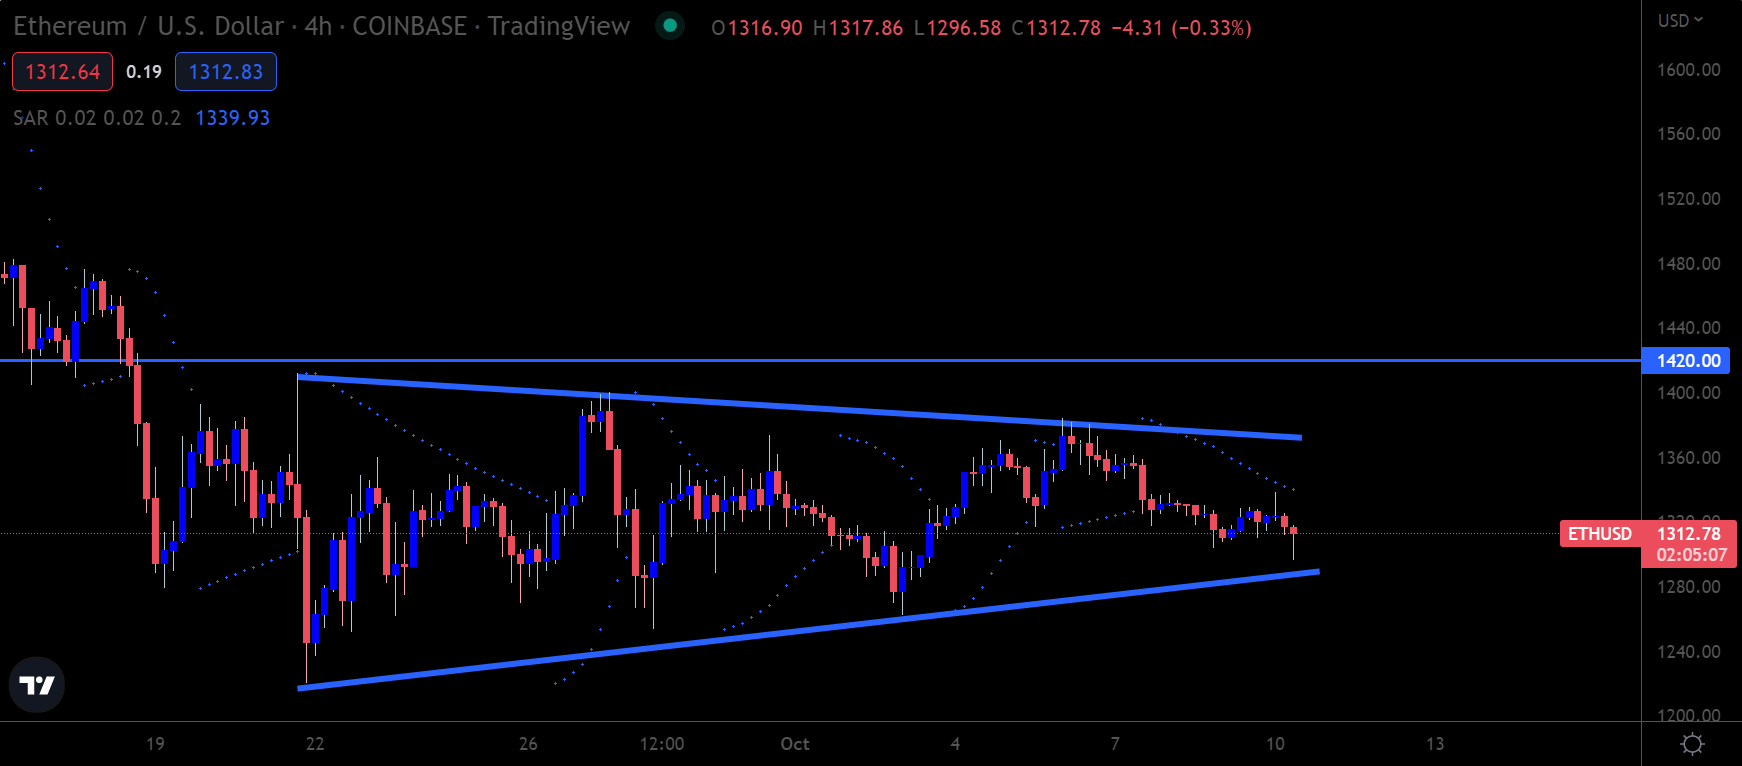
ETH/USD four-hour chart (Source: TradingView)
Litecoin Predictions
I received an interesting question this week: What is my long-term price projection for Litecoin?
The truth is that long-term predictions are complicated for an altcoin with weak fundamentals. Thus, I will attempt to tackle the question in the medium-term horizon, going out no further than three to four months.
With the above in mind, I think the trajectory for Litecoin is almost certainly lower. LTC could go down towards the $35.00 to $30.00 support area if we see Bitcoin tagging $12,000 to $10,000 this year. The above targets also seem plausible if you consider the weak fundamentals around Litecoin.
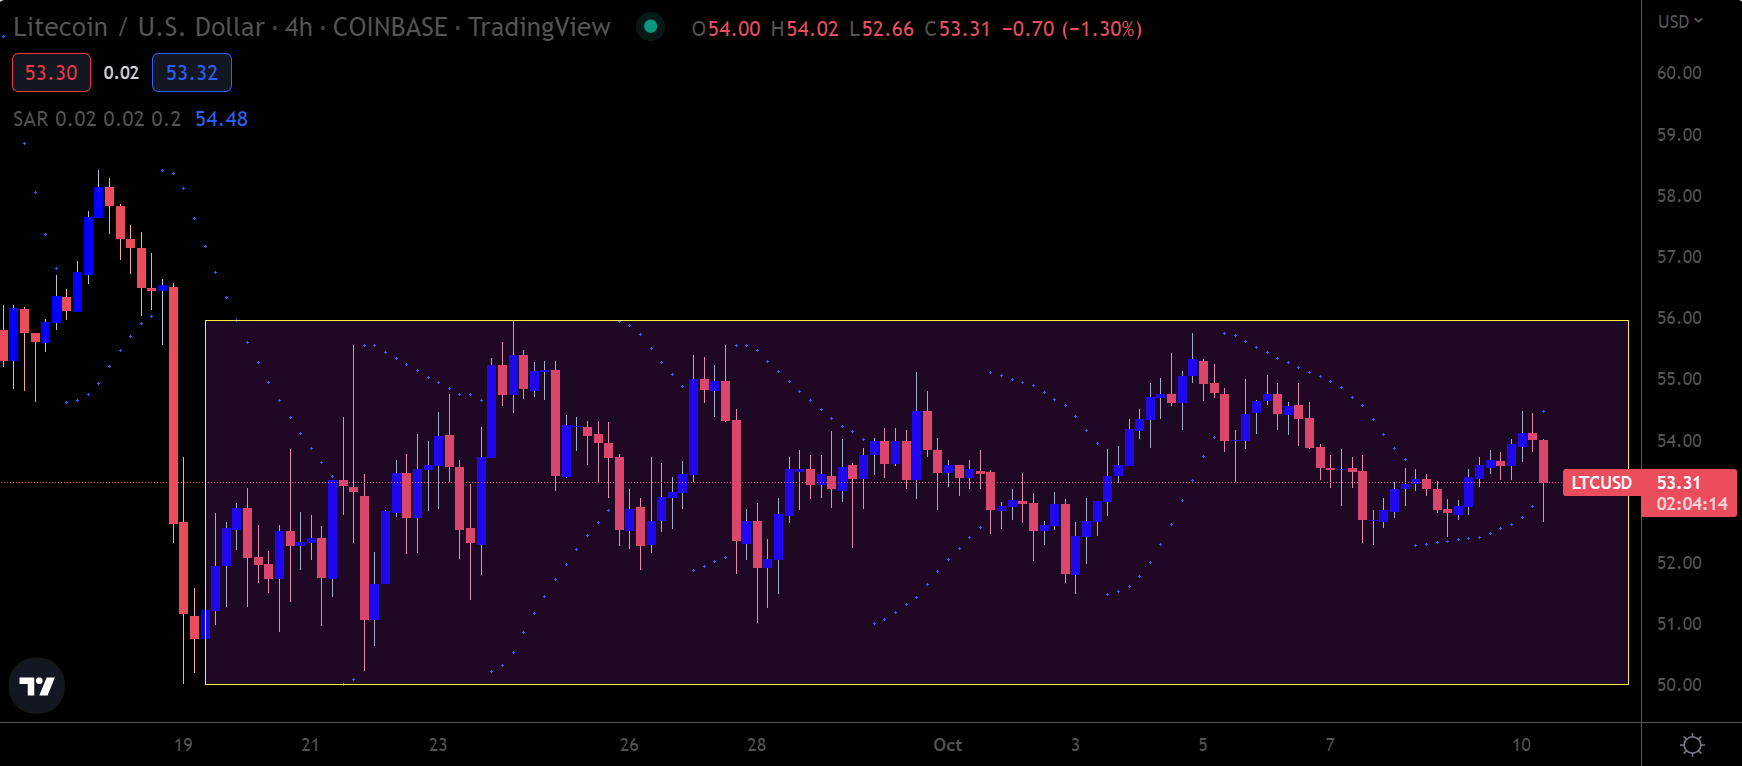
LTC/USD four-hour chart (Source: TradingView)
This Is Getting Boring
The daily moves in the equity, energy and foreign exchange markets have put the crypto market to shame over recent weeks and months. This particularly dull spell for crypto won’t last forever, but it is trying the market’s patience, including mine. This week’s CPI print should provide the fuel for a successful breakout from Bitcoin’s current price range.
A stressed financial system will test the notion that Bitcoin is starting to decouple from stock markets in the coming weeks. I tend to think that story is still a bit “early” but coming down the pipeline.
Until then, the path of least resistance for the crypto market stays on the downside. The silver lining is that bargain basement purchase levels could be forthcoming over the coming months.
