The Tesla effect

Bitcoin and the cryptocurrency market breathed a sigh of relief after last week’s surge. The BTC price rose to a high of $24,200, while Ethereum rallied 90% from its yearly low of $880 to last week’s high of around $1,650.
A corresponding rise in the US Nasdaq100 index added to the bullish momentum in Bitcoin, given the strong correlation between these assets. These risk assets enjoyed the optimism around peaking inflation in the U.S., and worsening economic conditions, which should stop the U.S. Federal Reserve from implementing a 100 basis point (bps) hike in the benchmark interest rate and instead restrict it to 75 bps.
Bitcoin suffered a negative shock midweek after Tesla’s Q2 earnings revealed that the electric automobile maker sold 75% of its BTC holdings. Let’s quickly revisit Tesla’s BTC investment.
The electric car maker first purchased $1.5 billion Bitcoin in January 2021. Estimates of Tesla’s Bitcoin carrying costs vary, but the purchase timing suggests a level of around $32,600. Tesla approximately bought 46,000 BTC and later sold 10% of it in April 2021 at a profit.
Heading into Q2 2022, the company held around 42,000, 75% of which added a cash balance of $936 million, meaning that Tesla sold Bitcoin for close to $30,000, close to the breakeven price, not at a massive loss.
The earning call stated that Tesla sold its holdings due to uncertainty about COVID-19 and China. I think few people know what may be needed to run one of the largest electric car companies in the world. Thus, the statement may have some validity. We also do not know his intentions going forward, but Musk noted that the company was open to BTC investments in the future.
Overall, the market reaction to the Tesla news looked to be knee-jerk at first. However, the sentiment has turned uncertain in the aftermath of the announcement. It effectively paused Bitcoin’s rally and raised uncertainty in the market close to the U.S. central bank meeting this week.
An Important Economic Week
This week marks one of the most important in economic calendars due to a trifecta of important announcements.
First and foremost is the Federal Open Market Committee (FOMC) meeting Wednesday, followed by the U.S. gross domestic product (GDP) projection for 2022 on Thursday. All this, while quarterly earnings reports of tech giants in Microsoft, Apple, Meta, Alphabet, and Amazon are lined up for the week.
Last week, the stock market looked past the weak earnings report from companies like Tesla and Netflix. On Friday, however, the drop in share prices of Twitter and Snapchat weighed heavily on the Nasdaq100 index, causing a 1.18% decline. The downturn continued at this week’s opening, reflecting on the uncertainty ahead of this week’s announcements.
I think a 75 bps hike is on the cards because the recent jobs sector and retail sales figures were fairly robust against initial estimates. The recent dismal Housing and Purchasing Managers Index data from the manufacturing and service sector of the United States economy has cast doubt on a 100 bps hike from the U.S. central bank due to fears of recession.
While buyers are looking forward to a 75 bps hike, much of the market reaction will focus on what the Fed plans to do next.
If the Fed fears that the economy is slowing, then markets will probably react by selling the U.S dollar and buying stocks. On the other hand, if the Fed clearly states they are intent on staying on the 75 basis point rate path, then Bitcoin could be in danger of a significant correction this week.
Lastly, watch out for the market’s reaction to earnings reports from tech companies. A sharp move in the Nasdaq100 index should drag Bitcoin along due to their strong correlation.
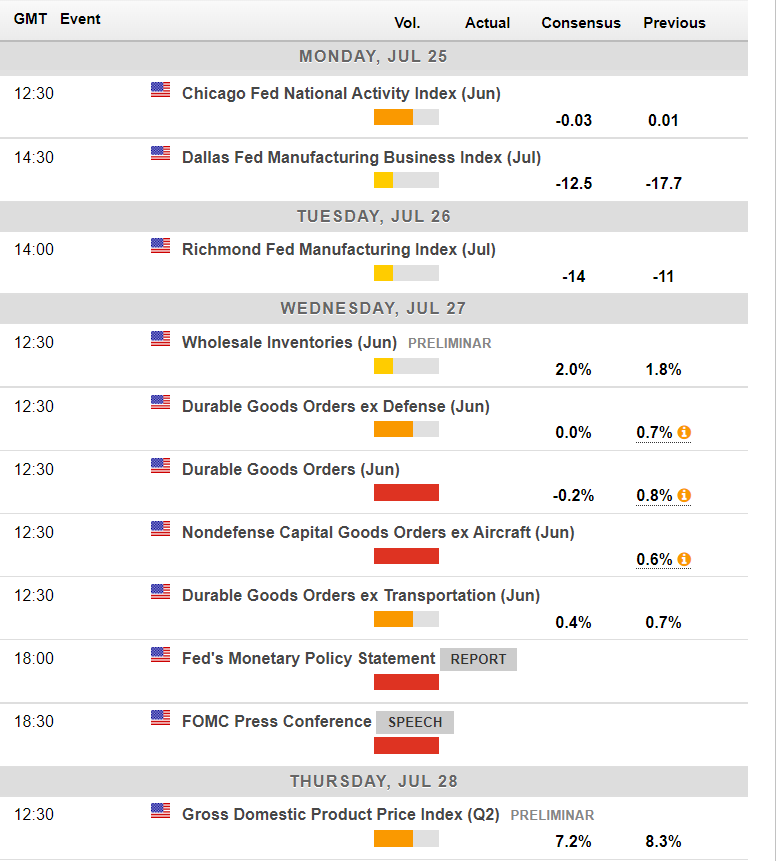
Economic calendar for this week. Source: Forexlive
On-chain Alarms
A few on-chain indicators recorded bearish movements last week, demanding caution from buyers.
On Friday, the Token Age Consumed indicator recorded its third-largest spike this year. The metric tracks relative changes in the movements of old wallets. It is measured by multiplying the number of tokens changing hands and the days since these were last added to the sender’s wallets.
The spike took place around the highs of the week, a bearish sign that hints at whales moving coins when they think a price peak has been hit. The inflow to exchanges also increased simultaneously, hinting at a potential sell-off. The combination of these two signals has a decent track record in front-running short-term downturns.
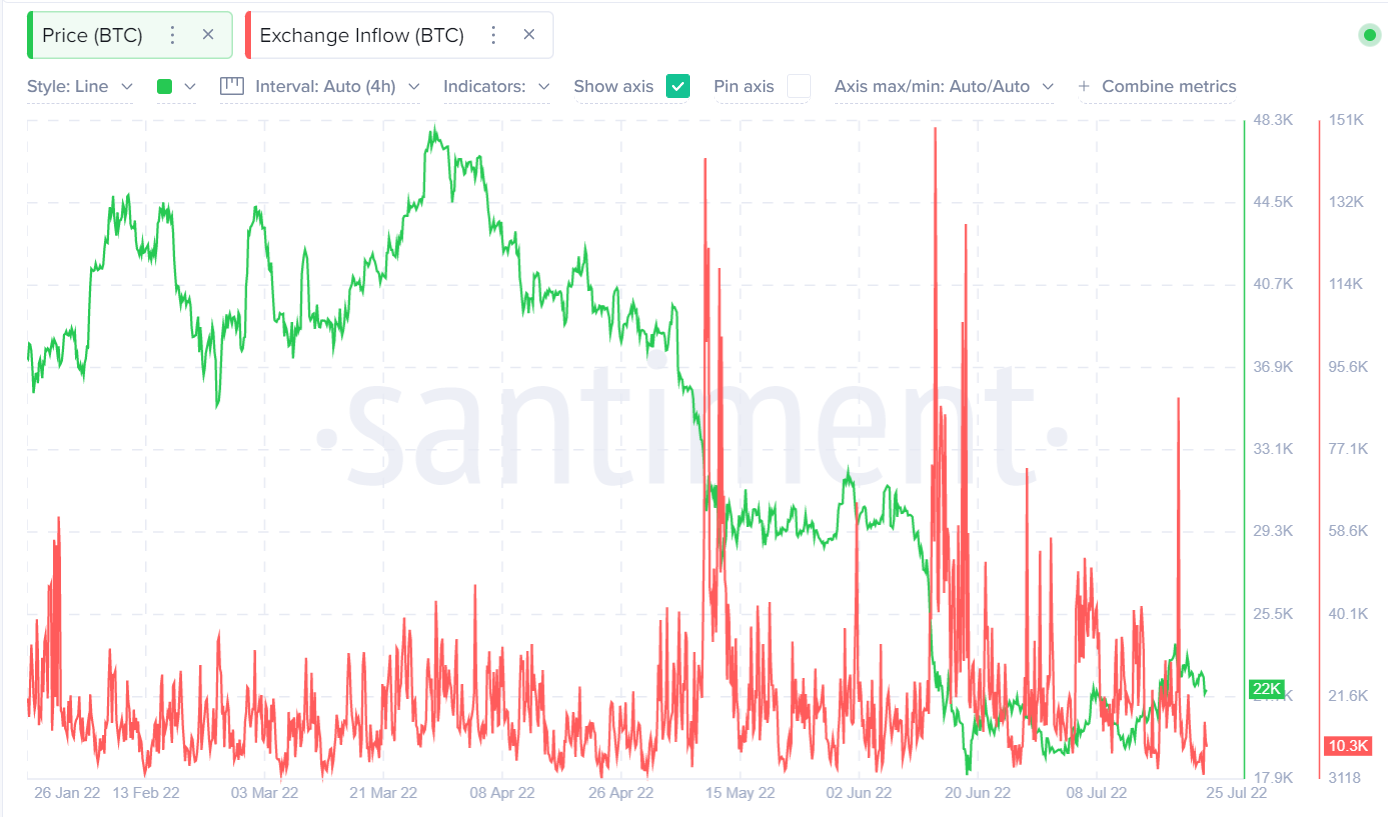
Bitcoin exchange inflows. Source: Santiment.
At the same time, the “smart money” category that includes Bitcoin miners and mid-tier whales—wallets holding 1,000 to 10,000 BTC—has shown no tangible buying signs. In fact, the mid-tier whales sold aggressively at the highs last week and continued to reduce their position over the weekend.
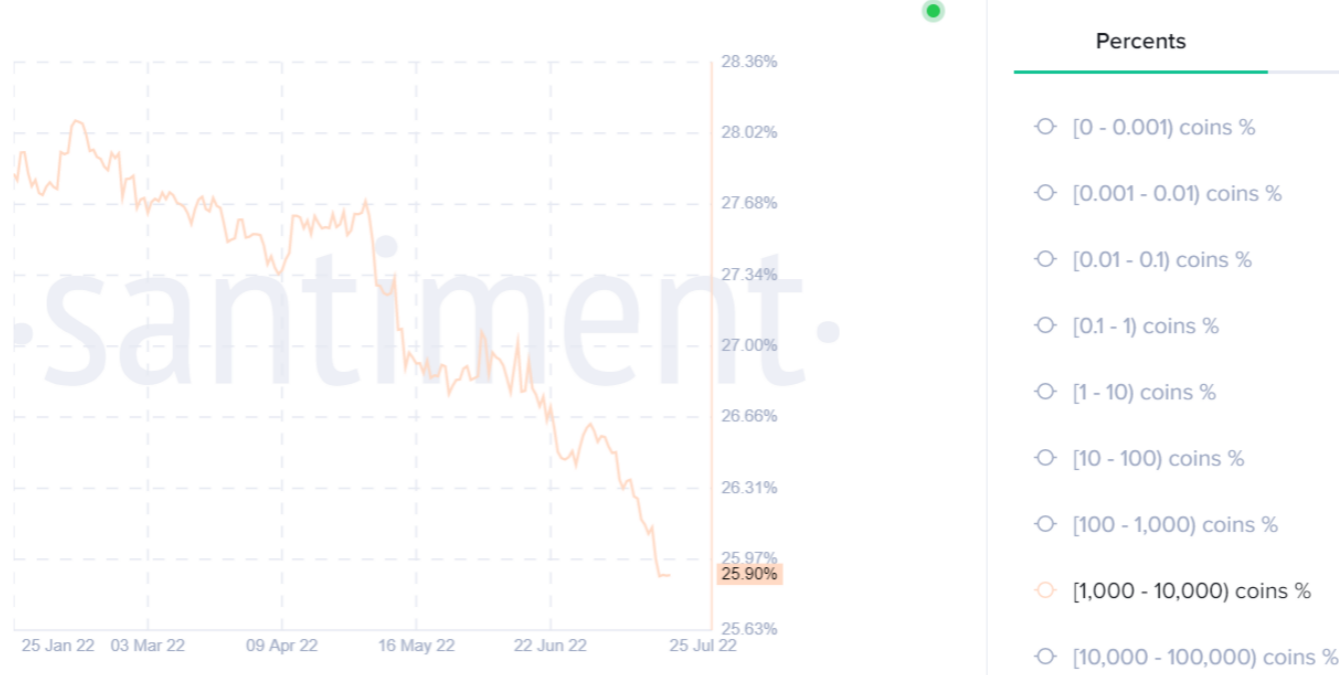
Bitcoin holdings of wallets having between 1,000 to 10,000 BTC. Source: Santiment.
Similarly, the miners haven’t shown positive accumulation to the likes of early 2021 or October 2021.
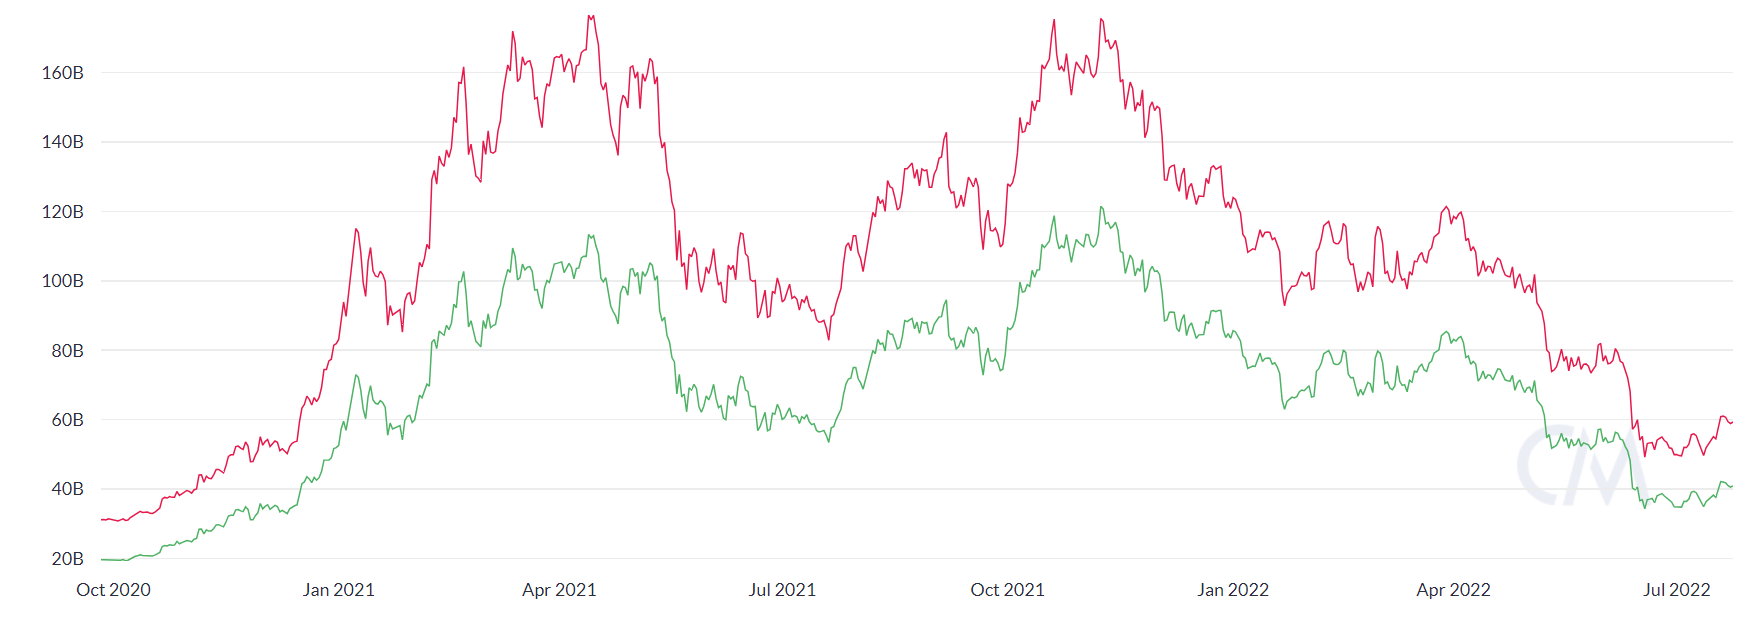
Bitcoin miner holdings of all addresses that received BTC from genesis blocks (in red), identified miner addresses (green). Source: Coinmetrics.
Overall, it seems that until the macroeconomic headwinds slow down, smart money is unlikely to turn bullish. This is one of the reasons why the current rally may fade quickly.
Wyckoff Unfolding
Bitcoin has all to play for this week after staging a significant range breakout but failing to close the weekly candle back above its 200-week moving average, currently at $22,780.
My take this week is that Bitcoin still has a chance to advance towards the $26,000 level as long as the price does not spend too much time below the $22,500 level, which is the former range high.
A Wyckoff accumulation pattern does seem to be unfolding on the 4-hour chart. If this pattern holds true, the next explosive rally should see the BTC/USD pair past the $24,300 level. The pattern’s last phase, or “phase E,” is probably the most explosive, so $26,000 is a soft target.
On the contrary, if sellers can defend the $22,500 resistance level, the chance of a deeper decline to the $21,000 or even $20,600 level becomes highly probable.
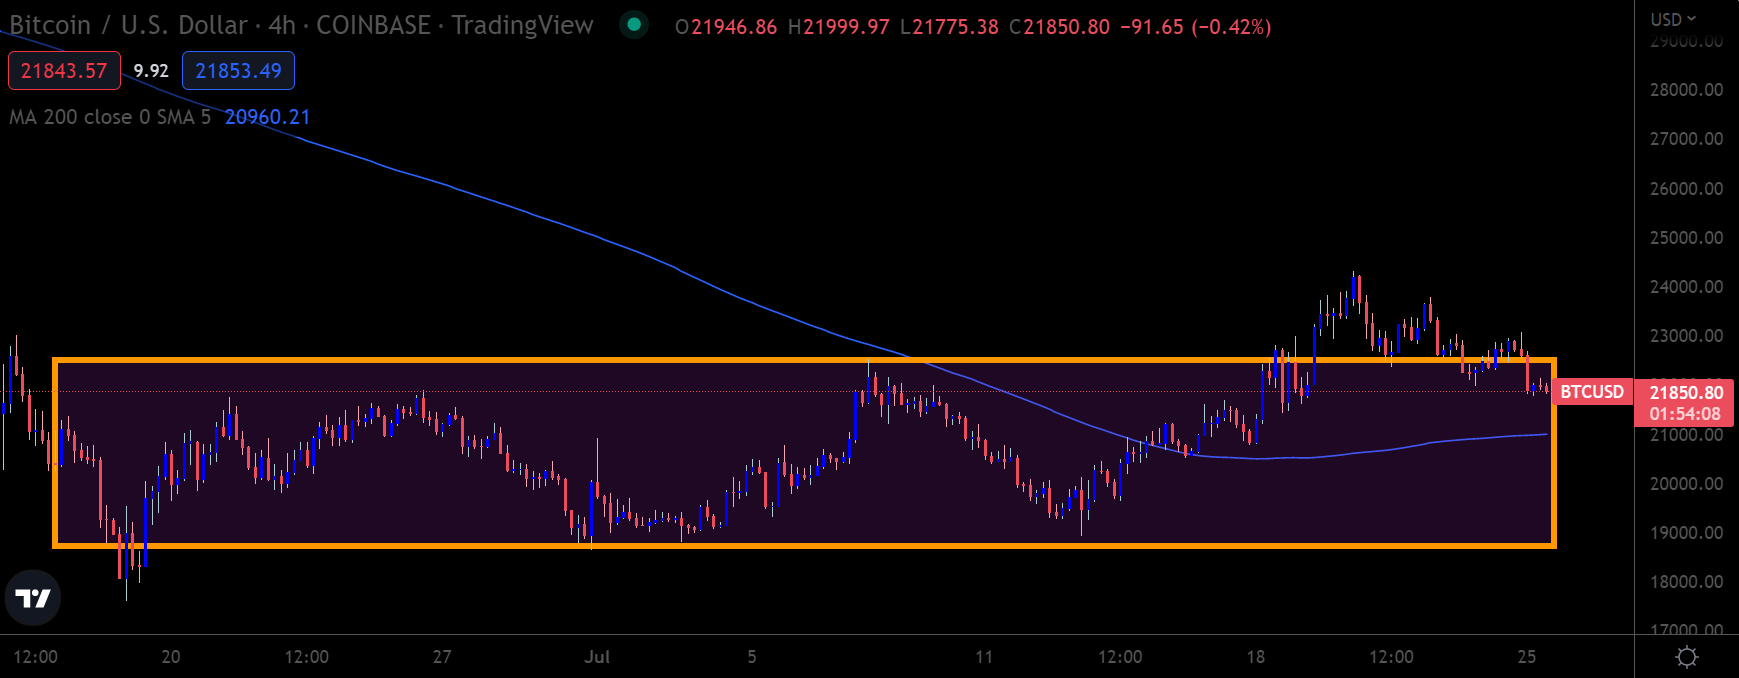
BTC/USD Daily chart. Source: Trading View
ETH Arrives at Crossroads
Similar to Bitcoin, a Wyckoff pattern is playing out on the daily time frame on ETH/USD. The difference here is that the ETH price action is more mature and, dare I say it, far more bullish at this stage.
I think Ethereum can be a tricky beast to predict at times. The trending moves often over-extend to the upside, and this is a solid reason alongside the mentioned Wyckoff pattern why the ETH/USD pairs upside is probably not done yet. In terms of price targets, I think that the $1,800 level is an excellent soft target, but the coin can run higher due to the Merge hype associated with it.
However, the risk here is that Ethereum might start to form a head and shoulders pattern from current levels, where the $1,500 level marks the pattern’s head with a base around $1,000. Watching the BTC/USD price action between $21,800 and $24,200 this week should help predict Ethereum price moves.
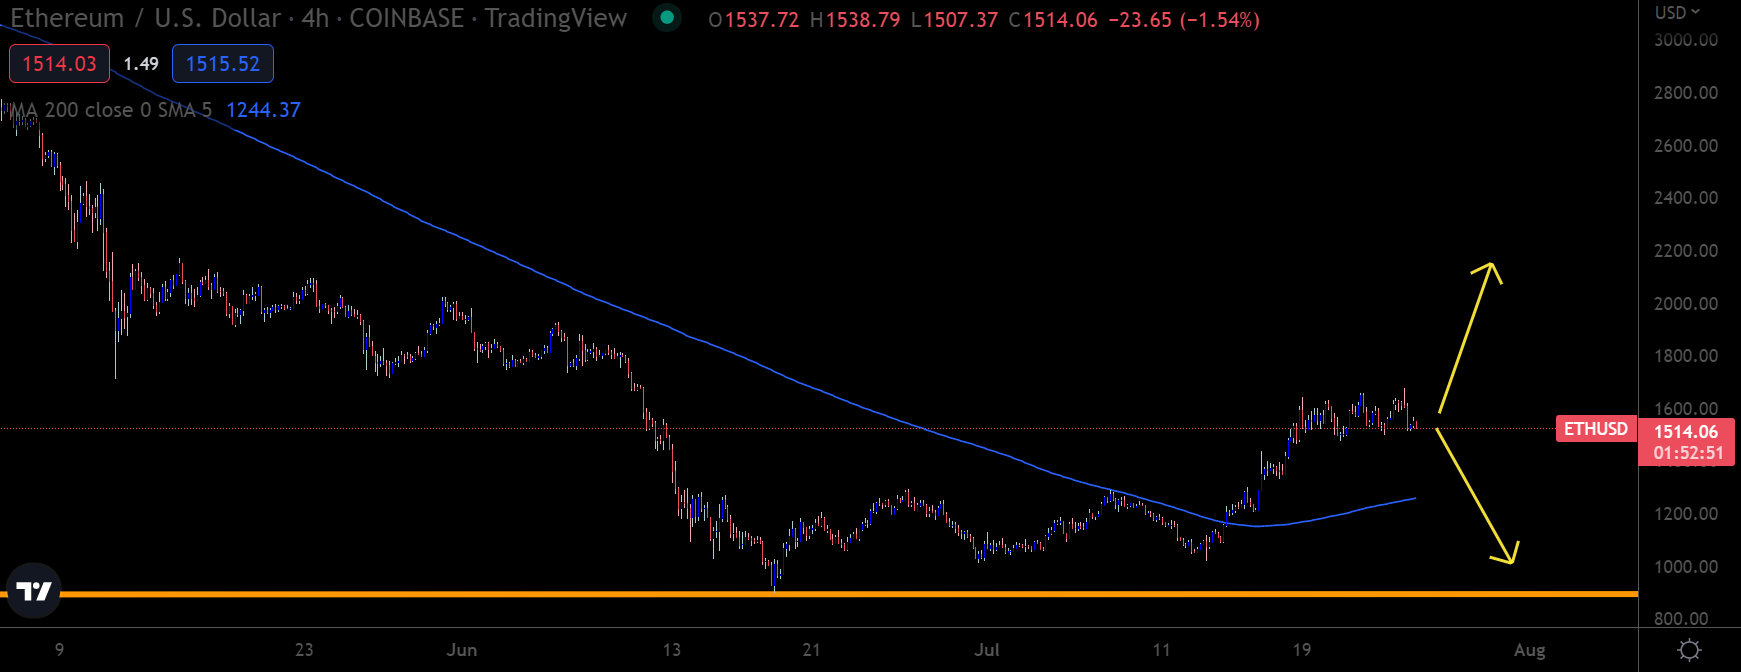
ETH/USD Daily chart. Source: Trading View
LTC Highs
Last week I touched upon Litecoin and where it would likely go in the short term. Seeing as the LTC/USD pair had a reasonably good trading week, I have decided to cover this coin again.
A near-perfect bullish inverted head and shoulders pattern has started to form on the lower time frames, which strongly hints LTC/USD could run towards the $70 to $75 level, pending a breakout of the $59.5 resistance. Bulls are also making higher and lower highs in the daily time frame, which is promising.
However, the current problem for Litecoin is the highs the coins are making are not that significant, and it failed to reach critical resistance at $65. Watch out for some selling pressure around this area.
The network recorded a spike in the Token Age Consumed metric last week. This spike strongly hints that a big directional move is coming down the pipeline for Litecoin. That said, LTC can quickly run towards $70 if BTC crosses $24,300 this week. On the contrary, a marketwide correction threatens to push the token back towards yearly lows of $40.
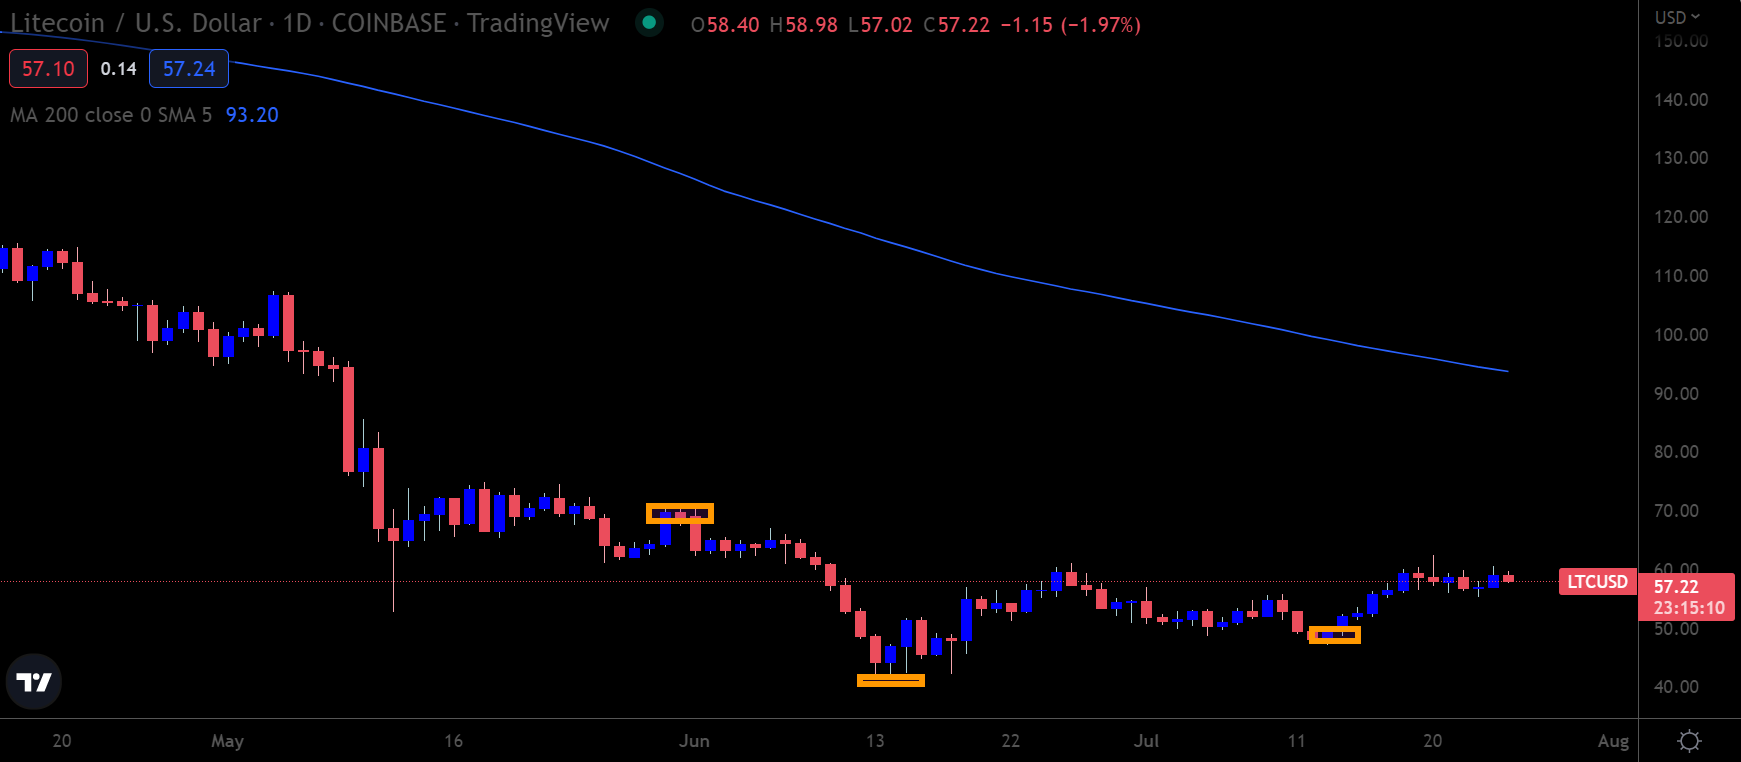
LTC/USD Daily chart. Source: Trading View
Don’t Fight The Fed
There is an old market saying that you “don’t fight the Fed.” In my experience, this holds legitimacy and is immensely relevant this week. This week’s main point of interest for the crypto market will be how the U.S. bank perceives inflation’s effect on the U.S. economy.
Traders will likely remain cautious until the Fed meeting. Other factors such as the earnings report and U.S. economic growth projection will keep the markets anticipating a recession on edge.
Bitcoin and the rest of the crypto market have gotten off to a weak start this week. It remains to be seen if bulls can turn things around or if macroeconomic headwinds will have the upper hand.
