December 14 Crypto Market Roundup

Bitcoin staged a powerful recovery last weekend after previously coming under heavy downside pressure towards the $17,600 support area.
BTC started the week above the $19,000 level, however, bulls struggled to hold above the $19,400 level and challenge the current yearly high, just below the psychological $20,000 barrier.
Technical warning signs start to flash at the start of the trading week, with the TD sequential and Bollinger Band indicators warning that a major bearish reversal could be on the horizon.
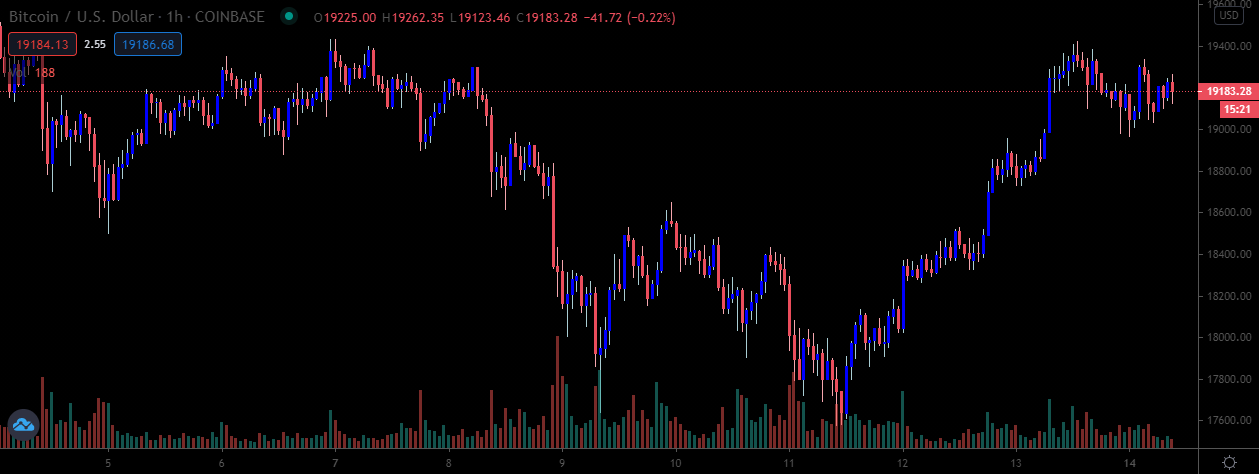
BTC/USD h1 Chart
Source: Tradingview
Market jitters also set in over the Mt.Gox reimbursement scheme, although the concerns regarding the upcoming risk event may have been exaggerated according to some sources familiar with the scam.
A major spike in BTC exchange inflows also forewarned that BTC could be due to stage a sizable downside correction.
Data from crypto behavioral platform Santiment showed the largest spike in BTC exchange inflows in over five-weeks.
Data provider Cryptoquant also showed that the Bitcoin Miners’ Position Index achieved a three-year high, indicating that miners were likely in a selling mood.
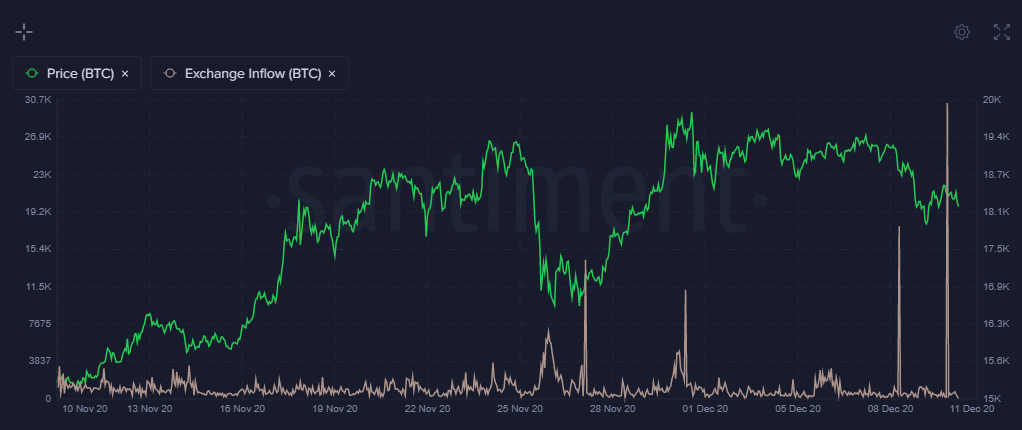
BTC Exchange Inflows
Source: Santiment
Bitcoin looked past a number of bullish headlines last week. Such as Microstrategy deploying yet more money in BTC, and Massachusetts Mutual Life Insurance (MassMutual), investing approximately $100 million in Bitcoin.
Even the announcement that the European Central Bank had added another $500 billion euros to its Pandemic Emergency Program failed to ignite BTC.
Instead, traders and investors chose to focus on negative developments such as the ongoing struggle to pass a COVID-19 bill in U.S. congress, and a falling stock prices due to concerns over Brexit and rising COVID-19 infections.

Source: ECB Europa
BTC social mention data from Santiment also showed a major decrease, as interest towards the first cryptocurrency fell to levels not seen since early October.
The Crypto Fear and Greed Index showed that traders remained in a state of “extreme greed, despite BTC staging close to a $2,000 price plunge from its former weekly high.
Last week’s Commitment of Traders report that leverage funds dramatically decreased BTC long positions, while professional traders generally remained cautious.
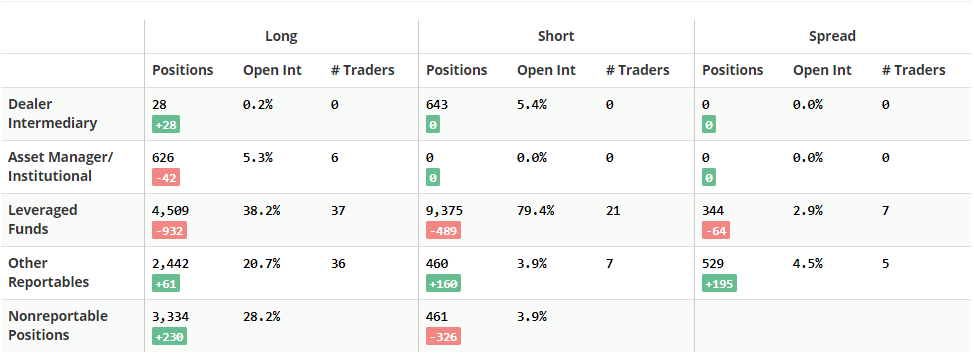
Source: Tradingster
The crypto total market capitalization suffered its first losing week since late-September, and reversed sharply from the $570 billion level to around the $500 billion mark.
Bitcoin’s network hash rate had a mixed trading week, and managed to finish the week in negative territory, despite the price recovery over the weekend.
Ripple’s scheduled airdrop event also caused plenty of volatility for XRP last week. Ripple pumped towards the $0.60 area before slumping under the $0.50 level, following the much-anticipated airdrop.
During my upcoming webinar I will be looking at On-chain exchange metrics, and also I will be charting Bitcoin (BTC), Ethereum (ETH), Cardano (ADA), and Ripple (XRP).
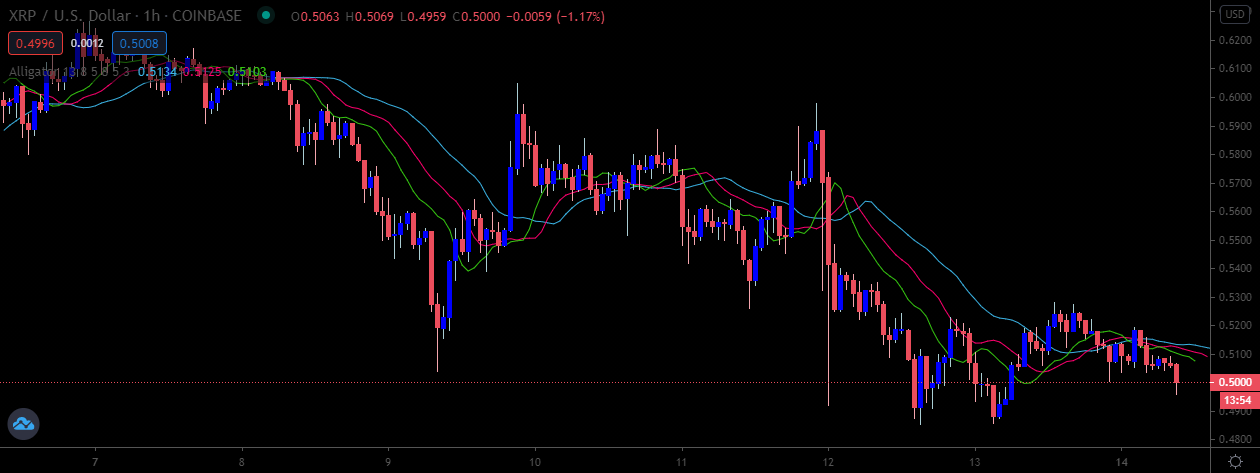
Source: Tradingview
The Week Ahead
As I noted last week, the chances were increasing that BTC was about to correct, and now that it has happened, BTC bulls will need to maintain the upside momentum that we witnessed over the weekend.
Considering the overall percentage drop and subsequent recovery, the market is currently hinting that a meaningful bottom could have formed, and that BTC bulls still have a shot at cracking $20,000 before 2020 is over.
I will touch more on the technicals laters, the fact that the $18,900 level held on the weekly close is favorable for bulls going into this week.
Some on-chain developments currently suggest that a possible reversal could be on the horizon, as whales have shown up over the weekend, and produced the largest spike in Token Age Consumed in 40-day.
This is important, as it suggests a big directional move is coming this week. We should know which way the market will break once the $19,600 to $18,400 range is broken.
Bitcoin’s market dominance chart also looks fairly bullish, which leads me to believe that BTC could start to outperform altoins in the near-term.
Whether this means that Bitcoin’s downside is done, and altcoins will lag remains to be seen. Equally, it could mean that altcoins will lose more than BTC in percentage terms if we take another tumble lower this week.
Looking at the economic calendar this week, traders will be focused on the FOMC policy decision, and it could very well be a market mover for Bitcoin.
If the central bank talks down the U.S. economy, stocks and risk sentiment could get hit hard. The calls for more stimulus are bound to follow, leaving investors even more worried about the political deadlock ongoing in Washington at the moment.
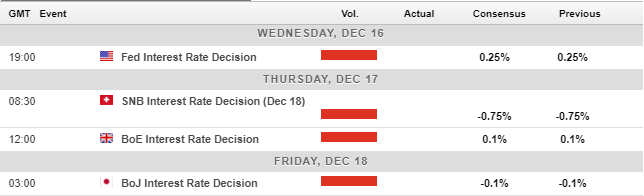
Economic Calendar
Source: Forexlive
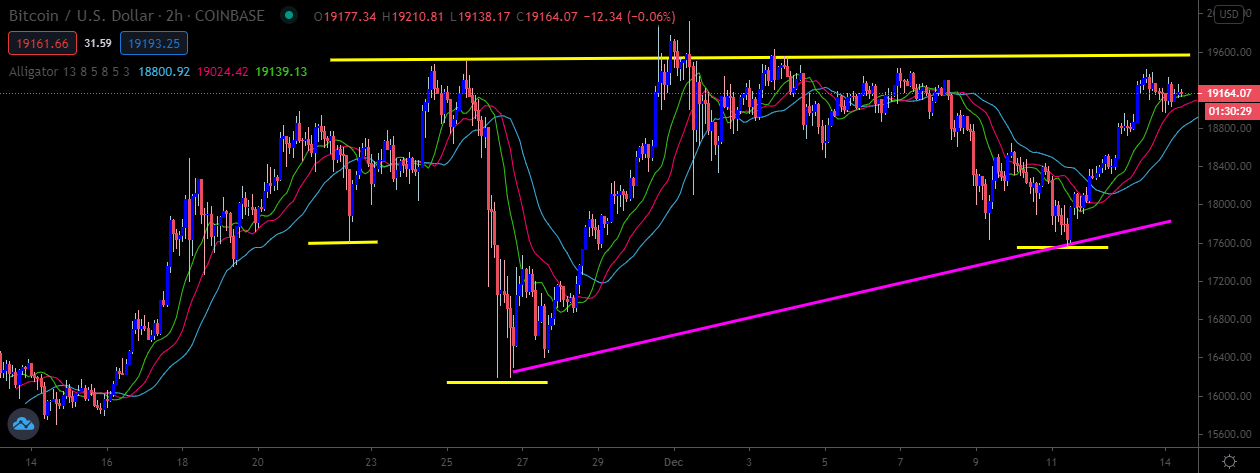
The technicals surrounding Bitcoin (BTC) are fairly simple at the moment. Bulls need to anchor the price above $19,600 to activate a bullish reversal pattern with some serious upside potential.
Looking more closely at the inverted head and shoulders pattern that has formed, the structure has been completed during last week’s sudden rise and fall. This is bullish in the short-term.
However, if BTC consolidates for an extended period of time I have noticed that this pattern could shift into an ascending trending pattern, which means BTC will probably break higher, but we may see some more dips in the meantime.
The weekly pivot point is located at $18,920 this week. It’s always worth watching. Weakness under this area and the downside targets are $18,650, $18,400 and $18,100.
Sustained daily weakness below $18,400 and I would expect price capitulation towards the $17,000 level this week.
To the upside, sustained gains above the $19,600 level would activate the mentioned bullish pattern, placing $22,000 to $23,000 as valid upside targets. The $19,900, $20,700, and $21,200 levels are the main resistance barriers on the road to $22,000.
ETH/USD Daily Chart
Source: Tradingview
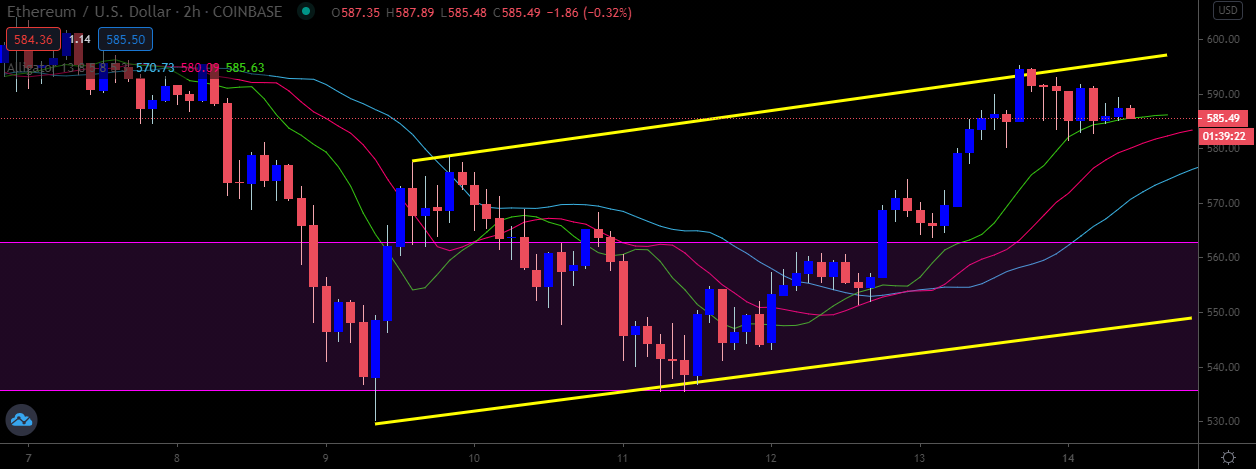
Ethereum (ETH) is in a strange spot this week, and as such bulls really need to steady the second-largest crypto above the $600 resistance barrier to encourage more technical buying.
Lower time frame analysis does show ETH/USD trapped inside a bearish flag pattern, which means that an even more pronounced price drop could be about to take place towards the $500 level.
Again, failure to overcome the top of the mentioned flag pattern could see ETH/USD smacked back down towards the $540 area, and possibly much lower.
Should we see a breakout above the flag pattern then we should expect a coming challenge towards the $640 level. Sustained gains above the $640 level could just start the expected rally towards $770.
Conventional wisdom suggests that dip-buyers will be lurking below the $500 level if we did see a major price drop this week. With that said, it could be the last time to acquire ETH/USD at a reasonable price before it starts to rally again.
Key support below the $500 level is found at $480 and $460, with the $440 level this big support area to watch below. Personally, I would be surprised to see ETH much lower than $500 before bulls step in.
ETH/USD Daily Chart
Source: Tradingview
