November 30 Crypto Market Roundup

BTC broke its recent winning streak last week, as rumors about coming U.S. regulation on wallet holders caused the number one crypto to plunge towards the $16,200 support level.
A Tweet from Coinbase’s CEO, Brian Armstrong, expressing his fears about the Trump administration rushing through draconian U.S. regulation prompted the BTC price crash.
Prior to severe crypto market drop Bitcoin moved within touching distance of it’s all-time price, with BTC/USD reaching $19,500 on a number of cryptocurrency exchanges.
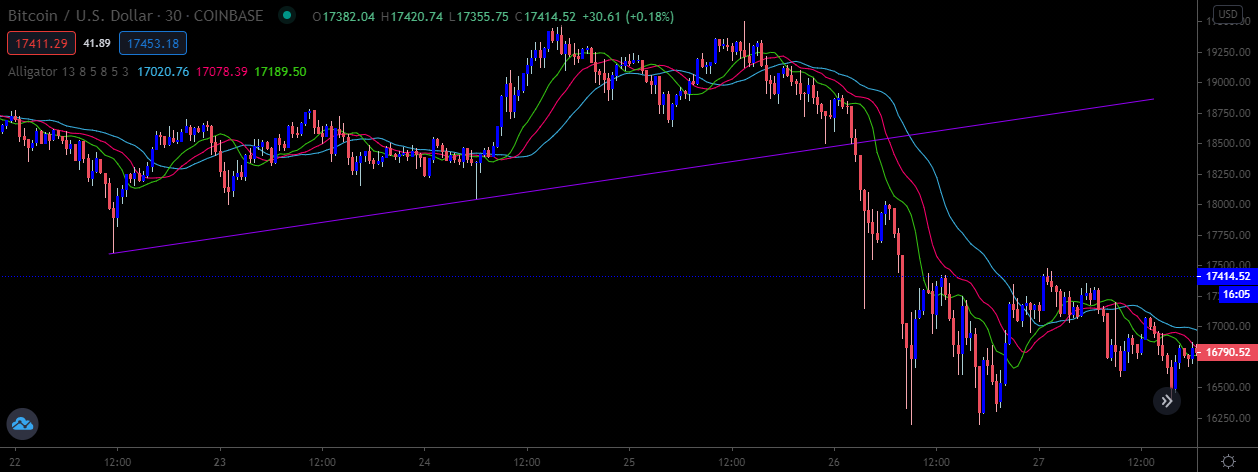
BTC/USD 30-Minute Chart
Source: Tradingview
BTC did manage to regain its composure over the weekend, following news that global investment firm Guggenheim are set to deploy $500 million into BTC.
MVRV data from Santiment showed that 365-day coin holders achieved profits of nearly 70% during Bitcoin’s recent epic bull run to $19,500.
Data from crypto analytics provider Glassnode also showed OKEx users may have contributed to selling pressure last, as investors dissatisfied with the exchange’s lack of update surrounding the company’s recent withdrawal pause sold their Bitcoins.
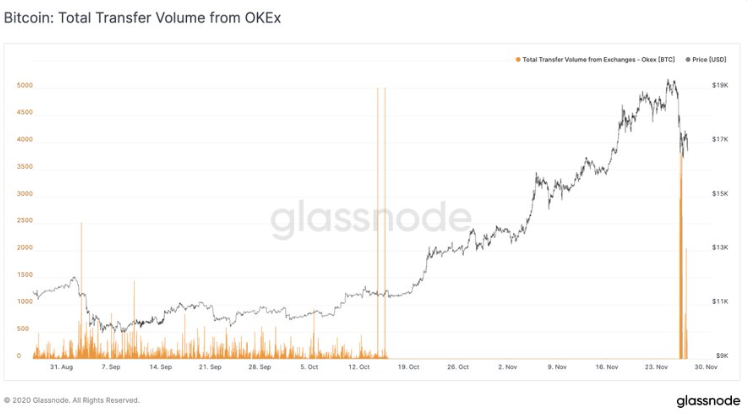
BTC Total Transfer From OKEx
Source: Glassnode
Data from on-chain analytics provider Glassnode also revealed that traders flooded exchanges with Bitcoin after the bearish regulatory rumors, ending the recent supply drought.
A number of red flags had started to emerge prior to last week’s major cryptocurrency market sell-off, alerting traders to the fact that a market correction may be nearing.
The Crypto Fear and Greed Index moved within one point of its all-time high last week, giving a warning shot to investors as the market had entered almost unparalleled levels of “extreme greed”.
Mainstream media publications also get on the action last prior to the market correction. With Bitcoin going on the front page of the Wall Street Journal.
Historically, market tops in BTC have formed when the mainstream media start to pay close attention to Bitcoin, and cryptocurrencies.
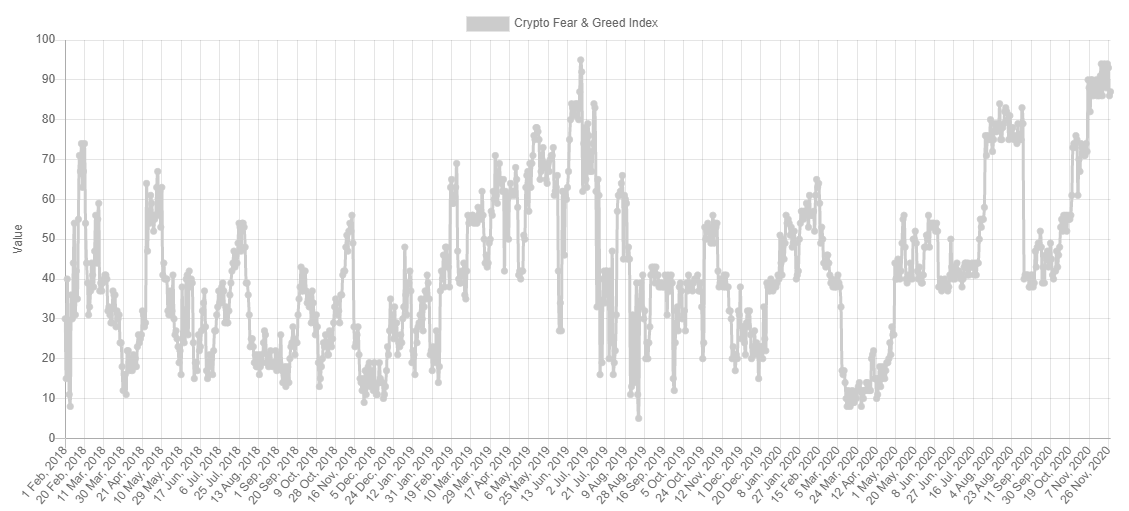
Source: Alternative.me
A number of market forecasters also predicted that Bitcoin would rise to $500,000, further stoking mainstream speculative interest towards the number one digital asset.
Last week’s Commitment of Traders report also showed that leveraged funds and small sized traders increased bullish bets, prior to Bitcoin’s epic price drop.
Data from crypto behavioral platform Santiment showed that large coin holders used the market sell-off as an opportunity to book profits.
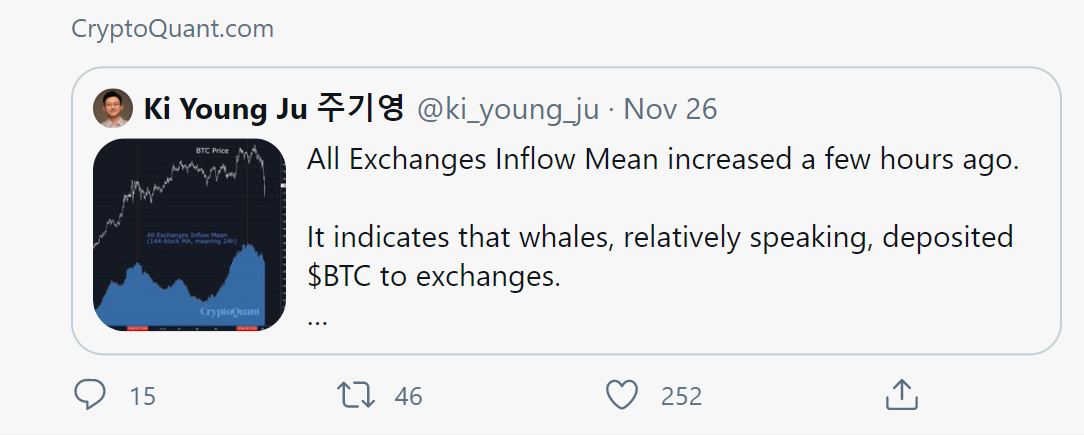
CryptoQuant also confirmed that BTC whales had used last week’s price pullback as a chance to book massive profits ahead of the Thanksgiving holiday, and fiscal year.
The crypto total market capitalization advanced towards the $590 billion level last week, marking its highest trading level since January 2018.
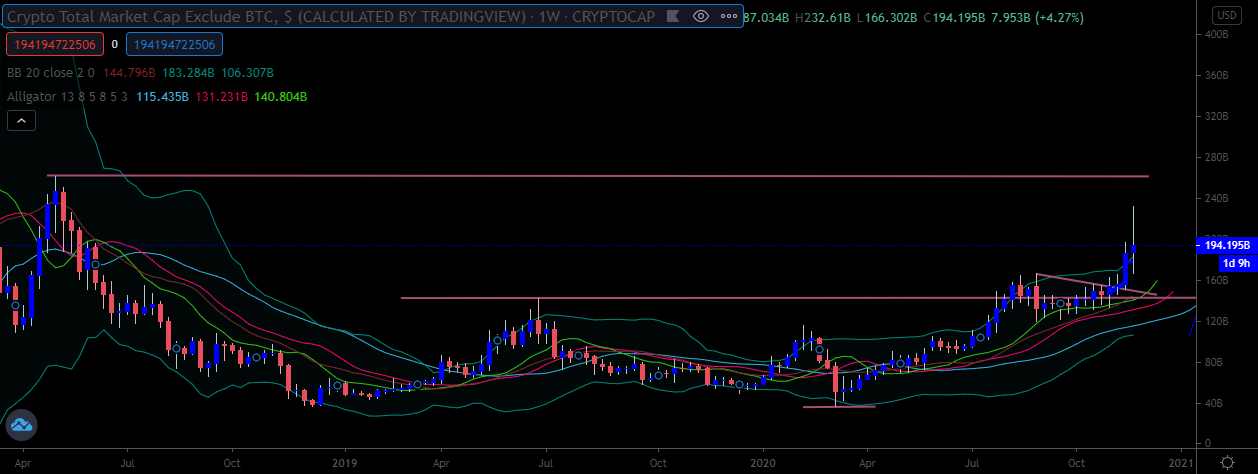
Major moves also took place in the crypto total market cap chart (excluding BTC), as altcoins surged prior to last week’s crypto currency market price crash.
Ripple stole the headlines in the altcoin space, as the third-largest cryptocurrency rallied towards $0.90 cents, before staging a 50% price crash towards the $0.45 cents area.
During my upcoming webinar, I will be charting Ripple (XRP), Stellar Lumen (XLM), and Ethereum (ETH).
Source: Tradingview
The Week Ahead
Traders looking for clarity surrounding future U.S. crypto regulation may be left disappointed this week, as U.S. regulators have so far denied to issue a response to the regulatory rumors.
It really remains to be seen if U.S. regulators will pull a Grinch style maneuver on crypto participants this close to Christmas. I suspect not, and my opinion is that it may be rolled out in early-January, if indeed the rumors are true.
With this in mind, traders are likely to focus on the recent positive news that yet another big investment fund is deploying capital into BTC.
Technically, a lot of big levels on the charts are still missing, such as $20,000 and $20,600. I would not be surprised to see these levels tagged this week if bullish sentiment continues to take hold.
The same can also be said for altcoins, a lot of big upside targets are missing on the charts, and the total cryptocurrency market capitalization chart (BTC) reversed from a very unusual spot last week, and is still flagging more upside to come.
As far as potential red flags, the fact that retail sentiment remains so bullish on social media and that new BTC addresses are being created at a record pace as these levels is definitely a concern.
Traders who were burnt during the last bull cycle will almost certainly grow nervous if we see more mainstream coverage of the current breakout rally.
Looking at the economic calendar this week, the Federal Reserve Chairman Jerome Powell is set to testify this week. The need for U.S. stimulus is likely to be underscored by Chair Powell, and this could be yet another bullish catalyst for Bitcoin.
Traders also have the U.S. monthly jobs report, manufacturing, housing, and services data to look forward to this week.
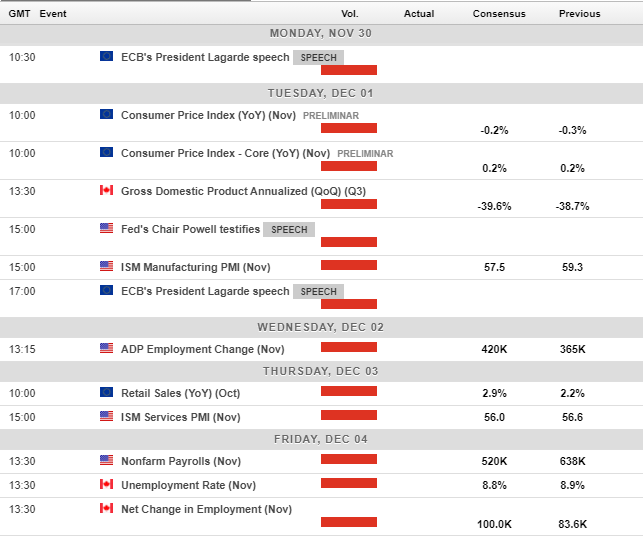
Economic Calendar
Source: Forexlive
Bitcoin (BTC) Bitcoin has staged a solid comeback after coming under severe technical pressure last week, and keeping the bull case well and truly alive as we head into December.
BTC reversed from quite an unusual place on the chart last week, adding credence to the idea that last week’s dip was caused by profit taking, and not a meaningful trend change.
The weekly time frame shows that the $20,300 and $20,700 area key areas that are still expected to be hit before we possibly see a much deeper technical correction.
A large bullish inverted head and shoulders pattern is still pointing to $22,000 on the weekly chart, leaving plenty of scope for BTC to advance above the $20,000 level next month.
Once $20,000 is achieved a huge inverted head and shoulders pattern would have been officially formed, with $16,000 upside potential, meaning that $34,000 is now a valid target.
Traders looking for areas to safely enter back into the bullish trend this week may look anywhere between the $17,400 and $16,900 levels.
A number of key technical indicators continue to show bearish price divergence extending down towards the $14,000 to $13,000 area.
I would expect this negative divergence to be unwound at some stage once the mentioned upside targets are hit between the $20,700 and $22,000 levels.
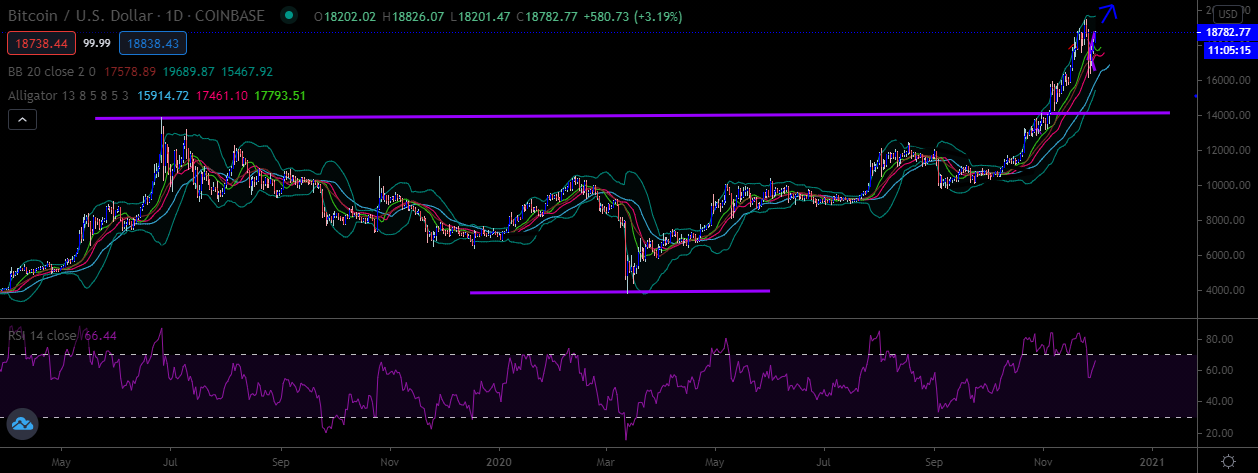
BTC/USD Daily Chart
Source: Tradingview
Ethereum (ETH) saw strong buying interest from below the $500.00 level last week, further hinting that ETH/USD bulls are preparing to take the second-largest crypto to a new yearly high.
Similar to BTC, ETH stopped in a strange spot last week, as the chart clearly showed $638 and $770 as the bullish targets that needed to be achieved before a wider pullback could safely take place.
The total market cap chart (excluding BTC) is still showing tremendous upside, and is expected to rally way beyond what we have seen so far in terms of upside. This is extremely positive for Ethereum.
With that said, I would expect that ETH/USD could easily overextend the mentioned bullish targets and get fairly close to $800.00.
Traders looking for a pullback in the ETH/USD pair this week may look to the $540 or $520 support regions as potential entry points, if they are very lucky. Again, it may not come, and ETH could easily just keep on trucking higher.
Sustained weakness under the $480 level on a daily basis may encourage bears to target $440, and possibly even $365. However, it does not seem likely at this stage without an extreme bearish catalyst.
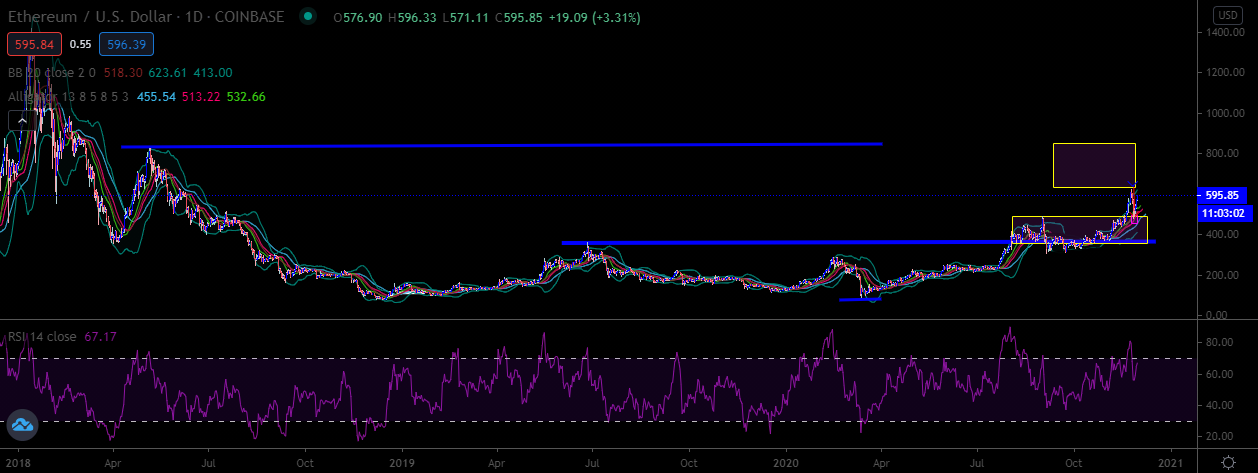
ETH/USD Daily Chart
Source: Tradingview
