It’s Ok to Not Know the Future.

As we continue to drift in the ‘crab’ market, many try to figure out the market’s next move. From a technical trader’s standpoint, there’s a meaning in this. Relying on some indicators, they can capitalize on short-to-mid price fluctuations, and our pro trader Nathan Batchelor does a good job of helping with that.
However, for long-term investors, there’s little point in trying to time the market. On a long enough timeframe, quality assets will likely perform exceptionally well, which is why our Picks from 2019-2020 are still heavily in the green. So, even if you didn’t get in at the very bottom, you still win.
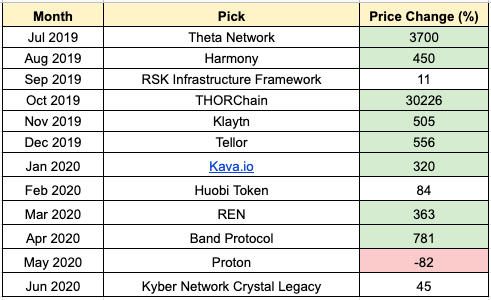
Out of 12 picks since July 2019, 8 are still at multiple X returns, three are still in the green, and only one is heavily in the red. Note: we didn’t close some projects like Harmony at the above ROI, but it’s still a good estimate of how quality assets perform on long timeframes.
Let me remind you that during bear markets, positive headlines are often overlooked. Conversely, negative ones are often dismissed during bull markets. During crab markets, there’s a lot of noise, and you need a good reason to try and find a signal there.
If you are in for a long term, as you probably should be given the SIMETRI approach, I believe it’s enough to read what Christian and the rest of the editorial team are publishing on Crypto Briefing. This will help you to stay up to date with the most important news.
Other than that, if you’re not trading actively, you can be comfortable with not knowing the future. When you choose quality and wait long enough, the market will most likely reward you nicely.
SIMETRI Portfolio – What if You Don’t Know the Future?
In the previous issue of Digest, we discussed how you could find the most efficient portfolio if you account for a risk-free rate. However, there’s one important limitation to what we’ve learned so far.
As I’ve been saying over the past weeks since we started learning about portfolio construction, past performance can serve as guidance, but it doesn’t provide a good estimate of future returns. Estimating expected returns is extremely difficult. If it wasn’t, we wouldn’t need to work that hard to master the markets.
When we were looking for optimal portfolios, we relied on historical returns. This approach is fairly limited because of the reason outlined above. Let’s run through a quick example.
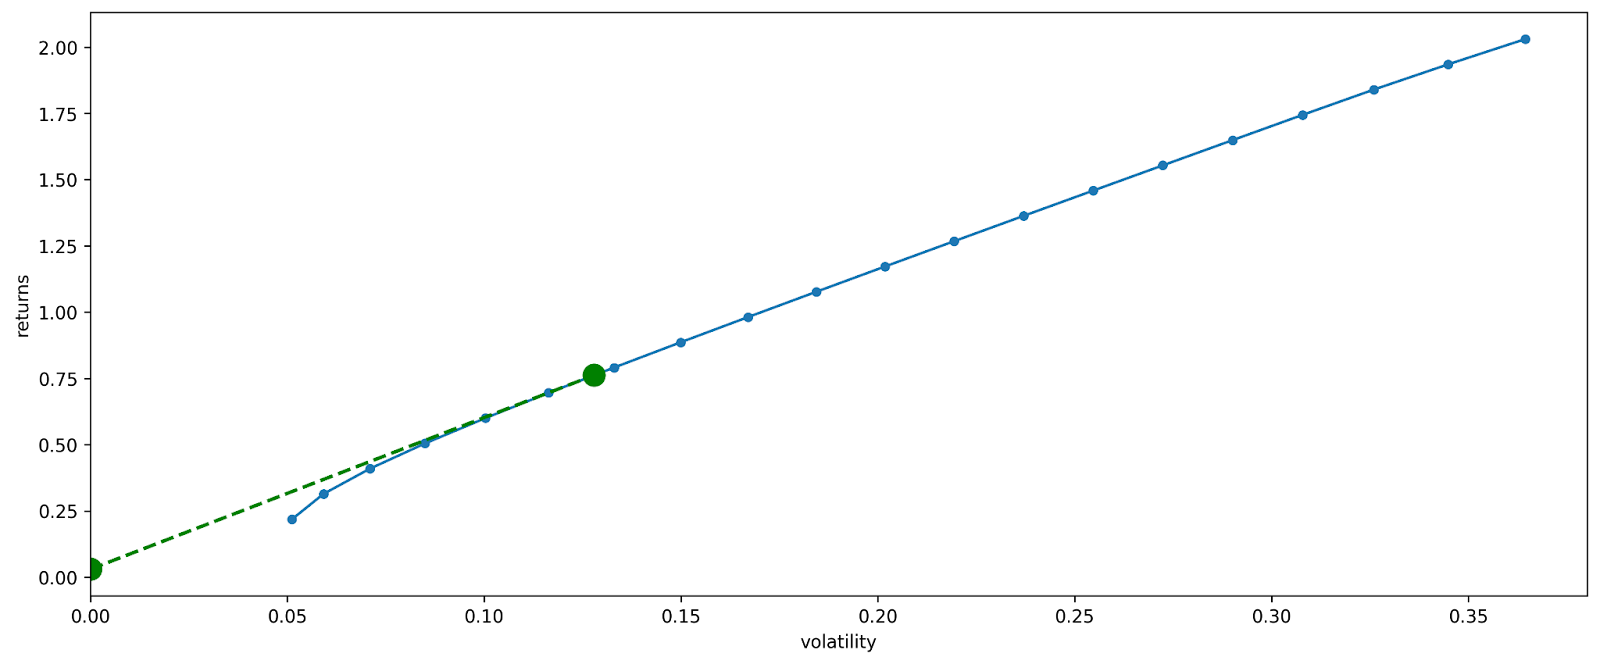
Let me bring up the chart we came up with last time when we found the most efficient allocation with a risk-free rate in mind.
- IVV (S&P 500 ETF) – 65.45%
- BTC – 7.2%
- PoM – 27.2%
- IVV – 21.8%
- BTC – 89.7%
- PoM – 203%
- IVV – 25%
- BTC – 90%
- PoM – 205%
- IVV – 76.2% (originally 65.45%)
- BTC – 3.4% (originally 7.2%)
- PoM – 20.3% (originally 27.2%)
That’s quite a dramatic change given only a slight change in expected returns. In professional slang, that’s called ‘garbage in, garbage out.’
So, if we can’t predict future returns, does it mean all we have learned so far is useless? Fortunately, no. There’s an approach to find optimal weights in a portfolio without relying on expected returns. This approach is called the ‘Global Minimum Volatility’ portfolio.
As you can see by its name, the approach focuses on finding an efficient portfolio with the lowest possible volatility. Remember, the most efficient portfolios lie on the efficient frontier. So, we want to find a point on it that corresponds to a portfolio with the lowest volatility.
A covariance matrix of the returns represents the volatility of a portfolio. Covariance combines volatility and correlation of assets. Remember, the less the correlation between assets in a portfolio is, the better.
It turns out that we have tools that can get good estimates of covariance. Hence, we can use it with higher confidence than expected returns.
Now goes the weird part. The Global Minimum Volatility portfolio minimizes volatility, while BTC and PoM are way more volatile than IVV. So, when you run the math on the covariance matrix that includes IVV, BTC, and PoM, the Global Minimum Volatility portfolio is 100% in IVV.
That’s not ideal because you want to capture outsized returns of crypto assets.
The next portfolio that doesn’t consider expected returns is equally weighted. As the name suggests, the weights are equally split between IVV, BTC, and PoM, so each gets around 33%.
The equally weighted portfolio is a naive approach, so it’s not perfect. But, in our case, an equally weighted portfolio is very close to the efficient frontier, so it makes sense.
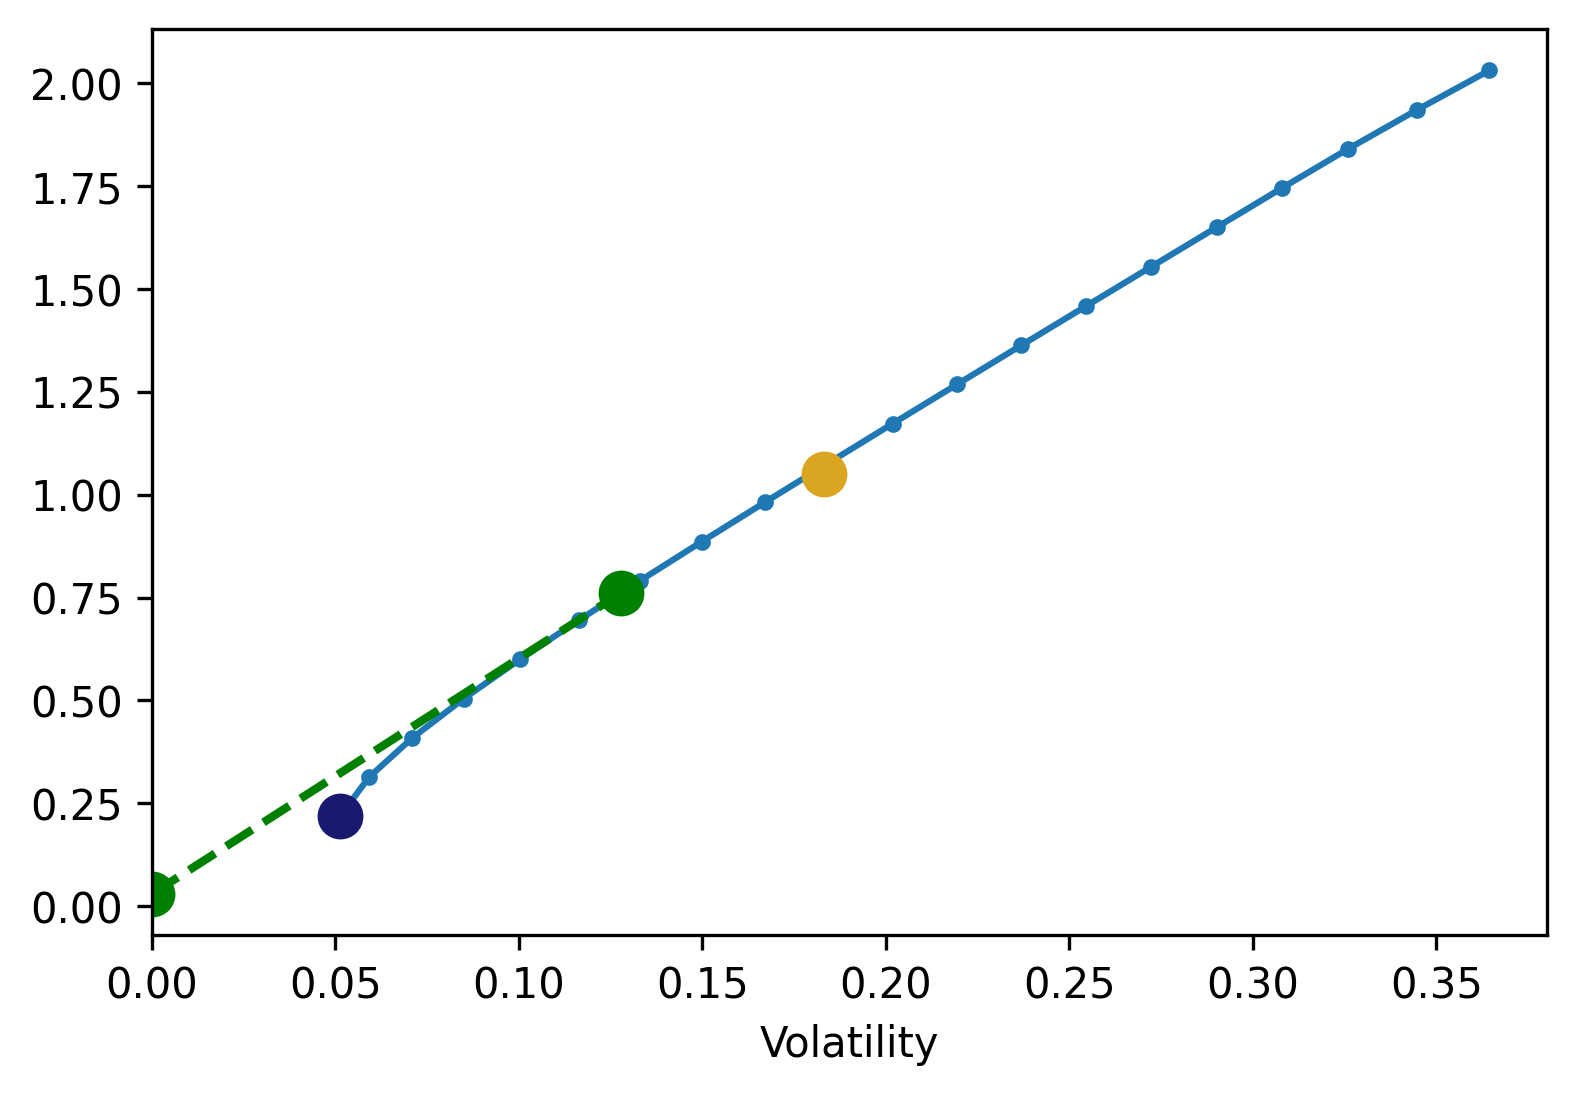
Global Minimum Volatility (purple dot), Minimum Sharpe Ratio (green dot), and equally weighted (yellow dot) portfolios.
That’s all for construction. Now let’s look at the SIMETRI portfolio…

