BUIDLing a perfect portfolio.

Today we have a lot to cover, so I will keep the introduction short. Overall, we’re still in a sideways channel and not much has changed.
I’m happy that we’re still above the critical support level of ~$30,000 for Bitcoin. But remember that weekends usually have more volatility. We may see a test of this level.
We had a pretty in-depth overview of the market in our LIVE Crypto Week in Review session on Discord. If you aren’t already part of our Discord, message support, and we’ll help you join our active chat server. I’m sure you’ll love the community there.
Now, let’s get moving. We have a lot to cover.
SIMETRI Portfolio – Using the Risk-Free Rate
In the previous issue of Digest, we examined how to construct portfolios to maximize returns for a given level of volatility and risk. If you took notes from last week, all of these optimal portfolios are on the so-called efficient frontier.
Let’s take this concept a step further. If you have a bunch of optimal portfolios, which one do you pick? It turns out the answer depends on something as seemingly unrelated as the interest rate on U.S. Treasury bills.
What Treasury Bills tell you is something called the “risk-free rate.” The risk-free rate is merely the value of lending and borrowing money if you’re guaranteed to get paid. In other words, it’s risk “free.” Now this ties into Treasury Bills because financial big-brains use it as a convenient way of measuring the risk-free rate of interest.
Now to get a bit more technical, certain investments are exposed to the entire market. When the market falls, the investment loses value, even if its fundamentals are completely unchanged. This is called systematic risk.
On the reverse side, if there’s an event that only impacts a specific business, like Jeff Bezos retiring in the case of Amazon, is an example of idiosyncratic risk. It’s firm-specific to AMZN.
If you instead buy a 30-year government bond, a drop in prices for that kind of asset usually reflects a change in global economic conditions—systematic risk. Not too hard when you get the jargon out of the way, right?
Now Treasuries are an excellent gauge of the risk-free rate. The problem is that the yields on them are very low, and sometimes, unbelievably, even negative!
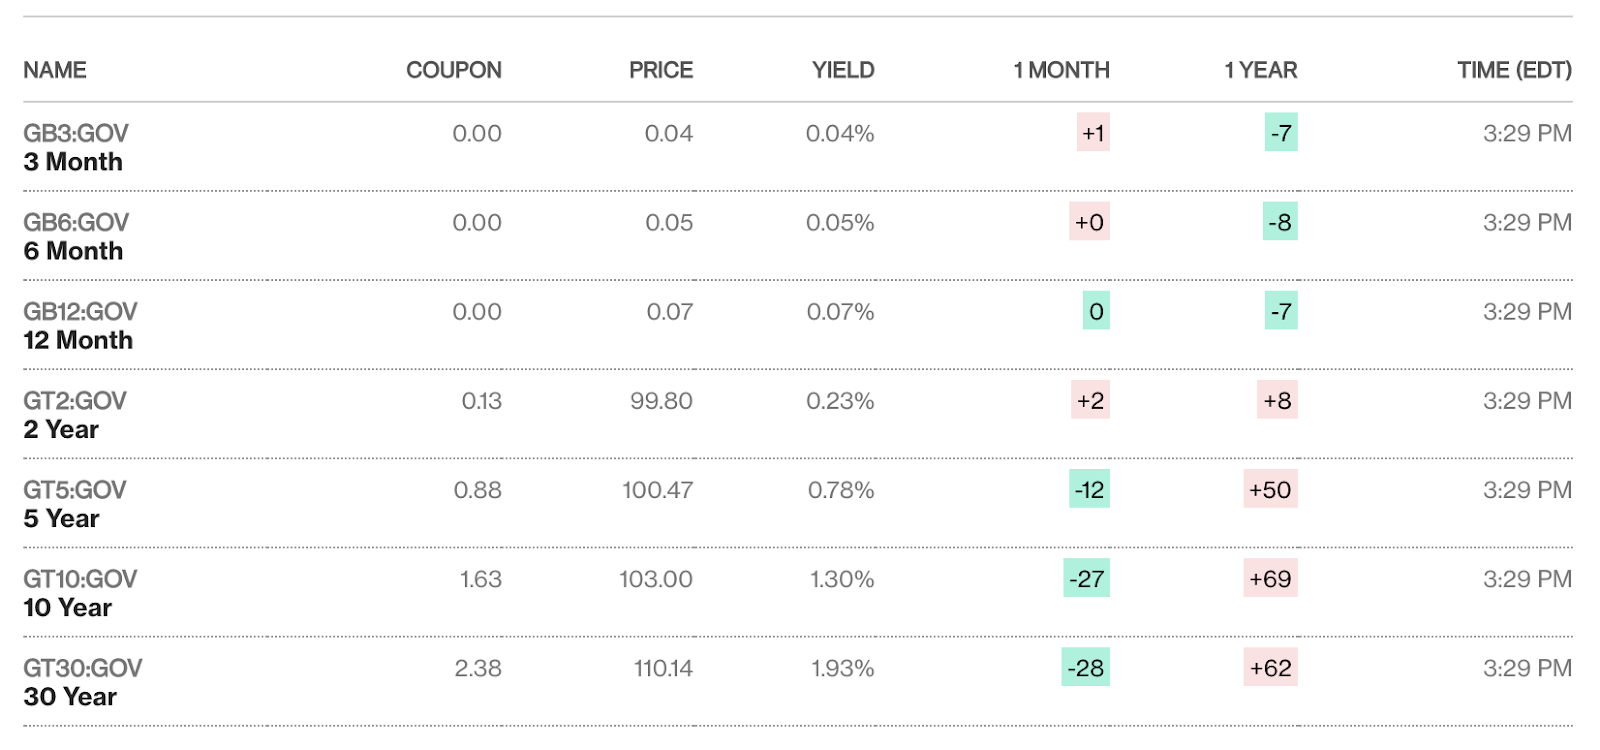
Treasury yields. Source: Bloomberg.
I want to offer you something else to consider. I know that what I’m about to propose isn’t risk-free by the traditional definition. But I believe it’s the closest thing we can get in the world of crypto.
In crypto, we have at least two options of earning with very low risk. I would say that this risk is largely systematic for the industry.
The first is to earn yields on stablecoins using well-established platforms like Aave and Compound. Yes, there’s a risk that these platforms can suffer hacks or exploits. But there are implicit guarantees baked into these platforms. Their credibility and institutional relationships are on the line, so it’s highly likely that they’ll reimburse losses.
The second is using platforms like Element to buy stablecoins at discounted prices and holding them until maturity. You can learn more about this by reading Farmer’s Almanac from Sergey here. Again, if something happens to these platforms or stablecoins, that would be a serious hit to the entire industry. So, the risk here is systematic.
At this point, the market is suppressed. But yields on stablecoins are still much higher than Treasury Yields. When I asked Sergey, he said that even if the market takes another plunge, there will still be opportunities to earn 3-4% on stables. In my examples below, I’ll stick to a 3% risk-free rate based on my proposal.
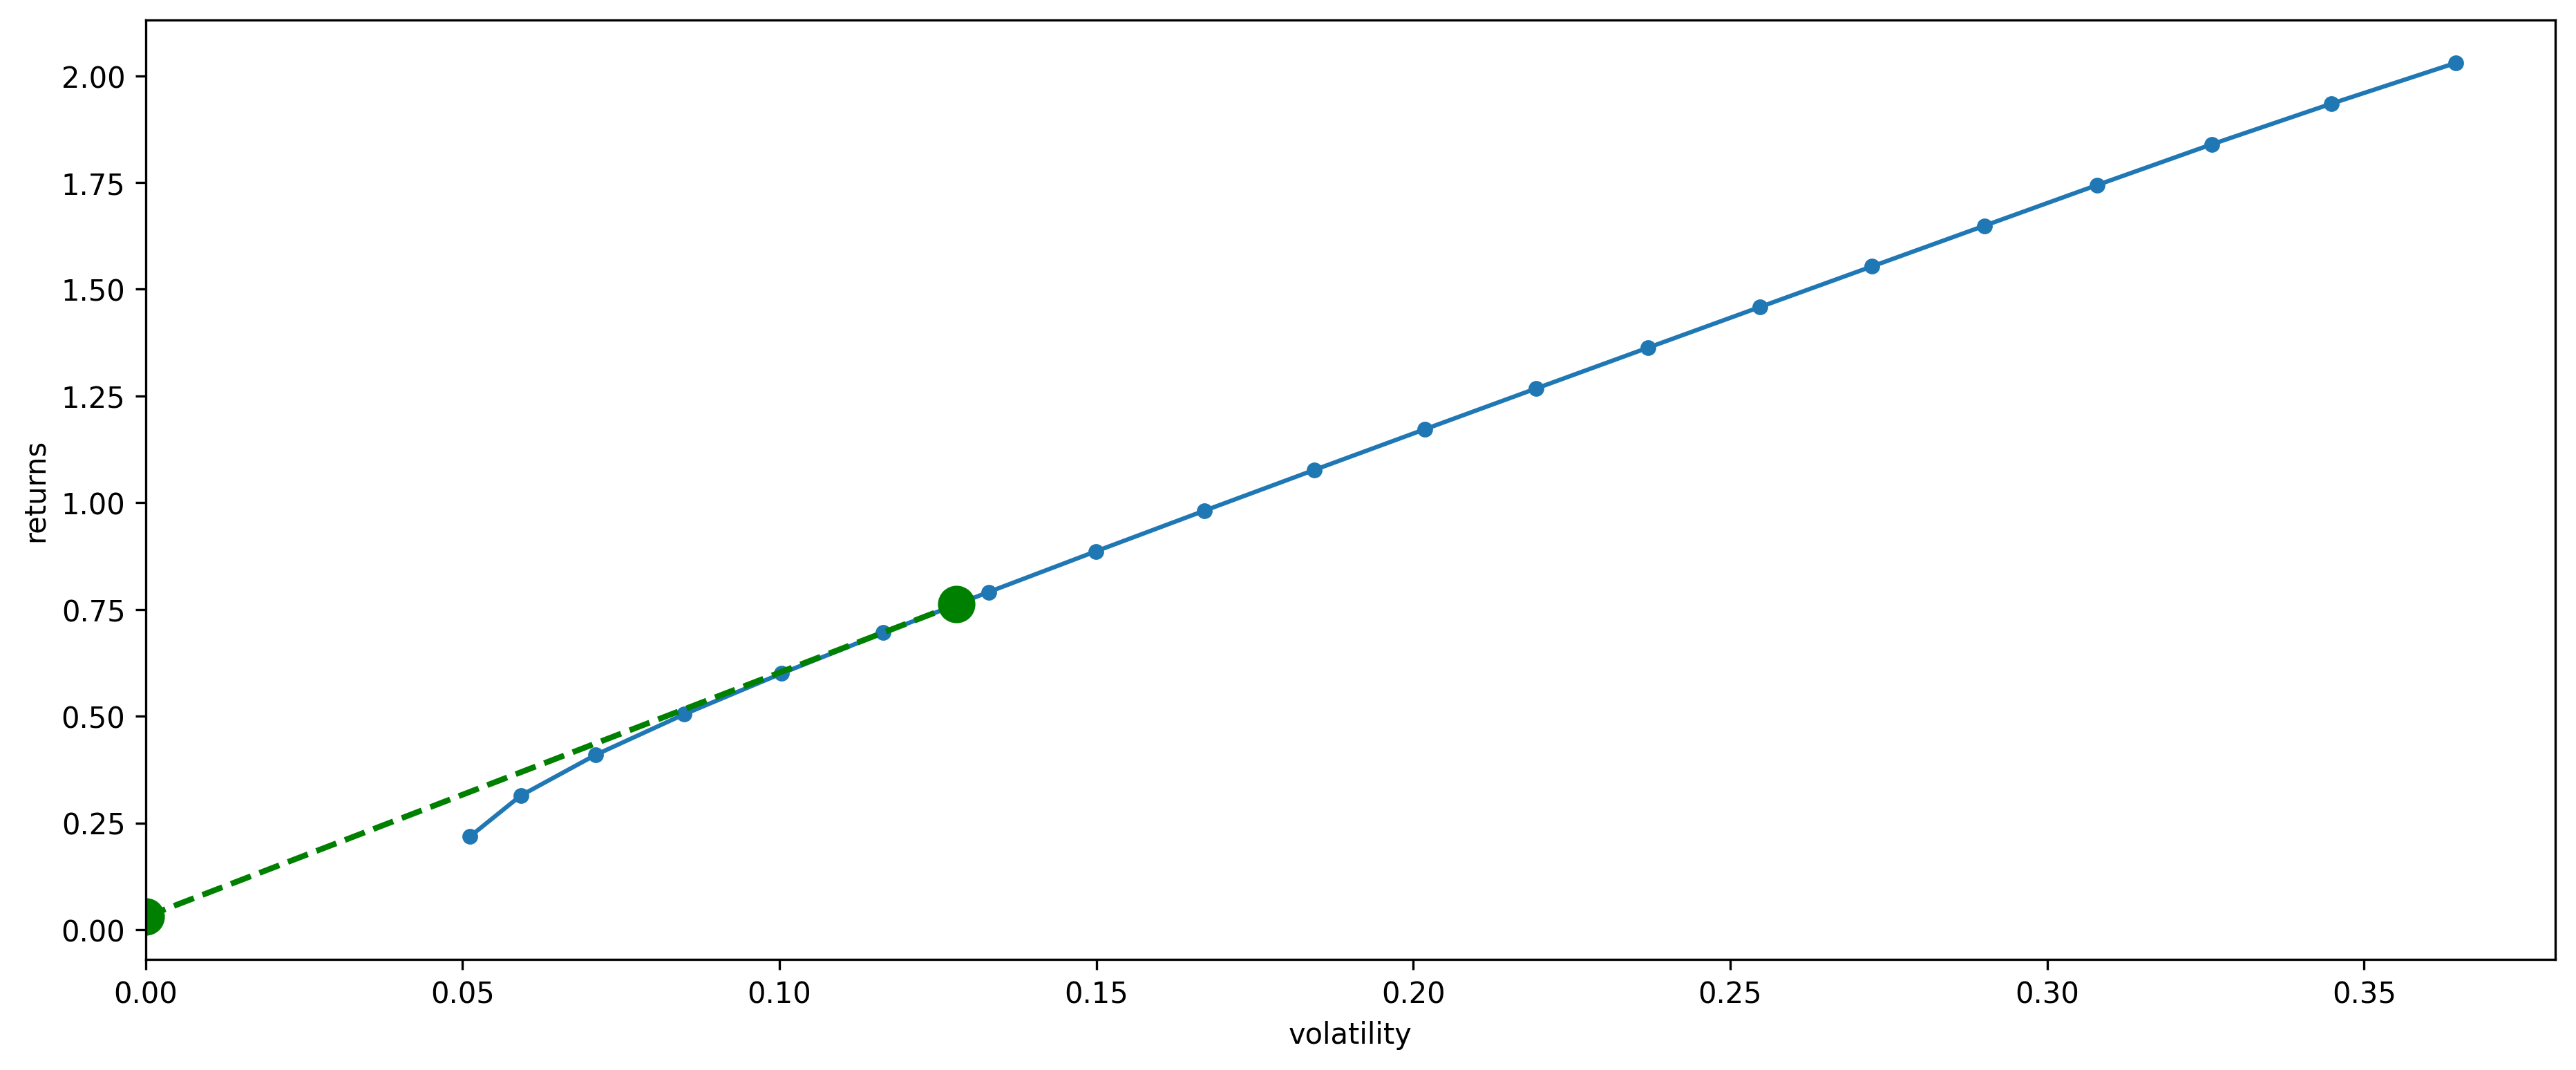
Okay, let me bring up the efficient frontier for our portfolio consisting of IVV (S&P 500 ETF), Bitcoin, and the coin Pick of the Months.
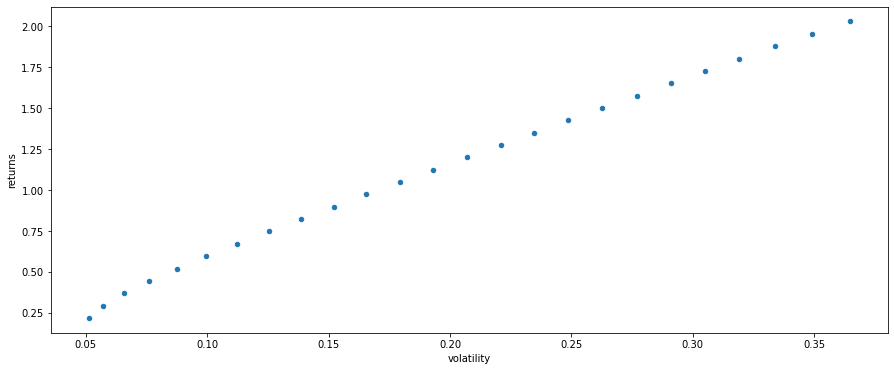
Given this chart, we should be able to find exactly one point on it that represents the most optimal portfolio weights between these three asset categories.
Without dumping too much financial slang on you, we can have different allocations between assets with the risk-free rate and risky assets. If you plot it on a chart, you’d have a straight line starting at the risk-free rate.
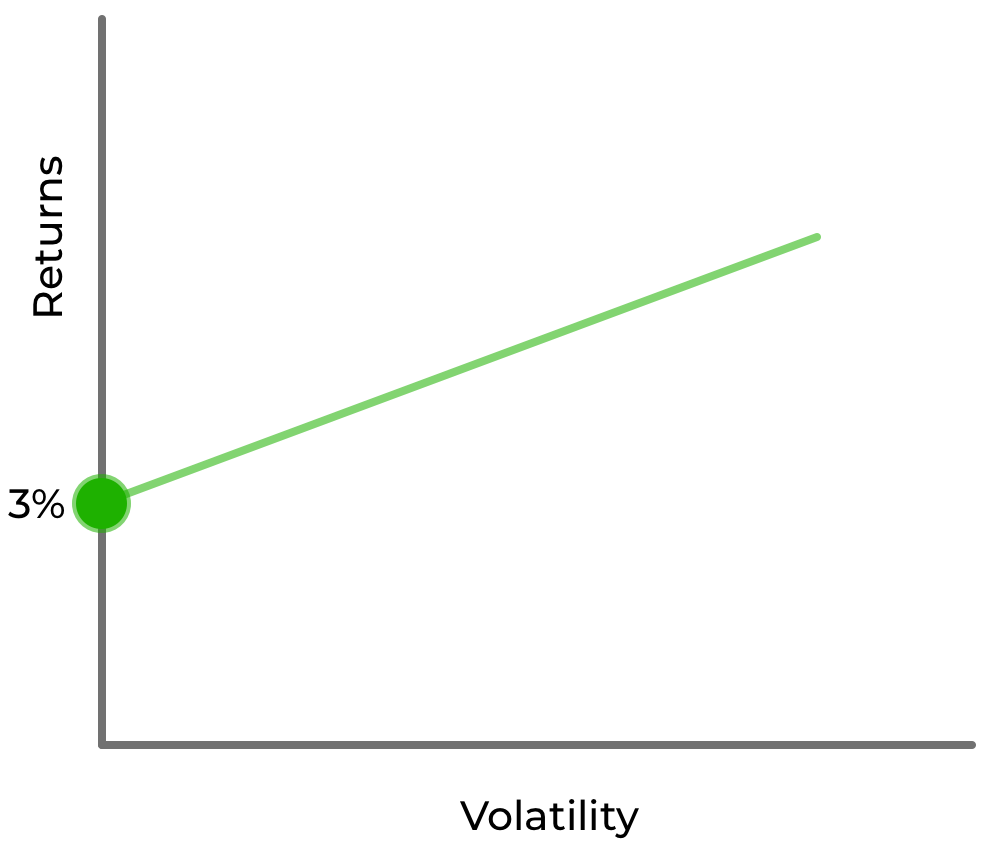
When you start adding risky assets, the volatility increases. Ideally, you’d want the line to have a strong upward slope to maximize return per unit of volatility. But, you can only go so high because your line has to cross the efficient frontier at least at one point.
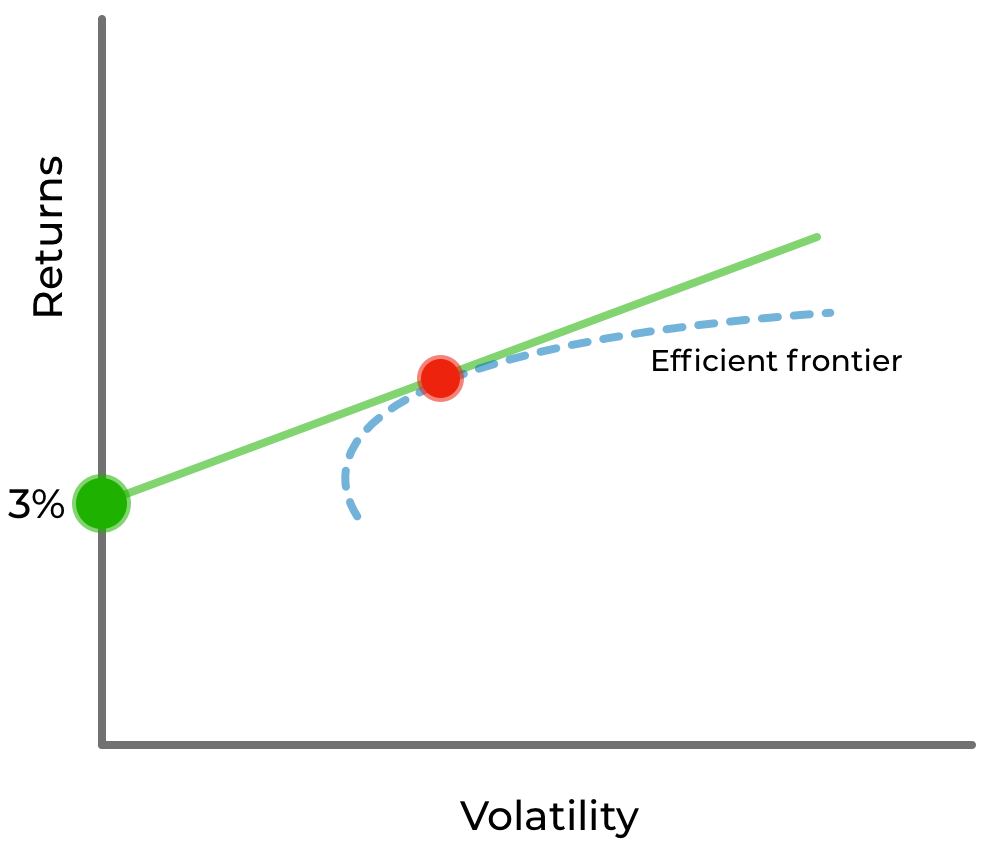
This is a portfolio we’re going to look for. By knowing the risk-free rate we can find the exact point on the efficient frontier that will reveal to us the optimal weights for each of the assets in the portfolio. Whether it’s through magic or lots of math and financial theory, it actually works.
- IVV – 65.45%
- BTC – 7.2%
- PoM – 27.2%
To conclude, let me remind you that since we’re using historical data, it only can give us so much information. As we know, historical returns don’t by any means guarantee future returns.
Still, the efficient frontier coupled with the risk-free rate can give you a well-informed idea of how to construct the near-perfect portfolio for your situation. Next time, we’ll talk about the limitations to this portfolio construction technique.
That’s all for construction. Now let’s look at the SIMETRI portfolio…

