BTC Breaks $30,000

Bitcoin came under heavy downside pressure last week, as traders booked profits and U.S. Treasury Secretary Janet Yelln struck a surprisingly dovish tone towards cryptocurrencies.
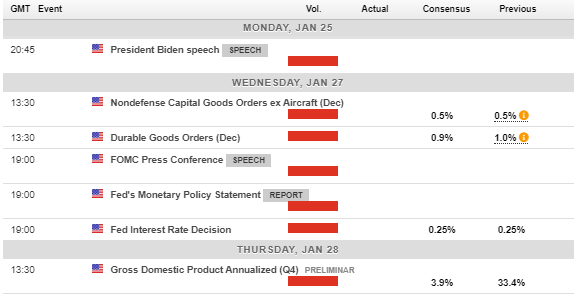
BTC fell under the $30,000 support level for the first-time since January 5th this year after staging a notable breakout below a symmetrical triangle pattern.
The top crypto also turned technically bearish in the short-term for the first-time since October last year after breaking below its 200-period moving average on the four-hour time frame.
BTC eventually rebounded back above the $30,000 level after the U.S. Treasury Secretary Janey Yellen talked back her previous comments, and noted that Bitcoin and other cryptos have “potential benefits”.
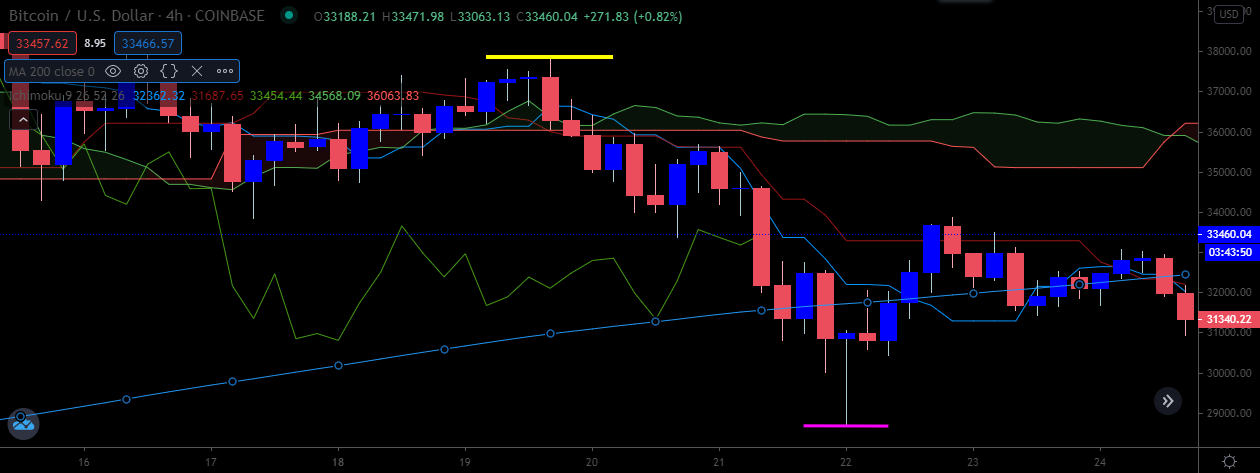
BTC/USD One-hour Chart
Source: Tradingview
According to on-chain and market intelligence platform, Glassnode, whales continued to accumulate BTC on the price decline as smaller BTC addresses started to book profits.
On-chain data from crypto behavioral platform Santiment showed that traders sentiment towards Bitcoin on Telegram hit a two-year high prior to last week’s price plunge.
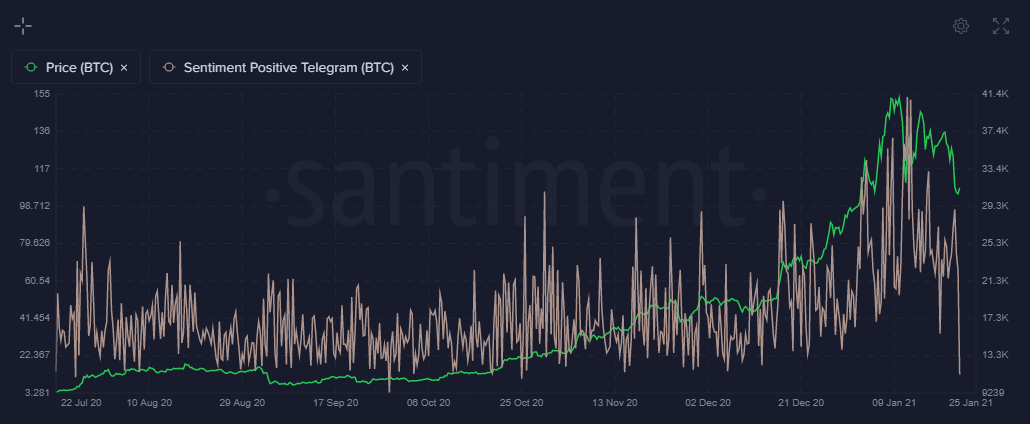
BTC Positive Social Sentiment on Telegram
Source: Santiment
Data also showed that BTC whales were not spooked by the near $10,000 price pullback in BTC from the trading highs of the week. Santiment’s popular Token Age Consumed metric remained muted and only spiked around the lows of last week.
Data last week showed that Grayscale Investments sunk another $307 million behind the flagship cryptocurrency as the asset manager took advantage of the dip, and added over 8,000 BTC to its fund.
According to Data from Skew Bitcoin’s perpetual swaps funding on major derivatives exchanges, a proxy for the cost of maintaining a long position in the derivatives market, also dropped sharply last week.
The Crypto Fear and Greed Index pulled back sharply last week and moved into a state of “fear”. The index dropped to levels not seen since October of last year.
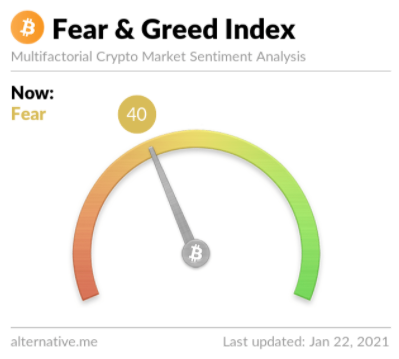
Crypto Fear and Greed Index
Source: Alternative.me
The crypto total market capitalization plunged towards the $800 billion area last week. A notable bullish double-pattern formed after sellers failed to breach the January 11th low.
Bitcoin’s market dominance plunged towards the 63% support level as the pioneer cryptocurrency continued to bleed lower as Ethereum rallied to a fresh all-time high.
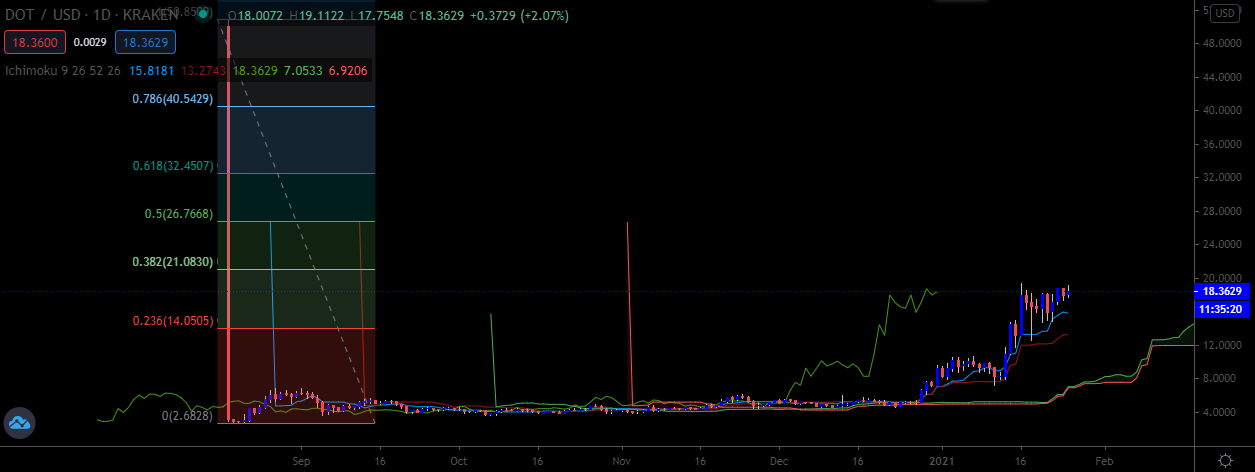
Polkadot advanced towards the $20.00 level last week and remained a beacon of stability in the crypto space as the DOT/USD pair held firm while other altcoins plunged.
During my upcoming webinar I will be discussing how to incorporate the Social Sentiment into your trading, and I will also be charting Bitcoin (BTC), Ethereum (ETH), Litecoin (LTC), and Waves (WAVES)
Source: Tradingview
The Week Ahead
Bitcoin will need to firm above the $35,000 level this week to encourage the notion that the ongoing bull trend is alive and well. If buyers are successful then the BTC/USD pair still remains on-track for $40,00 and possibly $55,000.
Last week I mentioned “ on-chain indicators are also in the process of correcting, such as the SOPR ratio, which is healthy before the expected up move towards $50,000 commences.”
I continue to stand by these comments and the correction was much-needed to reset certain on-chain and technical metrics, following the blockbuster run from $20,000 to $42,000.
Judging by the on-chain metrics I have looked at during the recent decline whales are staying put. This certainly implies that the so-called “smart money” is expecting new highs for BTC.
The dynamic of larger whales accumulating smaller wallets is certainly a fascinating one, and is something to pay attention as BTC supply issues start to worsen.
Aside from obvious factors at play, traders will also be awaiting the outcome of $3.5 billion options expirations this week, and indeed whether Grayscale Investments continue to purchase massive amounts of BTC.
The economic calendar is dominated by the central bank decisions from the U.S. Federal Reserve. This will be the FED’s first policy meeting under the Biden administration.
Source: Forexlive
The technicals surrounding Bitcoin (BTC) are fairly clear at the moment, and they should be fairly easy to summarize.
Multiple time frames are dominated by an extremely large ascending broadening wedge pattern. Bears have failed to sink BTC under the mentioned wedge pattern last, despite numerous attempts. This is bullish.
Failure to breach the $31,700 level this week should cement the bull case, and prompt technical tests towards $35,000 and possibly $38,000. If BTC breaks above $35,000 then short-term bears will probably capitulate, and we could see an attempt at the $38,000 level.
Traders should note that a huge inverted head and shoulders pattern will form if BTC reaches the $42,000. The overall upside projection of this pattern would take BTC towards $55,000.
In summary, the bull case is alive and well all the time BTC trades inside the wedge. If we break under the wedge then $20,000 then becomes a real possibility.
Source: Tradingview
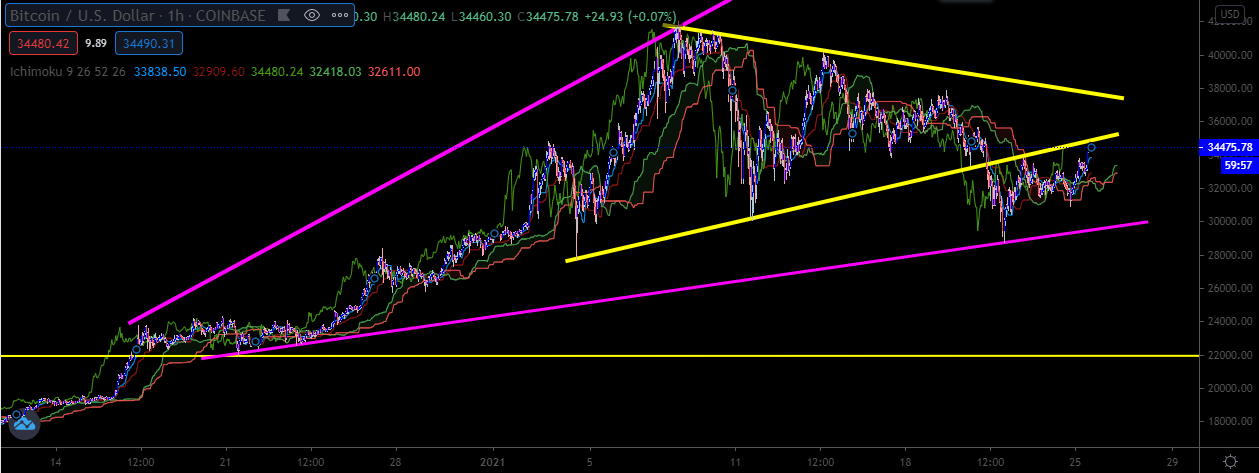
Ethereum (ETH) had a huge week last week and certainly finished the trading week in style after exploding towards the $1,475 level and sucking a good chunk of Bitcoin’s market dominance in the process.
My only concern at the moment is Bitcoin’s market dominance chart, which suggests that it could be about to rise back towards the 80% mark. In theory, this could mean Bitcoin is about to steal the thunder in the crypto market.
Hence my dilemma is what it means for Ethereum. I suspect that daily price closes around $1,440 should give a good guide as to whether Ethereum explodes towards $2,000 or sinks back to $1,240 and possibly even $1,000.
The long-term technicals for ETH/USD are fantastic at the moment, and $2,800 looks achievable over the medium-term. In the meantime, $2,000 is the next big target above $1,475.
Once again, caution is advised just in case one more big downturn takes place before the expected up move. As we saw last week, the market will rarely make it easy to capture a one-way move without pullbacks. Even in this bull market.
ETH/USD Weekly Chart
Source: Tradingview
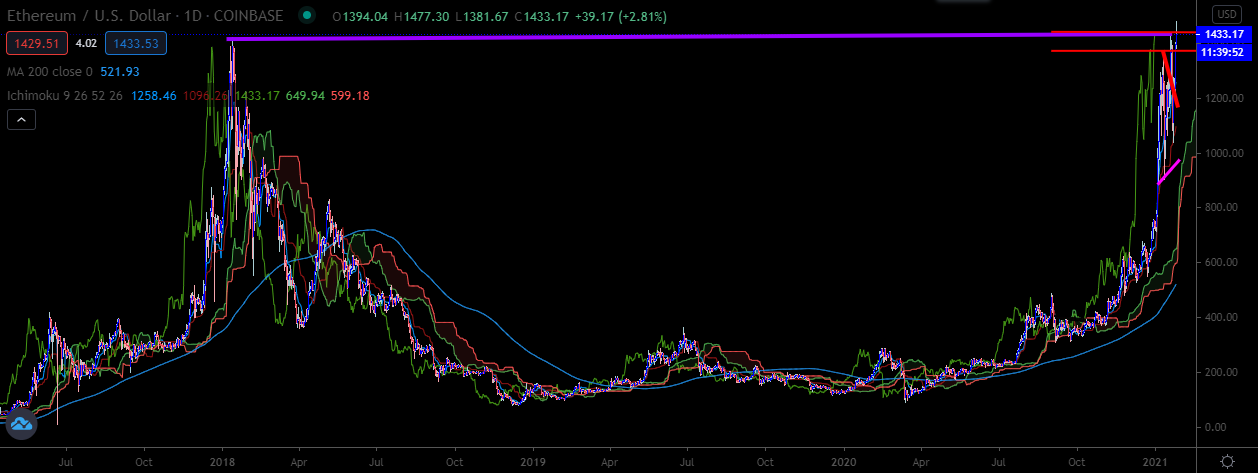
Chainlink (LINK) is certainly a mover at the moment and the technicals look good while the price trades above the $19.80 support. Bears had a few chances to take LINK/USD below key support last week, and ultimately failed.
An extremely large bullish reversal pattern is predicting a potential move towards $38.00 while price holds above the neckline of the mentioned price pattern, at $19.80.
I would not be surprised to LINK/USD pullback one-more time to test $19.80 before lift-off. If this does happen, and this support area holds again, then it may be the last time LINK/USDwill settle around $20.00 before a parabolic move takes hold.
On-chain data surrounding LINK is very good at the moment. Daily active address and whale activity all paint a positive price picture for LINK in the short to medium-term. All things considered, LINK/USD looks like it could take-off at any moment.
LINK/USD Daily Chart
Source: Tradingview
