More Pain Ahead

Last week, BTC moved to its highest trading level in over a month—$18,375. However, the move quickly faded due to the Fed’s reaction to the inflation data.
At the start of the week, bitcoin increased by over $1,000 and hit the $18,000 resistance level after CPI data showed a significant cooling in U.S. inflation.
The market then struck a more cautious tone due to rumors surrounding Binance’s solvency and potential investigations for money laundering.
Attention then turned to the Fed’s half-a-percentage increase in interest rates, which was widely expected. The main point of contention was the Fed members’ forward rate projection, which now points to more hikes in 2023 and, therefore, more pain for risk-on assets.
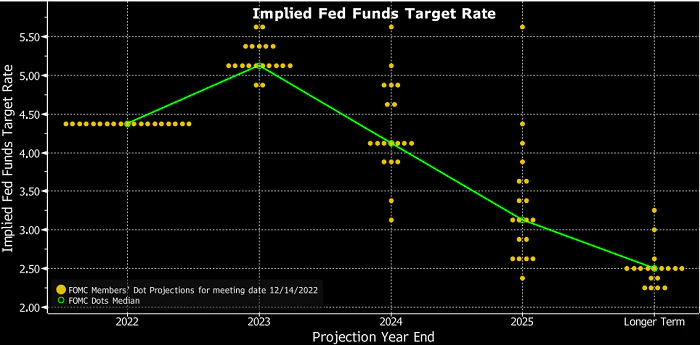
The Federal Reserve’s Dot Plot, which shows interest rate projections (Source: Charles Schwab).
Binance FUD
I expect the market to shift its attention back to the FTX aftermath and, far more importantly, Binance.
According to Nansen, about $3 billion were withdrawn from the exchange last week: the exodus is attributed to the exchange’s “temporary suspension” of withdrawals in USDC, which spooked users. CZ stated that the suspension was due to how long it takes to convert assets to USDC.
Recently, on-chain analytics platform CryptoQuant analyzed the exchange’s proof-of-reserves audit. The report’s outcome is reassuring: BTC liabilities are 97% collateralized, and BNB doesn’t prevail in the exchange’s reserves (the opposite of FTX pre-collapse). However, even if Binance is solvent, it may encounter further issues.
Kevin O’Leary, a famous Canadian businessman, testified in the Senate that Binance purposefully put FTX out of business. Binance has had regulatory issues already, so such statements will enlarge the target on its back. If Binance has substantial issues, crypto prices will plunge.
On-chain Metrics to Keep an Eye On
Today I’ll show you a couple of metrics that help my BTC analysis.
The first one, AgeConsumed, shows the number of tokens changing addresses on a specific date, multiplied by the amount of time since they last moved. When it spikes, it means that BTC holders have started moving their coins en masse.
As you can see in the chart below, the more significant price spikes align well with the big trend reversals in the market. No big spikes have been registered since the inflation news, so we need to remain on high alert for this.
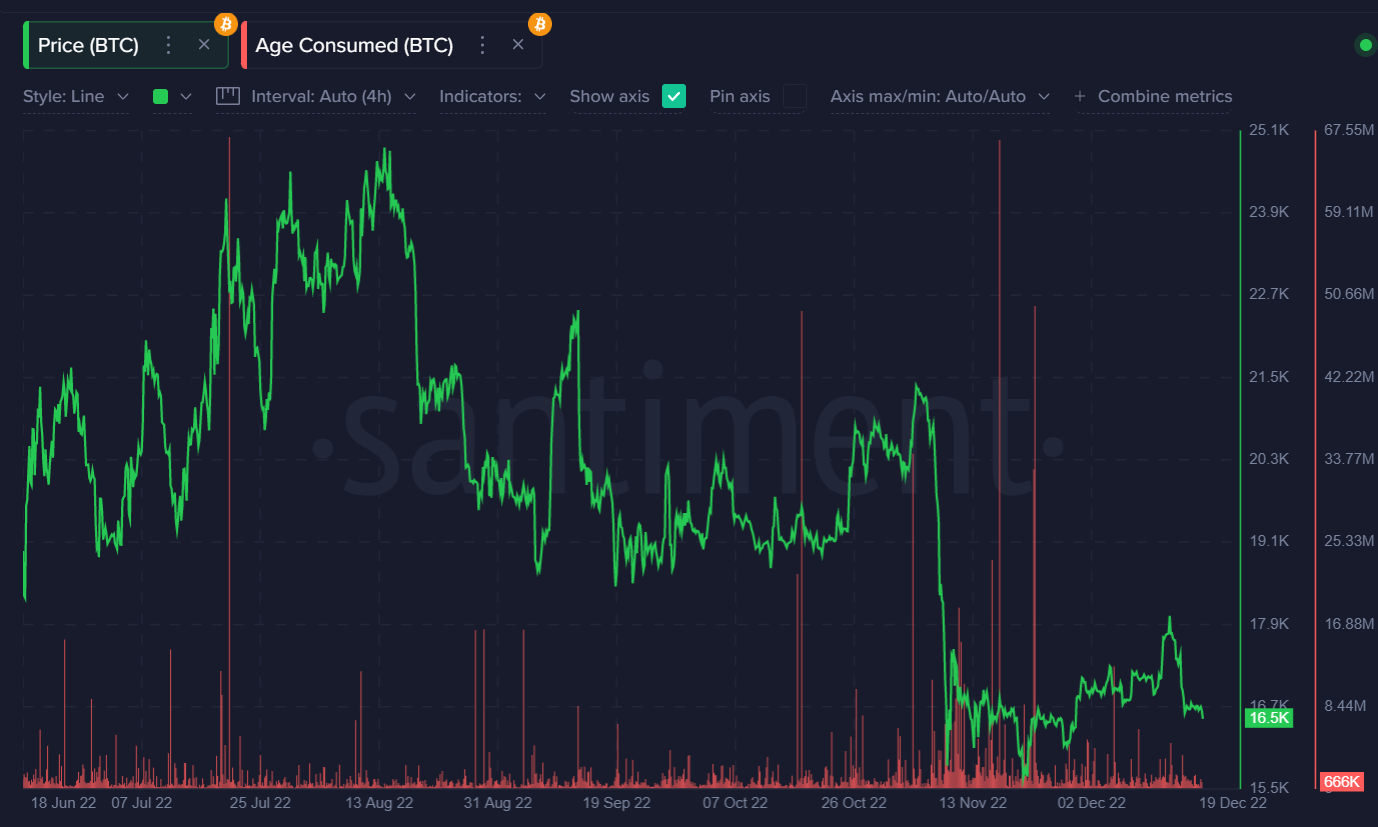
BTC Age Consumed (Source: Santiment).
Another valuable metric to look at is Exchange Flow Balance. When it’s positive, coins are entering exchanges, and vice versa.
Last month, the flow was largely negative, reflecting FTX mass withdrawals. But that’s not particularly important. The thing to understand is this: if inflows are high, people are likely depositing their BTC to sell. Conversely, they are long-term buyers if they withdraw en masse without any particular reason.
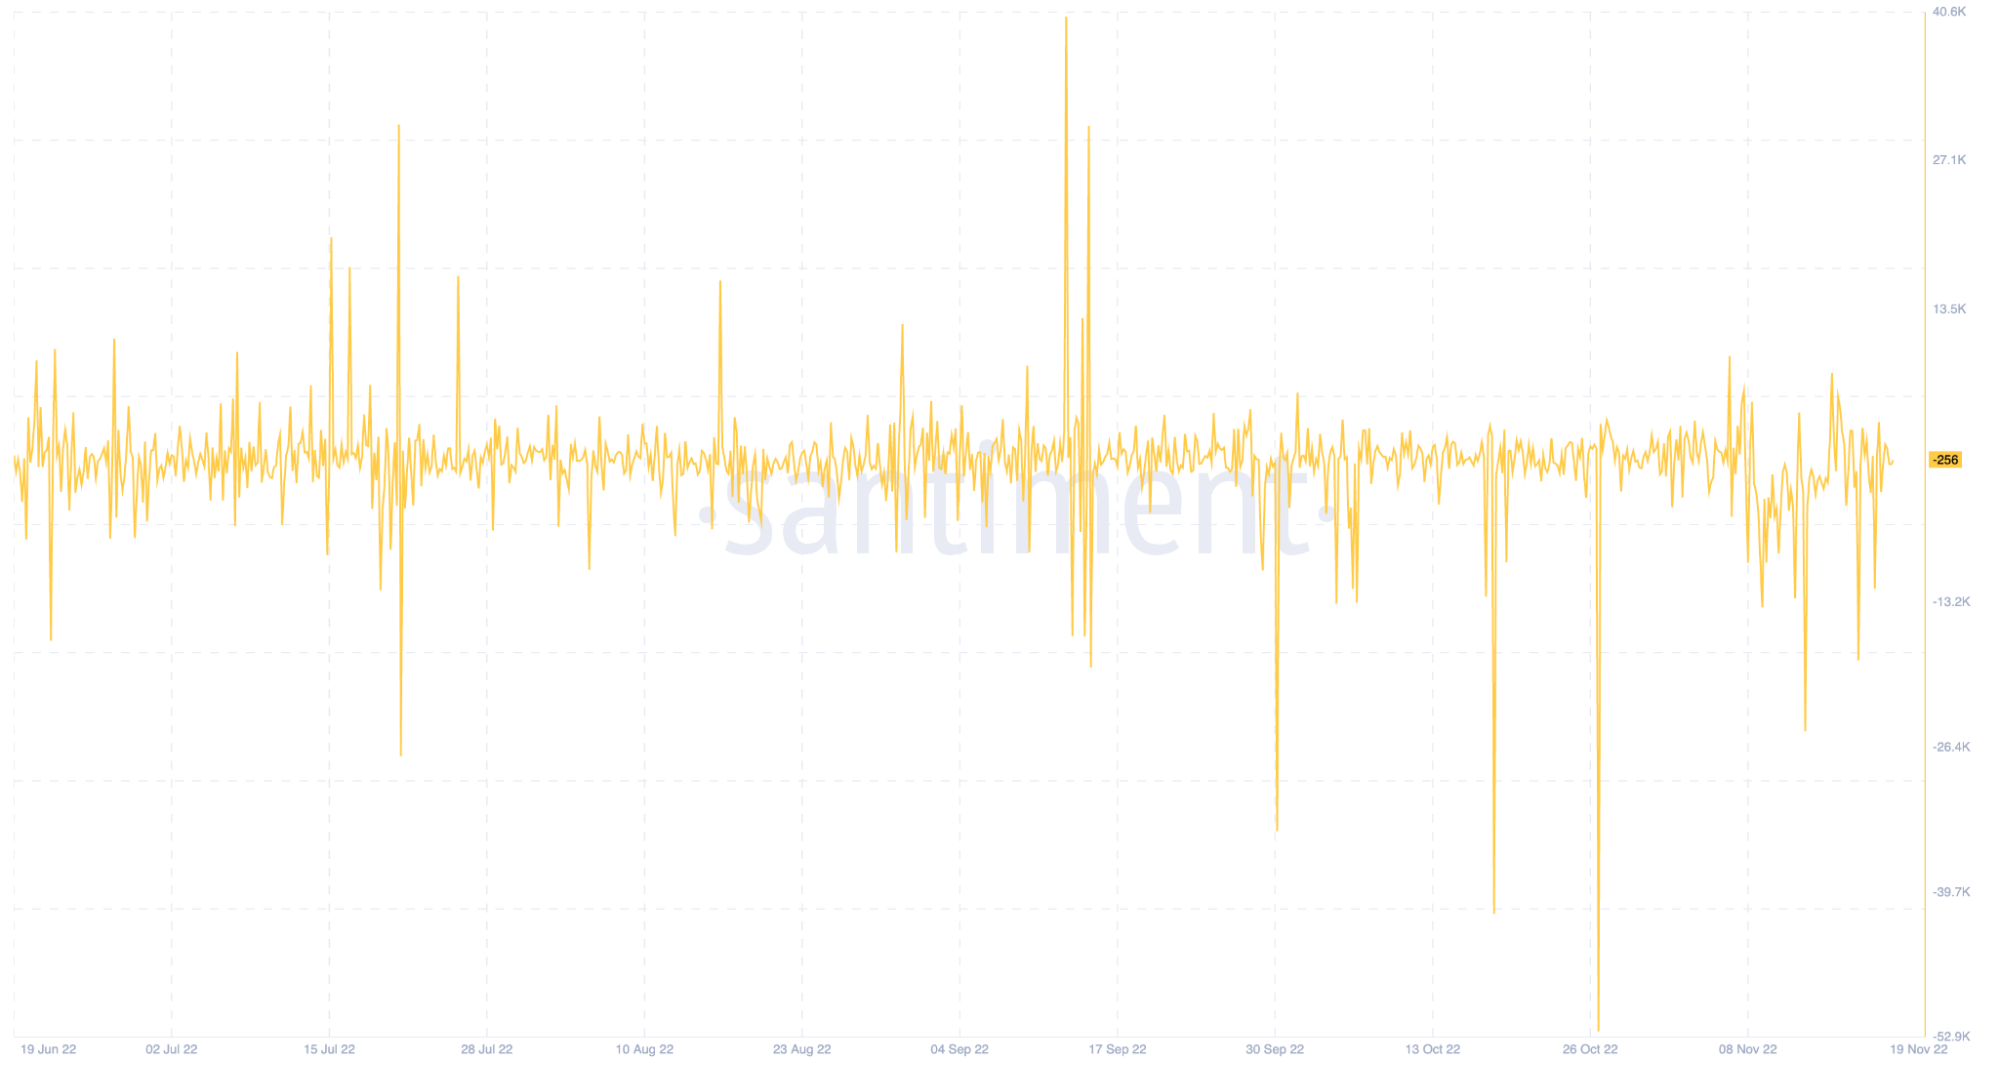
BTC Exchange Flow Balance (Source: Santiment).
From now on, I would suggest keeping an eye on this metric as it could signal the start of the next major price dump and later on—dare I say it—the start of the bull market.
BTC: More Pain Ahead
Last week I mentioned that we were about to see a pending test of the $18,000 level, a failure, and then a reversal. That’s what happened. So what’s next?
To me, Bitcoin is carving a sizable bearish reversal pattern across lower time frames.
I suspect we will see a move toward the $16,000 area and a period of price consolidation until Christmas. More to come next week.
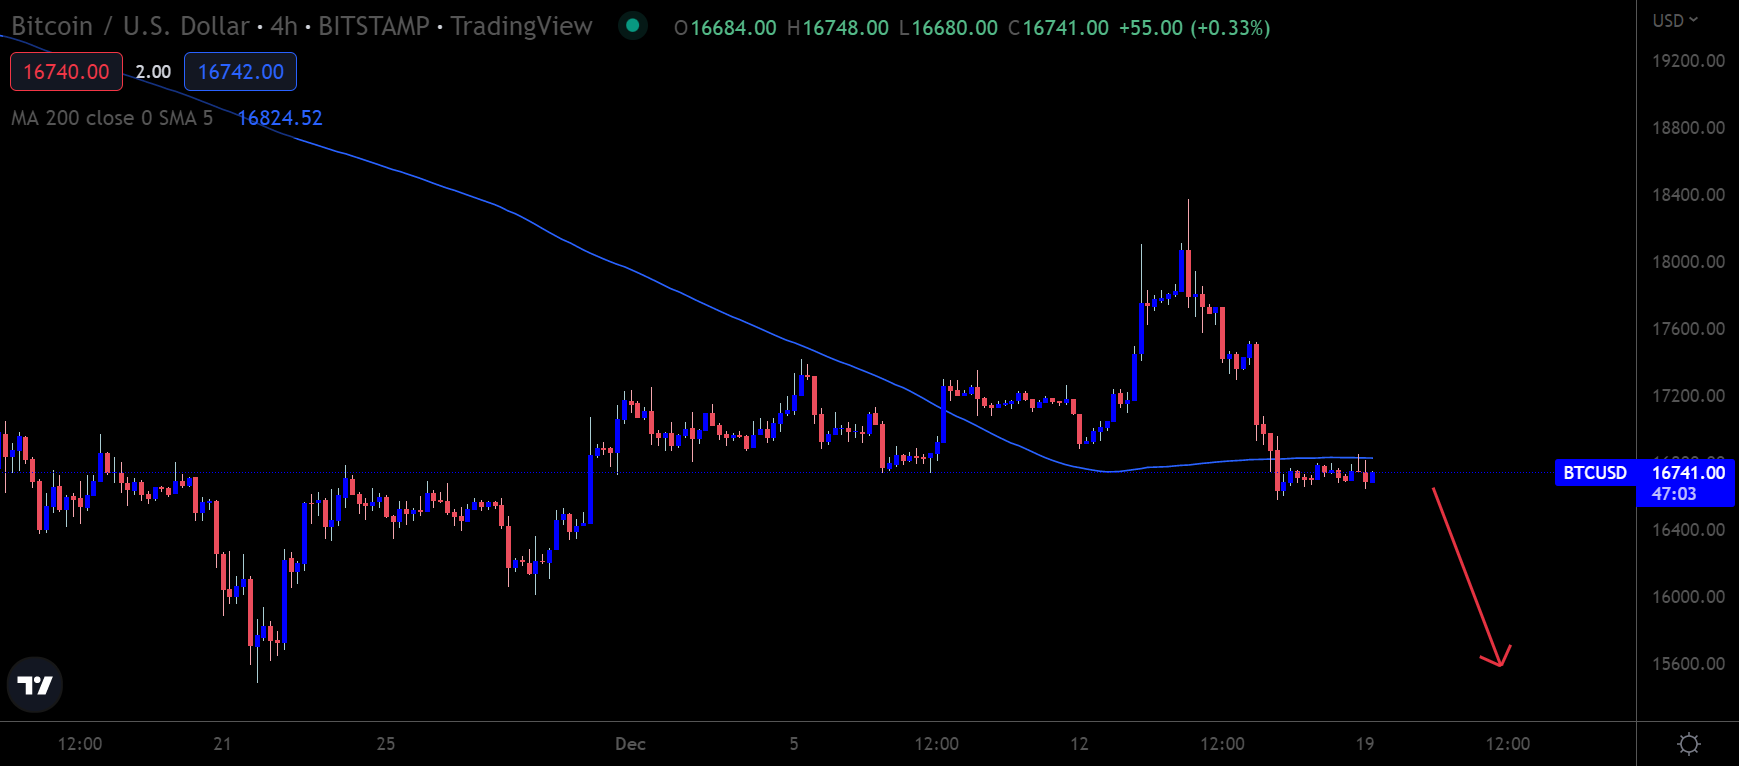
BTC/USD four-hour chart (Source: TradingView).
ETH: More Weakness
Ethereum did what I expected last week, a fragile up move and then a slide toward the $1,100 area.
Our Coins On The Move short-term signal team called and caught the move perfectly for the ETH/USD pair last week, and also had success with shorting Cardano.
Now ETH looks to be setting up a spiral towards the $1,000 level—and then further down. New yearly lows are likely coming. I would not be long this pair in the short-term.
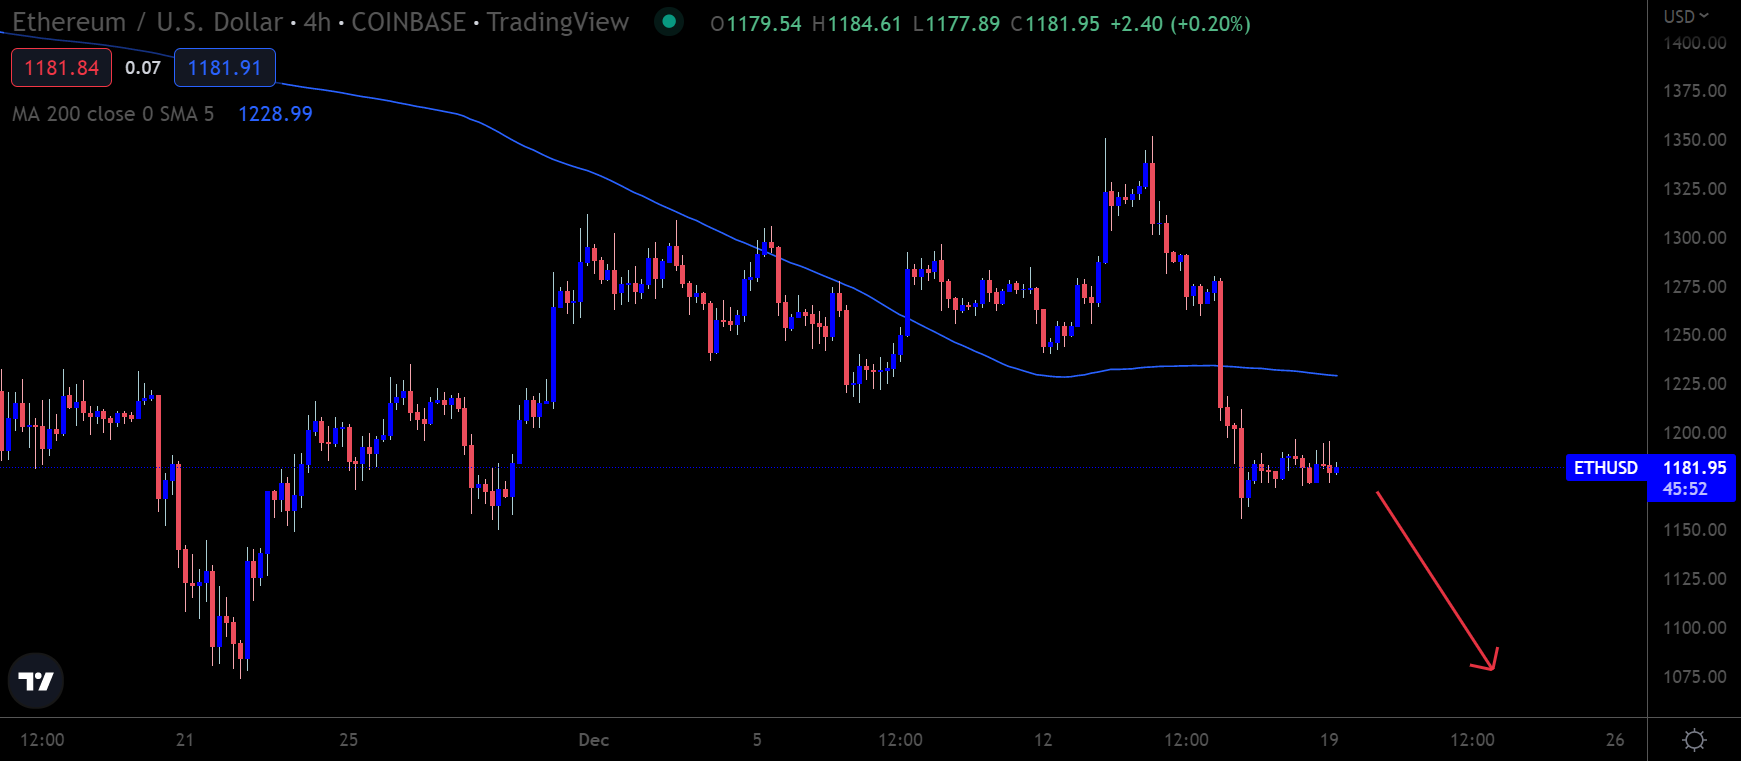
ETH/USD four-hour chart (Source: TradingView).
LINK: Staging a Jump
LINK looks to be headed lower in the short term and is currently carving out a head and shoulders pattern. I would not long it yet. However, according to my weekly chart, it could rise very sharply in early 2023.
Here are some thoughts on LINK from the SIMETRI team.
“Chainlink is one of the most useful projects in the crypto space. It meaningfully provides critical services to a plethora of decentralized apps, helping them easily retrieve data about the real world or other chains. In addition, it now has a staking feature and sources of so-called “real yield,” making LINK a productive asset. However, there are still issues with supply pressure and price manipulation.”
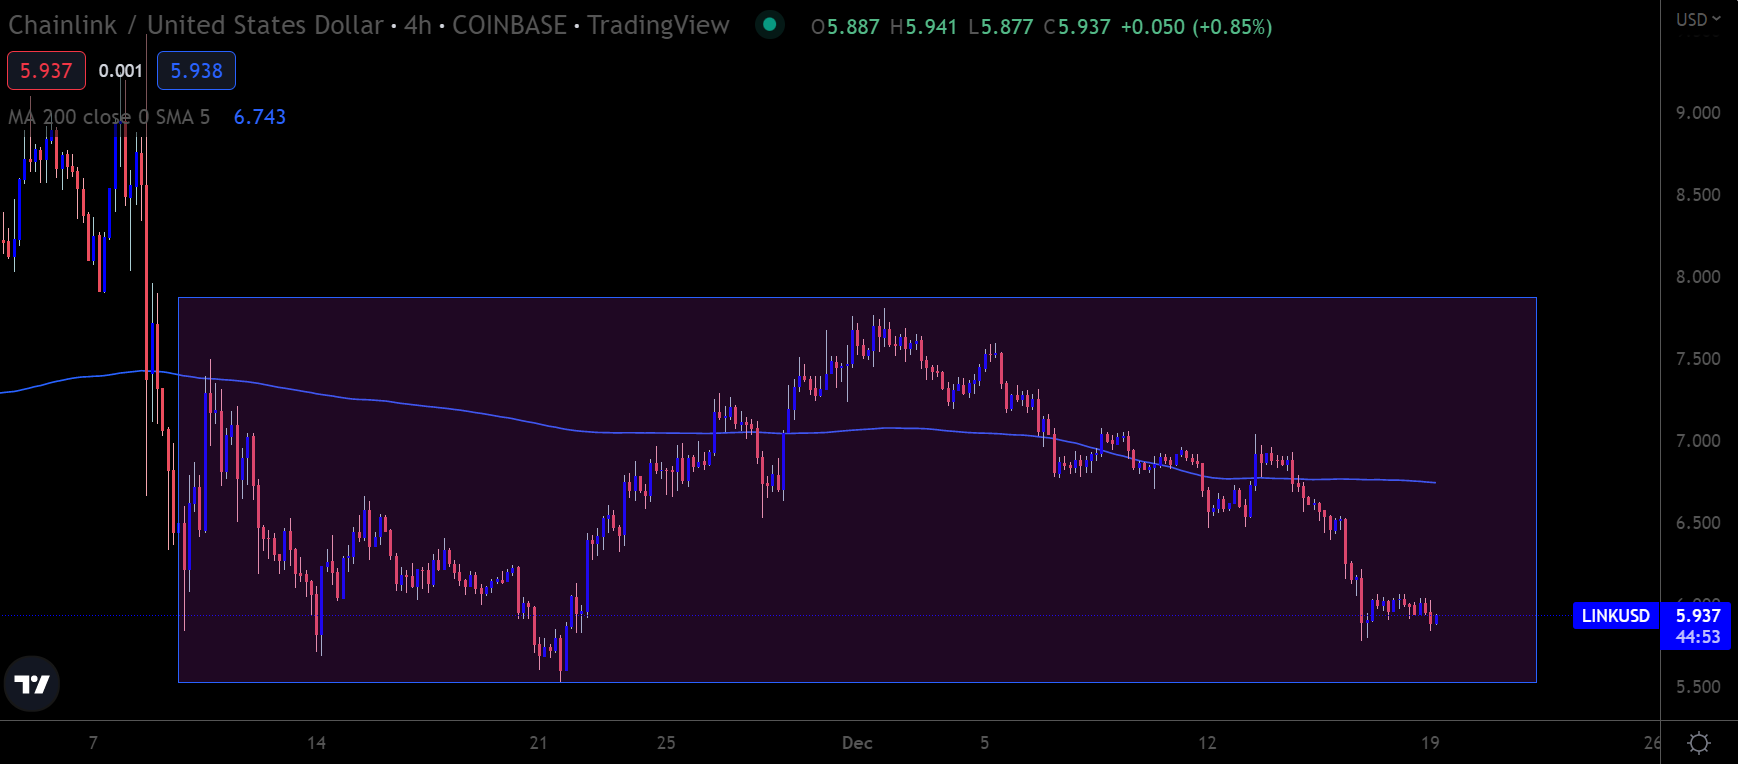
LINK/USD four-hour chart (Source: TradingView).
More Pain
Looking ahead to the next few weeks in crypto, I think we will see a rocky end to 2022 and probably more downside in January.
Based on what I see on the charts and on-chain, it is possible that better days will come after the next significant price dip takes us towards the $14,000 to $12,000 area for BTC.
Crypto holders brave enough to sit through the current drawdown pain should be well rewarded towards the end of the first quarter of next year.
