Bitcoin decoupling

Last week, Bitcoin showed early signs of strength as it stood its ground, while the U.S. stock market, which Bitcoin closely follows, dropped to new yearly lows. While the relative strength was encouraging, I humbly reject the idea of complete decoupling, at least so early in the trade.
Buyers staged an early-week price rally toward the $20,400 resistance zone. However, the rally quickly unfolded following hawkish speeches from the U.S. Federal Reserve members and an escalation of tension between Russia and the West.
Fed voting member Neel Kashkari of Minnesota said the interest rates might not be high enough. Another member, Susan Collins of Boston, warned that unemployment would rise as the Fed continued its hawkish stance.
Moreover, Russian President Putin threatened to use nuclear strikes on Ukraine after officially annexing four territories. Nuclear war threatens a drawdown similar to the March 2020 COVID-19 crash.
Toward the end of the trading week, the Nasdaq 100 and S&P 500 tumbled to fresh yearly lows due to weak guidance from U.S. companies. It was encouraging to see digital assets resisting sell pressure with little volatility.
The U.S. dollar index against other global currencies surged to a fresh multi-decade high in the week’s first half, following a sharp decline as European banks adopted counter-measures to stop the decline in their currencies.
The Bank of England announced an emergency bond purchase program to address a liquidity crunch in the market, pulling up the price of the beaten British pound. The move triggered hopes that other global central banks could also abandon their aggressive monetary policies.
This week has started with fears around the potential collapse of one of the largest banks, Credit Suisse. Traders grew apprehensive of a potential economic crisis that the world witnessed from 2008 through 2009 after Lehman Brothers went under.
There are many reasons for buyers to stay cautious right now. However, sellers are facing challenges, too, as on-chain movements and compilation of negative sentiments hint toward a potential upside move. There’s a real chance of a push toward the $20,000 psychological level early in October. But the time for buyers may run out quickly.
DXY Watch
Regular readers of Pro BTC Trader will know that I have been talking about the U.S. dollar index potentially topping around 115.00 over the last few months. Last week, the DXY topped out at 114.77 and staged a huge reversal.
Since Bitcoin is closely intertwined with the broader financial market, my experience as a former foreign exchange trader certainly helps me with crypto trading. Spotting a top in the DXY can signal when BTC/USD may turn to the upside.
How confident am I that a generational top is in for the DXY? Not particularly; the DXY index can still reach 120.00. However, it has more or less reached the area I expected and staged a bullish correction. This tells me that we could at least expect the odds of more downside towards 110.00 or 108.00 over the coming weeks.
There is a decent probability of more U.S. dollar weakness, especially given that the U.S. midterm elections are around the corner and major currencies are falling to multi-decade or all-time lows. The central bank and political leaders may look to reverse the devastating effects of the dollar’s price increase on investment assets and consumer sentiments.
Undoubtedly, the macroeconomic picture remains terrible, and the U.S. dollar index can surge again at some point. A sudden catastrophe, like the potential collapse of a bank like Credit Suisse or a Russian nuclear attack, would likely act as a strong catalyst for reinstating the dollar as the number one safe haven asset.
But for the time being, I think there is a much higher chance of a near-term correction lower in the buck, which should correspond to strength in BTC.
Unemployment Watch
Last week, I laid out the case that unemployment in the U.S. is becoming one of the top indicators to understand the Fed’s likely moves ahead.
The rationale is simple. While the U.S. unemployment rate remains low, the Fed will have more scope to hike rates aggressively. With this in mind, we’ll see the release of unemployment data from the U.S. economy this week. It will arguably be one of the most important data points in October. It can also act as a market mover for seemingly dull cryptocurrencies.
The expectation from Friday’s report is that the unemployment rate is around 3.7%. It’s still below the Fed’s target of 4.1%, suggesting that the Fed is more likely than not to increase rates by 50 to 75 basis points in the upcoming meetings. A higher-than-expected reading can likely increase the hopes of an early Fed pivot, potentially causing a rally in risk assets.
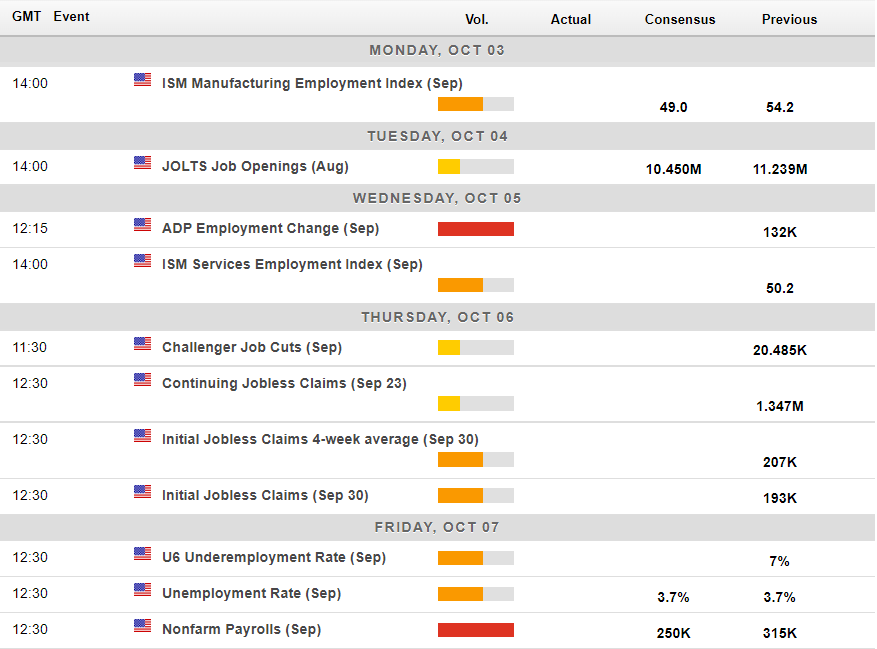
Economic calendar for this week (Source: Forexlive)
Tracking Smart Money
I have noted numerous times that the two most crucial subsets of “smart money” for me are mid-tier whales—holders between 1,000 to 10,000 BTC—and miners. These stakeholders usually have accurate timing in buying low and selling high. Currently, the subsets are sending mixed signals as one cohort is engaged in buying while the other is aggressively selling.
First, let’s look at the holdings of mid-tier whales. Since the start of the second quarter of 2022, mid-tier whales have drastically reduced their BTC holdings. The only time these investors paused selling was from July to August 2022. I suspect that Bitcoin’s relief rally from $19,000 to $25,200 in August was no coincidence.
Since September 27, the mid-tier whales have shown early signs of a buying phase similar to the one in July. That raises the possibility of a short-term price surge.
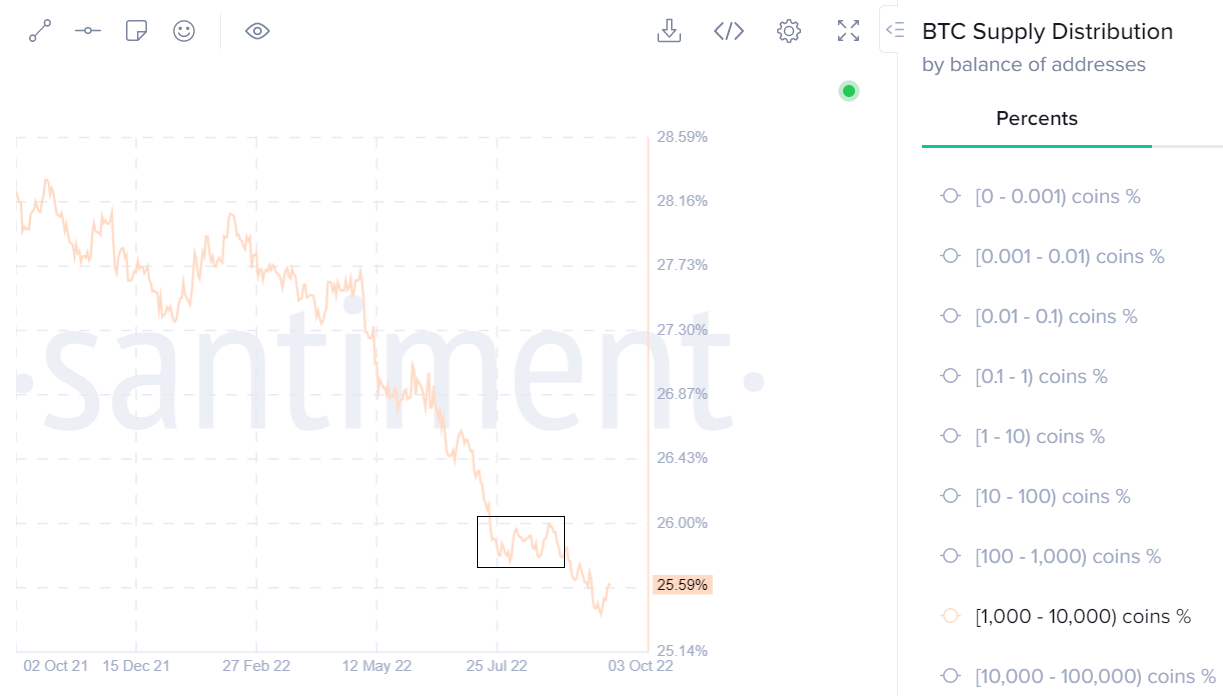
BTC percentage holdings of mid-tier whales (Source: Santiment)
On the other hand, miners sold quite aggressively toward the end of last week, increasing the fear around a depressing fourth quarter.
The selloff may continue as the profitability of miners is questionable. The market value of BTC is over 30% below its average production cost of $26,750. If the situation persists, the supply side may witness another capitulation event, causing a quick price drop.
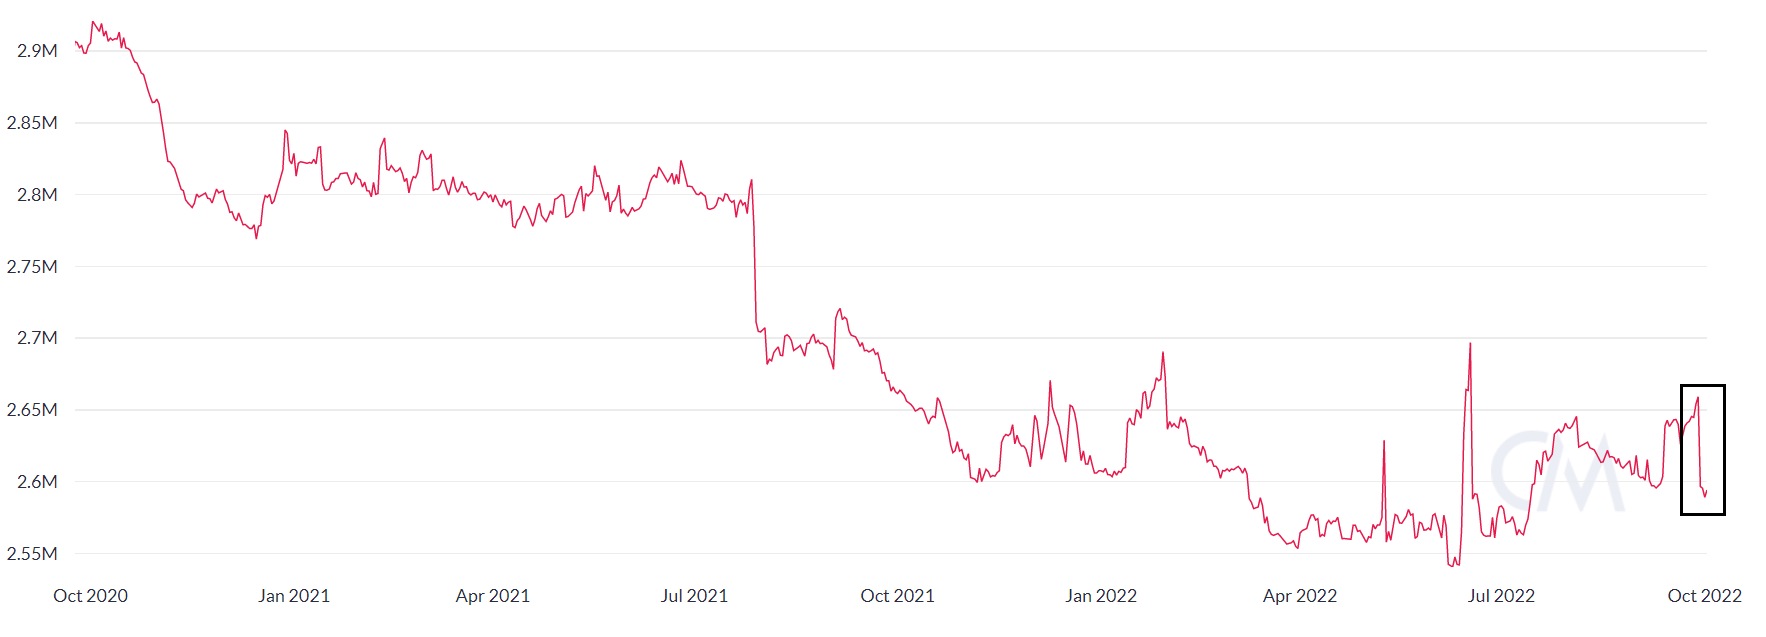
Bitcoin supply held in wallets that withdrew from mining pools (Source: Coinmetrics)
This week, I will closely examine the movement of smart money investors to get a clearer picture. Currently, both seem equally contradicting.
In slight favor of the buyers, the exchange outflows jumped significantly on September 30, 2022. The net exchange flow on that day was around 37,000 BTC (worth $675 million at current prices). It appears that traders were interested in buying the relative strength in BTC despite the macroeconomic backdrop.
In conclusion, the chances of a bounce in Bitcoin are high in the short term. It remains to be seen how the sellers react to the strength in Bitcoin because sellers have disrupted all previous rallies. Moreover, the long-term picture is still bearish as mid-term whale holdings are still at yearly lows.
BTC Watch
Bitcoin had a bearish monthly close in September, marking its weakest monthly price close since November 2020. The period is particularly important because this was when BTC began its parabolic run after a multi-year spell in the doldrums. This time, it points toward a negative breakout.
Seasonally, BTC has closed eight of the past 12 October months in green. However, this positive seasonality may not play out this year, thanks to the declining USD liquidity across global markets.
The technicals are fairly simple this week. If Bitcoin remains below the $20,400 level, BTC will likely retest the $18,000 level. A breakdown from $18,000 threatens new yearly lows towards $16,000.
On the contrary, a breakout above the $20,400 level should lead to a subsequent test towards the $21,000 level and quite possibly towards the pivotal $21,700 resistance level.
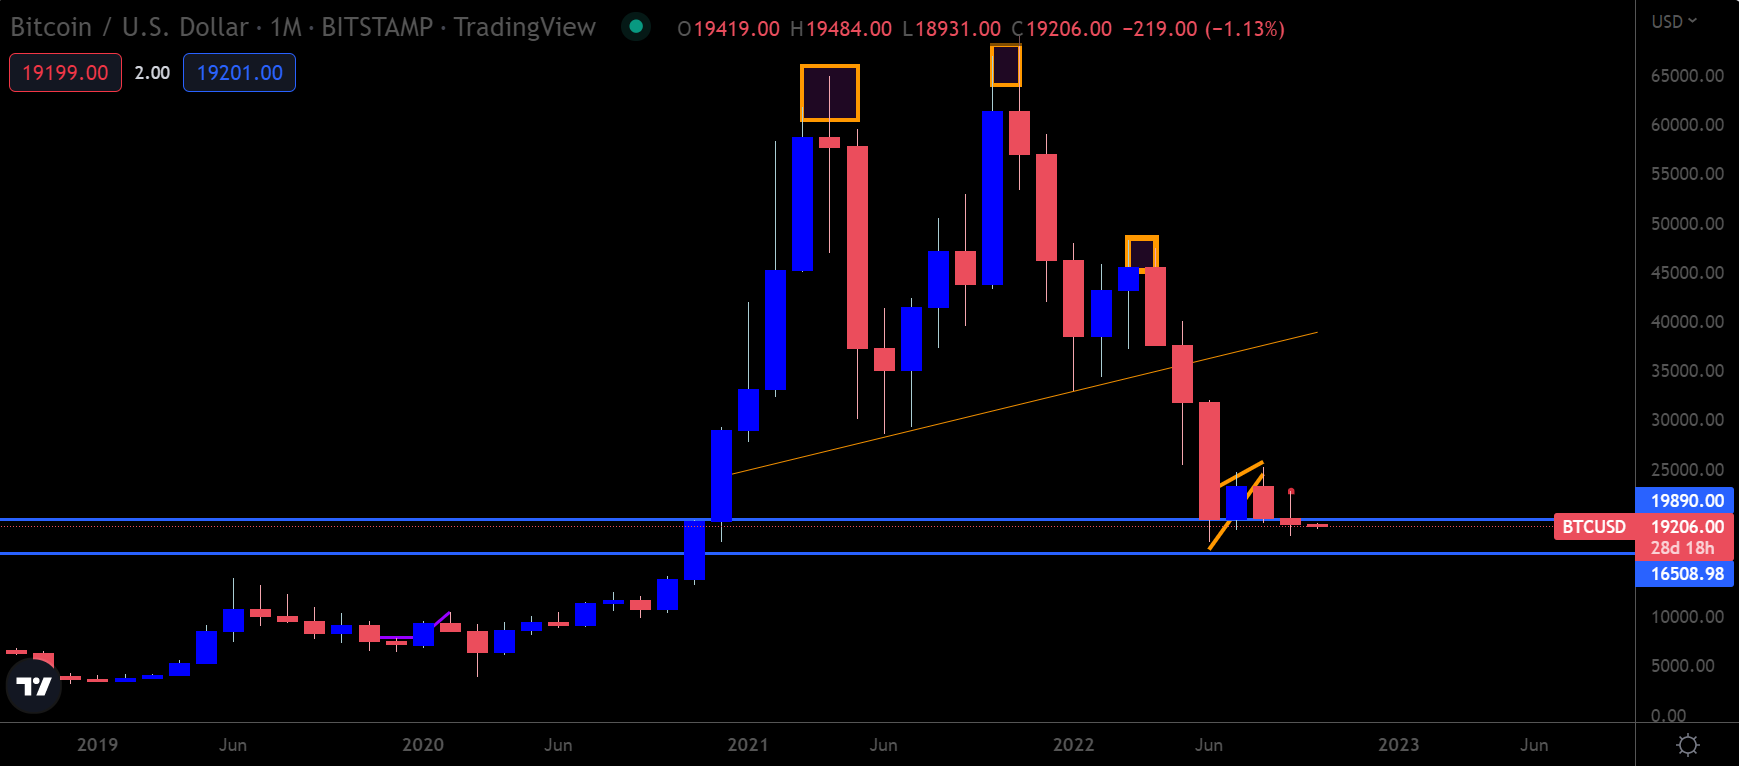
BTC/USD Weekly chart (Source: TradingView)
Ethereum Down
ETH’s price path certainly looks down following the ETH/USD pair’s bearish monthly price close below its former all-time price high from 2017 at around $1,420.
Unless there’s a significant and sustainable rally above the $1,420 level this week, things look dire for the second-largest crypto. The ETH/USD remains vulnerable to descend toward $1,000.
If you caught my last few weekly webinars, you will know that I still think the ETH/USD pair could fall towards $500. However, for this scenario to play out, Bitcoin must fall towards the $12,000 or even $10,000 area.
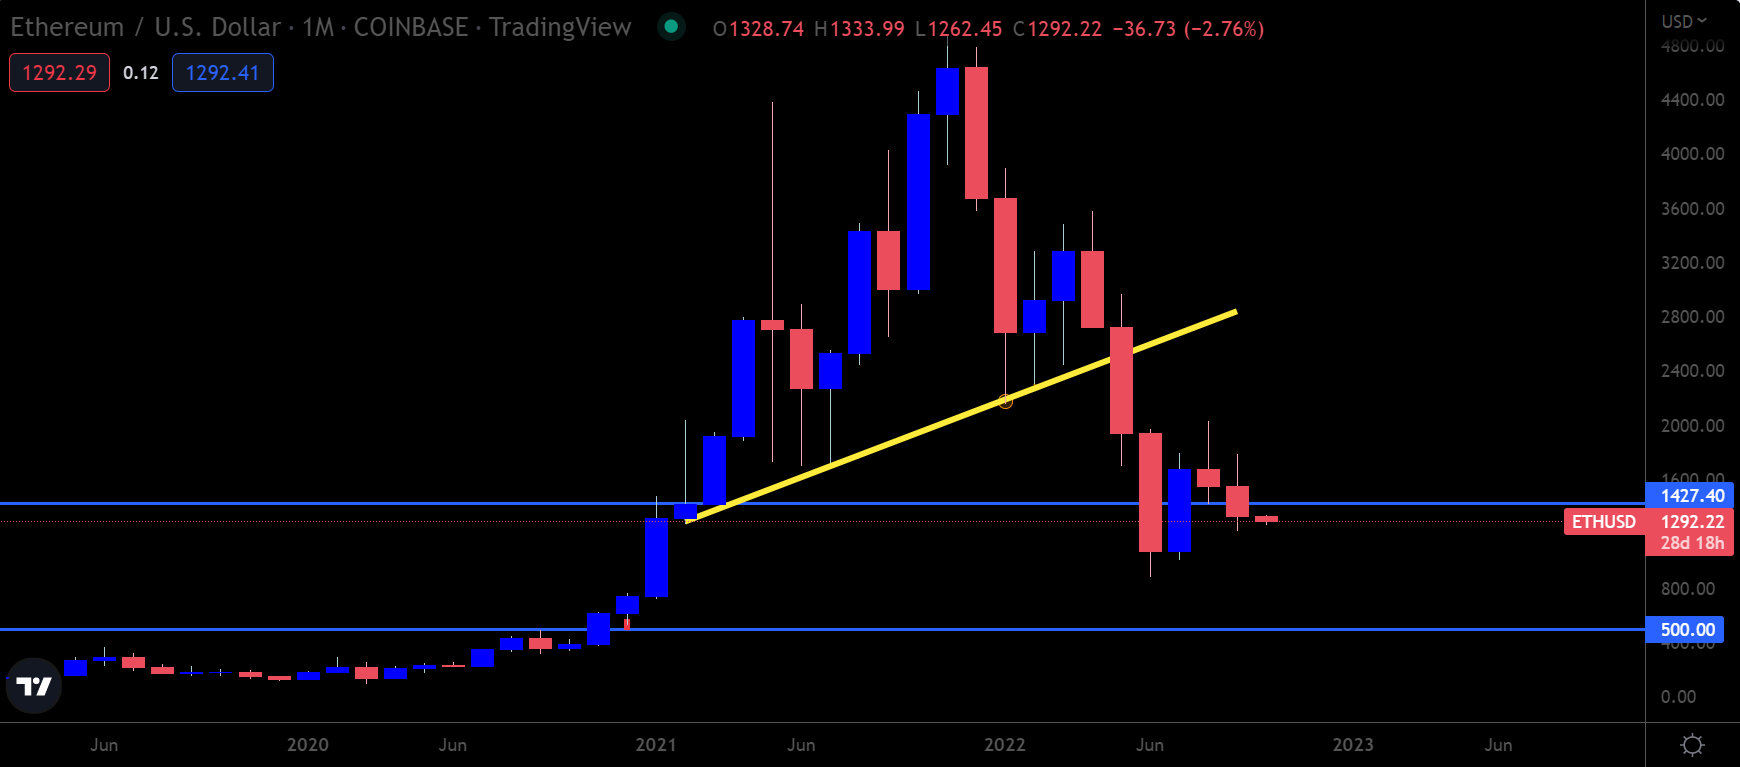
ETH/USD Weekly chart. (Source: Trading View)
DOT Holder’s Pain
Polkadot has seriously underperformed in the crypto market this year. With this in mind, the DOT/USD has begun slipping back into its previous trading range from August to December 2020.
The trading range resides between $3.00 to $7.00, where I more or less expect the DOT/USD pair will spend its time soon. As Polkadot trades below the $7.00 resistance, the risk of a further 50% correction increases significantly over the coming months.
The good news is that if you are not already exposed to DOT/USD, $3.00 or even $4.00 could be a lucrative long-term HODLing opportunity.
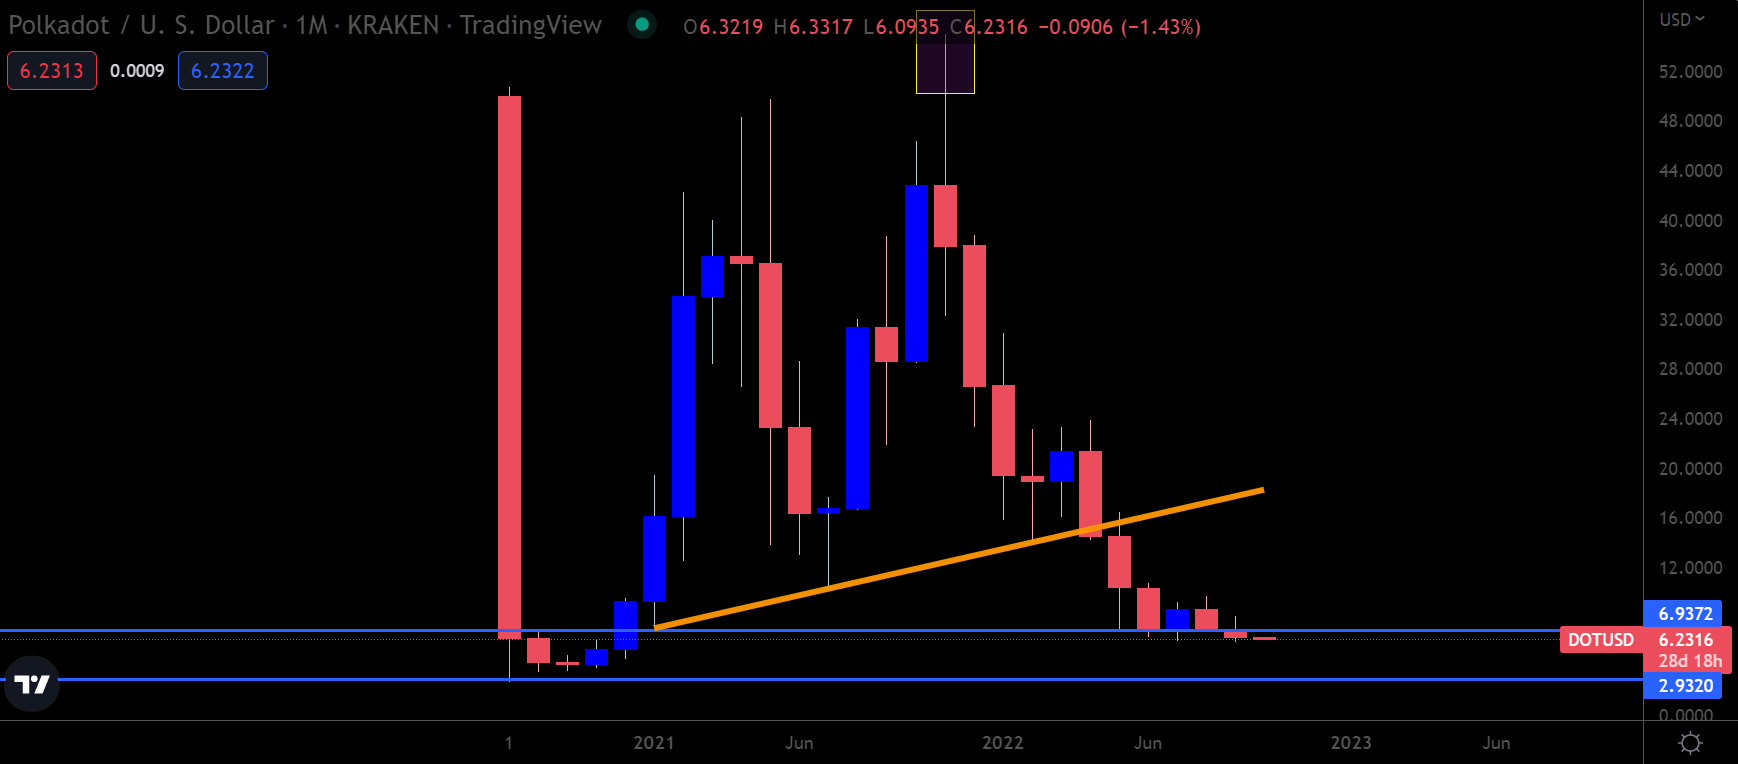
DOT/USD Weekly chart. (Source: Trading View)
Range Boredom
Bitcoin and the crypto market are unusually dull as the technical ranges for trading assets are drying up, and the appetite from institutions and investors has faded.
At one point during the weekend, I thought that the ticker on my price chart was broken as BTC/USD was stuck at one price for longer than I had ever seen.
The notion that Bitcoin is about to decouple from traditional finance and carve out its price path higher while other well-established risk-on asset classes continue to turn lower is very sadly still premature.
For all intents and purposes, nothing has fundamentally changed since last week. Rising inflation, global central banks hiking interest rates, and geopolitical tension still make it a particularly tricky environment for Bitcoin to stage any meaningful price rally.
