Never Say Never Again

Bitcoin suffered more losses last week after the Securities Exchange Commission (SEC) rejected two spot-based exchange-traded fund (ETF) applications, and the fear around Three Arrows Capital contagion reached its peak.
Notably, Grayscale Investments launched a lawsuit against the SEC after the rejection. Crypto experts noted that it could lend some price support to Bitcoin. However, I think the lawsuits could be a slow-burner rather than a game-changer.
The Singapore and British Virgin Island financial authorities ordered the liquidation of 3AC’s assets to pay off creditors. It essentially meant selling off 3AC’s assets, which could trigger a market-wide contagion. The early estimates of the total value of 3AC’s assets range between $3 billion and $10 billion.
Bitcoin’s ongoing price correlation with the Nasdaq index was ever-present last week. The tech-heavy index came under pressure towards the latter part of the week due to fears around the escalation of the crisis in Ukraine and the current macroeconomic environment, weighing upon Bitcoin’s upside prospects.
Despite substantial negative pressure, the sellers failed to stage a breakdown below previous lows of $17,600. While the 200-weekly moving average still stands as critical resistance, some on-chain and technical signs signal the possibility of a relief rally.
Market Psychology
Stock market investors experienced a tense end to the second quarter as they came to terms with the worst half-yearly closing since 1970. The timeline coincides with similar inflation levels 50 years ago and now.
Bitcoin also had its worst monthly close since 2011. Its monthly closing price fell marginally short of the psychological and critical $20,000 level. However, the monthly price close was above the 2017 high of $19,660. This is significant because the 2017 peak was a key breakout zone and point of no return for the December 2020 rally, marking a crucial support level.
My observation does not come from a technical standpoint per se. I will be touching on the technicals later in this article. The point I am making is instead a psychological one. Going into the first week of July, failure to close the monthly candle above the former all-time high could entice some buyers to the table this week.
This, of course, goes counter to the fundamental backdrop for Bitcoin, given that the macro situation is worsening and “contagion” is a hot word in crypto right now. However, that also relates to one of the worse levels of positive sentiment in the market, creating the possibility of a contrarian bounce.
This week’s economic calendar will focus on the release of Federal Open Market Committee meeting minutes from last month on Wednesday and the U.S. job market report on Friday.
Money markets are assigning an approximately 70% chance that rates will be lifted by a larger increment of 75 basis points (bps). However, suppose this Friday’s job number surprises with higher unemployment rates. In that case, it could help expectations tilt back into the 50 bps rate hike, providing relief for risk asset investors.
The following week we also have the U.S. CPI report. This creates a tense position for buyers, especially if the jobs market is stable and the Fed decides to stay hawkish.
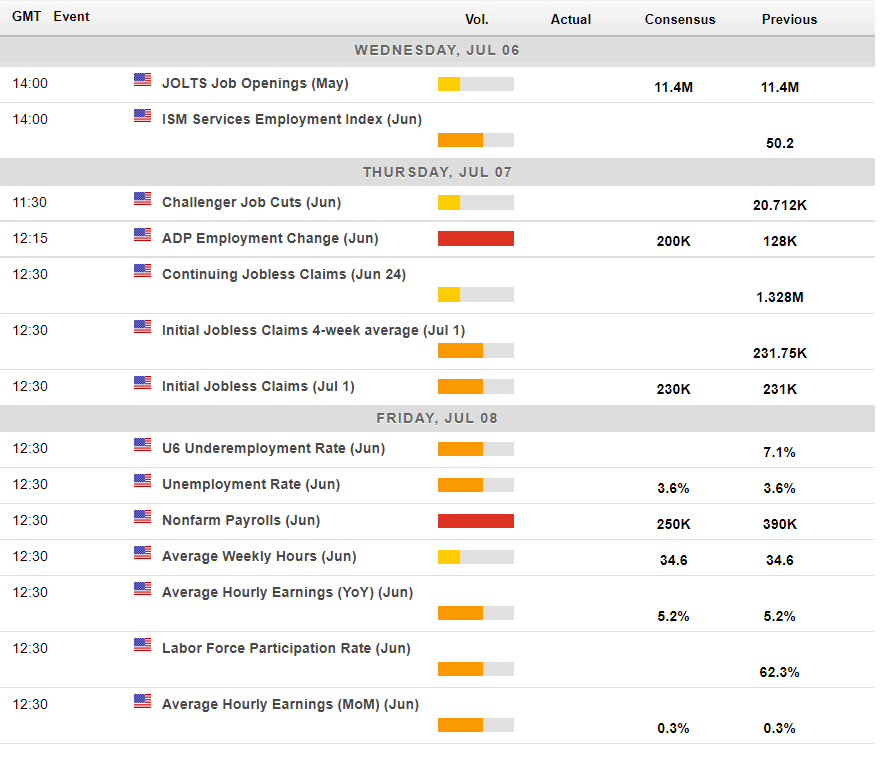
Economic calendar for this week. Source: Forexlive
Whale Watching
The long-term on-chain indicators like Market Value to Realized Value (MVRV) and Net Unrealized Profit/Loss ratio remained near oversold levels. While these present a lucrative buying opportunity, caution should be maintained for investors looking for a v-shaped recovery as these capitulation events can last up to four months.
One of the most notable signs in the short term was whale sightings. The smart-money cohort of wallets holding between 1,000 BTC to 10,000 BTC has increased since the first quarter of 2022. These mid-tier whales hold their lowest balance in over a year. However, they showed some buying interest over the weekend, which is a promising signal.
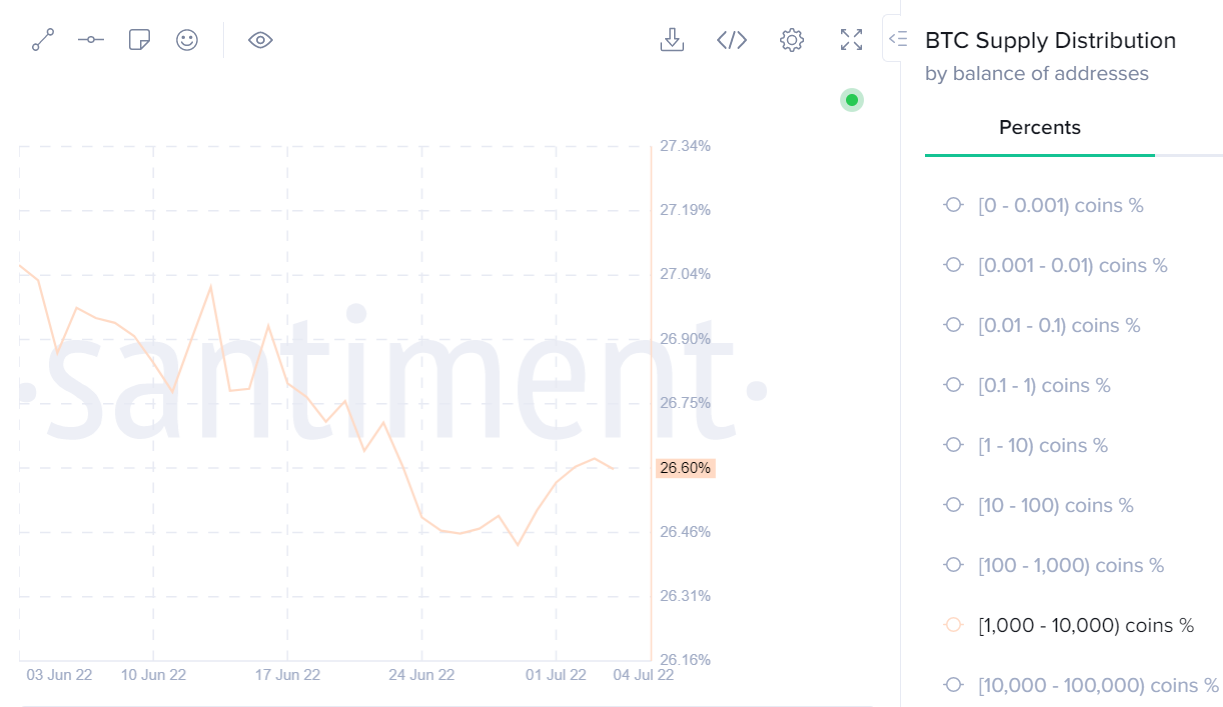
BTC Supply Distribution chart. Source: Santiment
Besides the emergence of mid-tier whales, a slow down in miner sell-off was another positive development. According to Coinmetrics’ record of identified miner wallets, miners stopped selling in the second half of June after a large-scale that began in May, reducing the selling pressure. While Bitcoin’s price remains below the production cost of most miners, it appears that the weakest of the lot has capitulated.
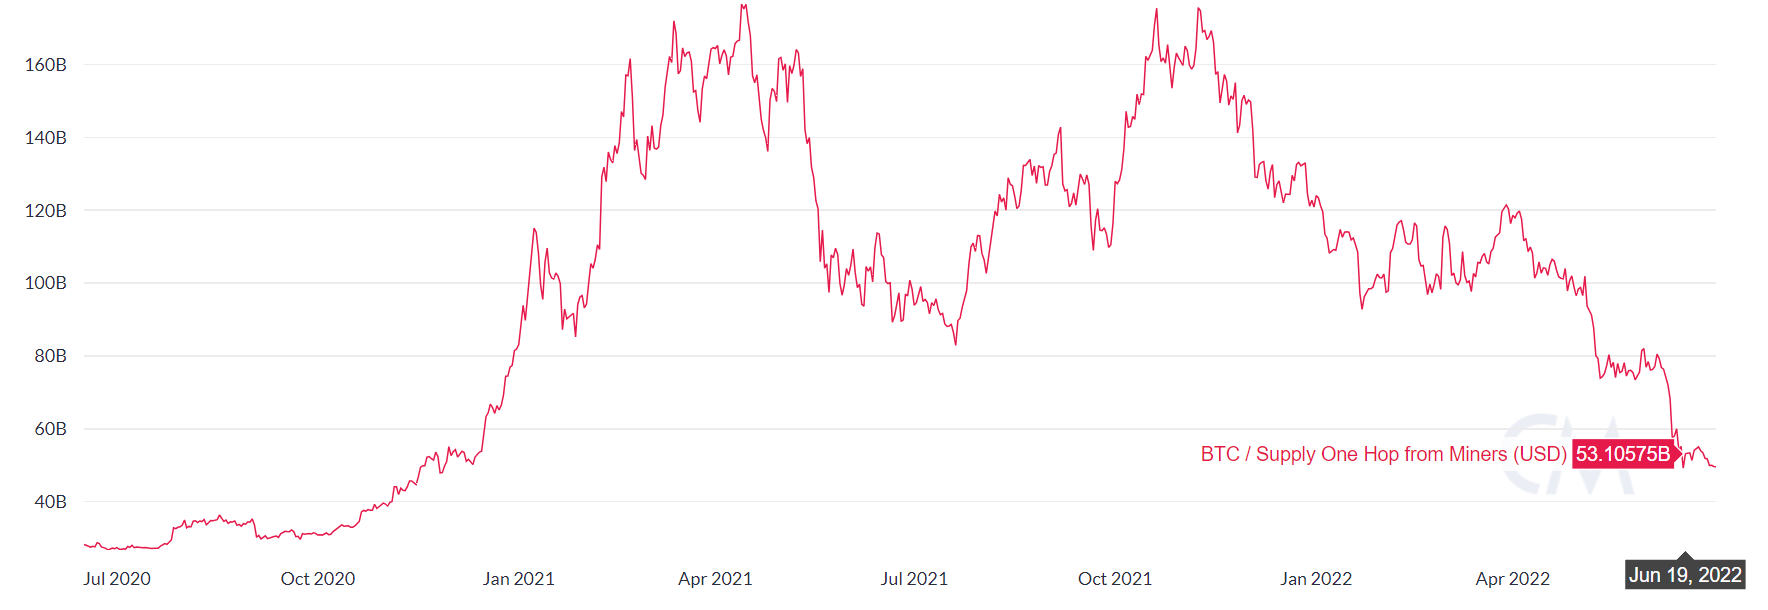
Bitcoin supply held in wallets identified as miners. Source: Coinmetrics
If you look closely at the hash ribbon indicator, which records the 30 and 60-day moving average (MA) of the network’s total hashrate, you’ll notice that the gap between the two MAs closed very recently, signaling network recovery. In the past, these events have marked good entry points.
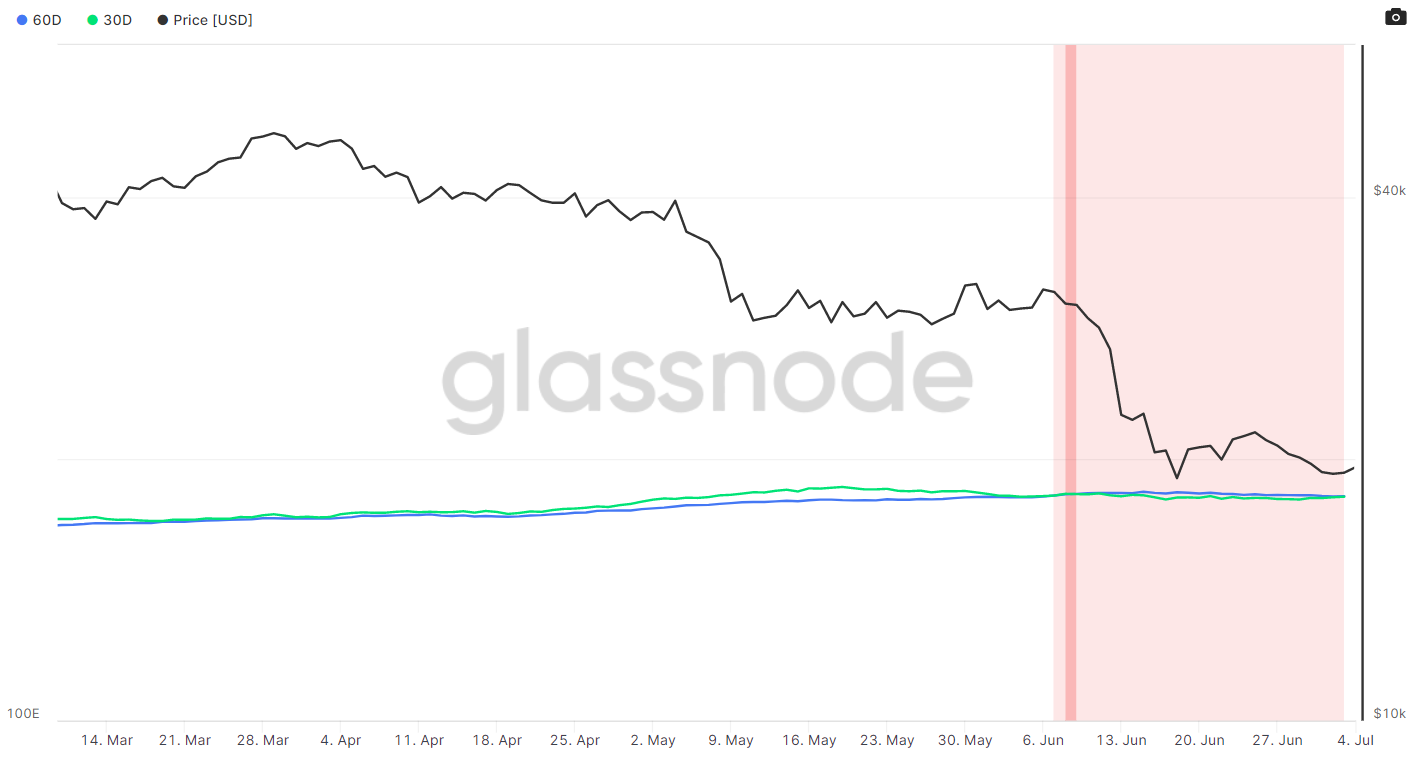
Bitcoin’s hash ribbon indicator. Source: Glassnode
BTC Rebound
There is a possibility of a Bitcoin bounce this week. Such a statement is very easy to say when Bitcoin has had 14 weeks of absolute downside. But there have been some signs recently that have made me think a short-term recovery is possible.
Sellers have struggled to break under the yearly low of $17,600 for some time now. Plus, as I mentioned earlier, sellers could not close the monthly candle under 2017 high, providing confidence among technical buyers.
For Bitcoin to start the recovery process, one should keep a close eye on the Ichimoku indicator, particularly the Ichimoku cloud on the four-hour time frame.
Bulls have been unable to breakout above the Ichimoku cloud in the mentioned time frame since the recent price collapse from $40,000. A move above the cloud—currently at $19,460—could cause a rally towards at least $24,000.
Failure to get a rally going this week and Bitcoin is likely to remain in a precarious position with the $16,500 level a prime target.
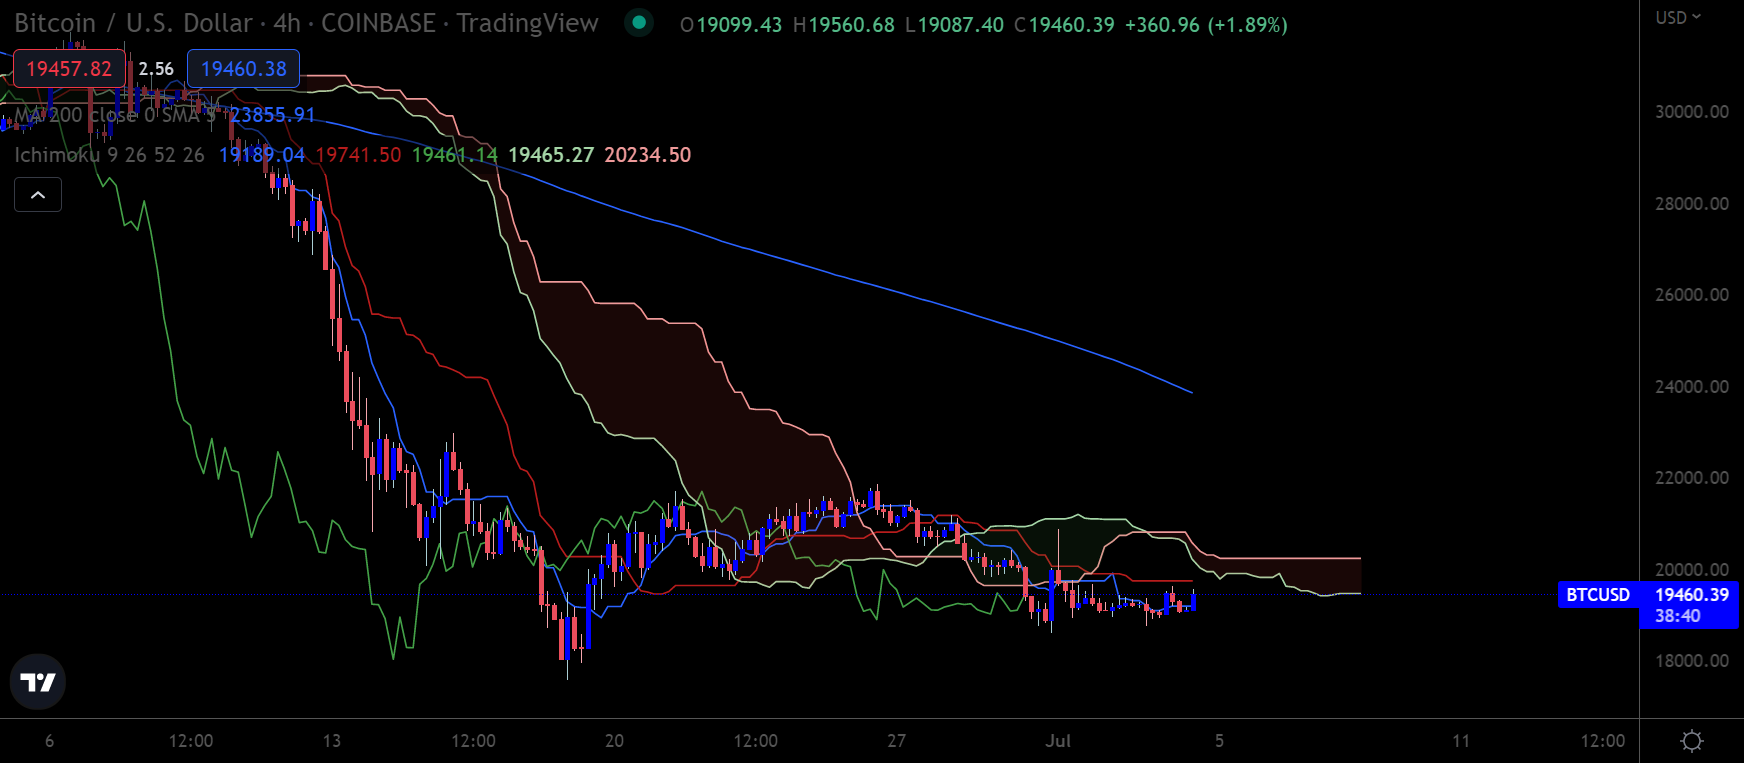
BTC/USD H4 chart. Source: Trading View
ETH Pattern
Ethereum has slumped much further than most expected over recent months, which is no secret. However, the downtrend is showing some signs of exhaustion.
A classic double-bottom price pattern has formed on the lower time frame, providing some hope that ETH bulls can build on last week’s price rally.
Rallies in ETH/USD have been fading quickly recently, and my medium-term price target of $500 has not been reached yet. But, I feel we could have a temporary rally in ETH/USD towards $1,500 before the next downturn begins.
Much will depend on the broader market, especially Bitcoin, regarding what ETH does this week and month. My two big trading ideas are, firstly, look to buy ETH if BTC/USD starts holding above $20,800 and sell ETH if we see the yearly low of $17,600 break.
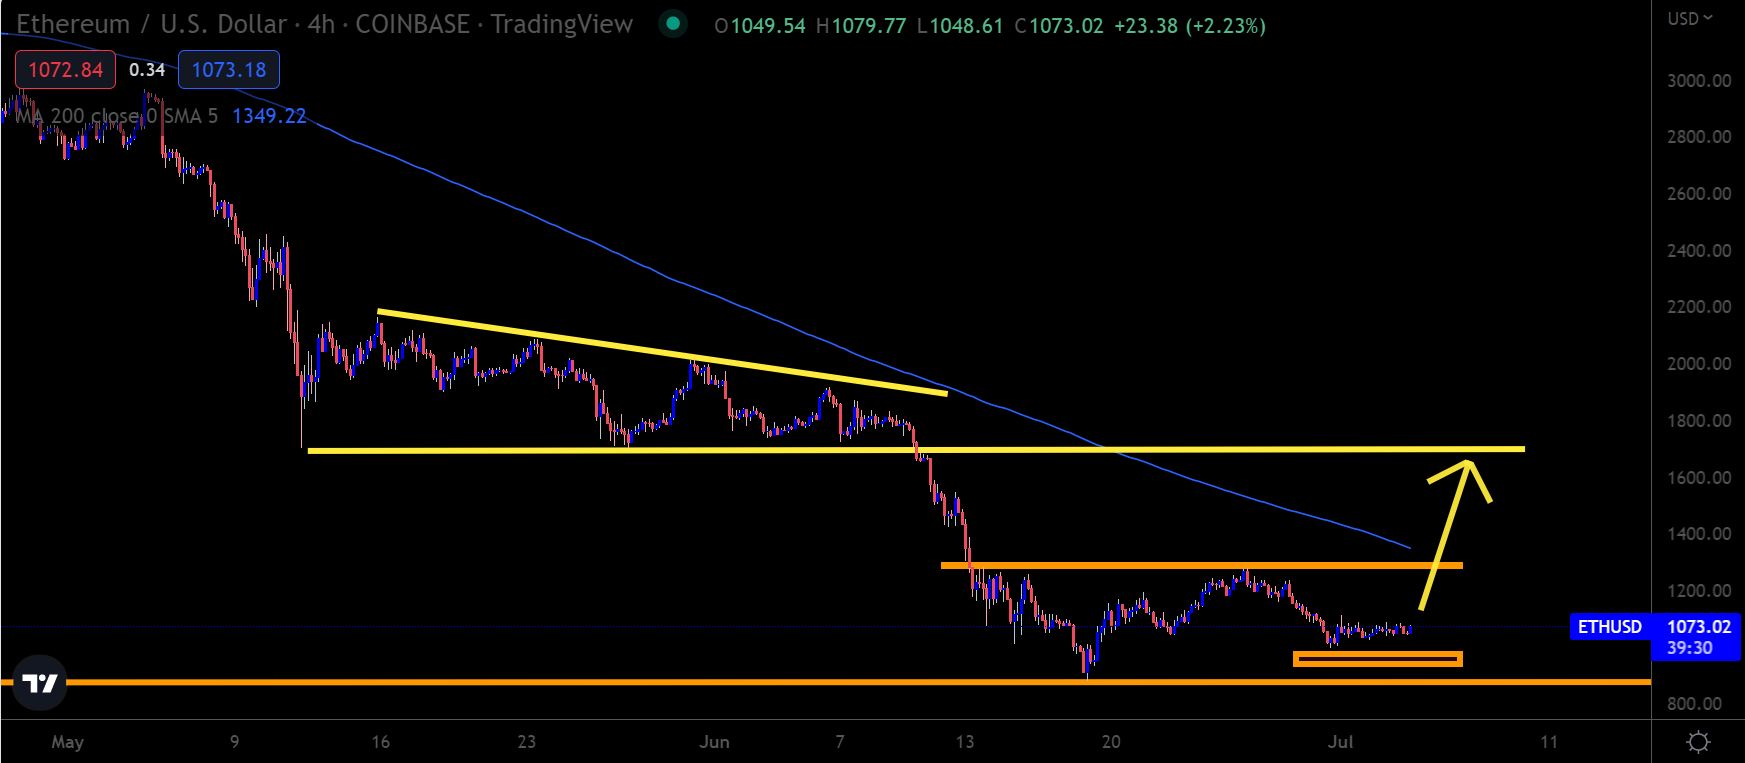
ETH/USD H4 chart. Source: Trading View
BNB Bulls
Binance Coin is a very tradable cryptocurrency and one that I am keeping an increasingly close eye on as the market starts to pick up and recover over the coming days and weeks.
Suppose we were to see the crypto market pick up. In that case, I feel that BNB/USD is a strong candidate for a powerful rally towards the $300 to $330 region, given its historical preference for testing and retesting this area.
Binance Coin’s 200-period moving average on the four-hour time frame, currently at $245, is a potential resistance point, beyond which it’ll be easier for buyers to stage a rally. BNB/USD has stayed below its 200-period MA since April; this needs to change as it often follows a double-digit rally in the token’s price.
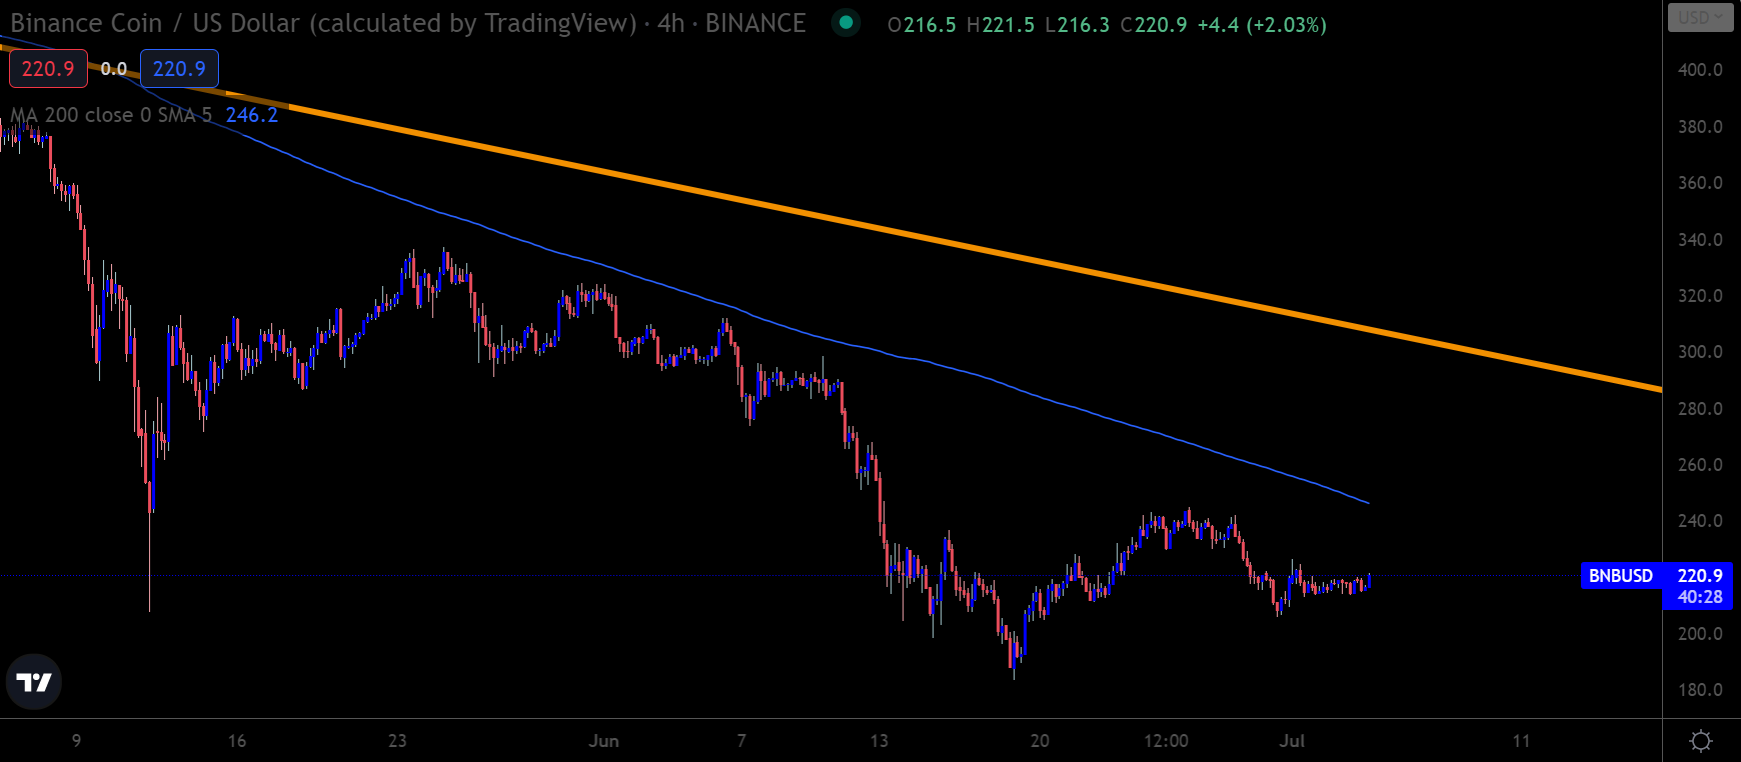
BNB/USD H4 chart. Source: Tradingview
The Plan Ahead
I do feel that there is a chance that the market could start to recover based on the on and off-chain developments I have seen recently.
While it’s way too premature to say that a rally is approaching, I feel it is my duty to point out that the possibility exists for a move towards the $24,000 level, at a very minimum, if BTC starts to move past $20,800.
If Bitcoin starts to move under the $18,500 area for any length of time, I would become very skeptical about a coming rally and keep my powder dry for $16,500 or even $12,400.
