Trouble at $25,000

Bitcoin failed to force a meaningful breakout from the $25,000 level last week, leaving the early-year rally at serious risk of a much-deeper price correction in the days ahead.
BTC failed to rally despite the People’s Bank of China’s ongoing liquidity injection in the Chinese economy. Last week, the Chinese central bank injected a massive $73 billion into its banking system.
Crypto assets were weighed down by losses in U.S. stocks, hawkish comments from a host of Fed speakers, and profit-taking ahead of the FOMC meeting.
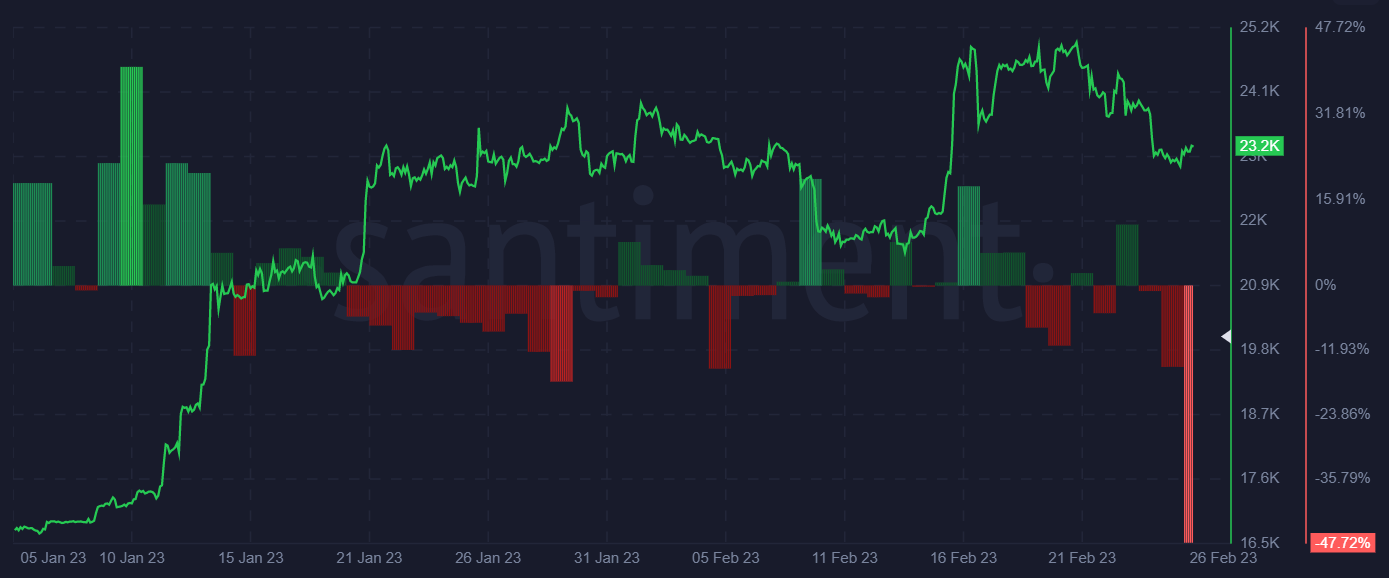
Bitcoin’s failure to break above $25,300 helped a huge amount of BTC/USD leveraged shorts narrowly avoid getting liquidated, as shown by the chart below.
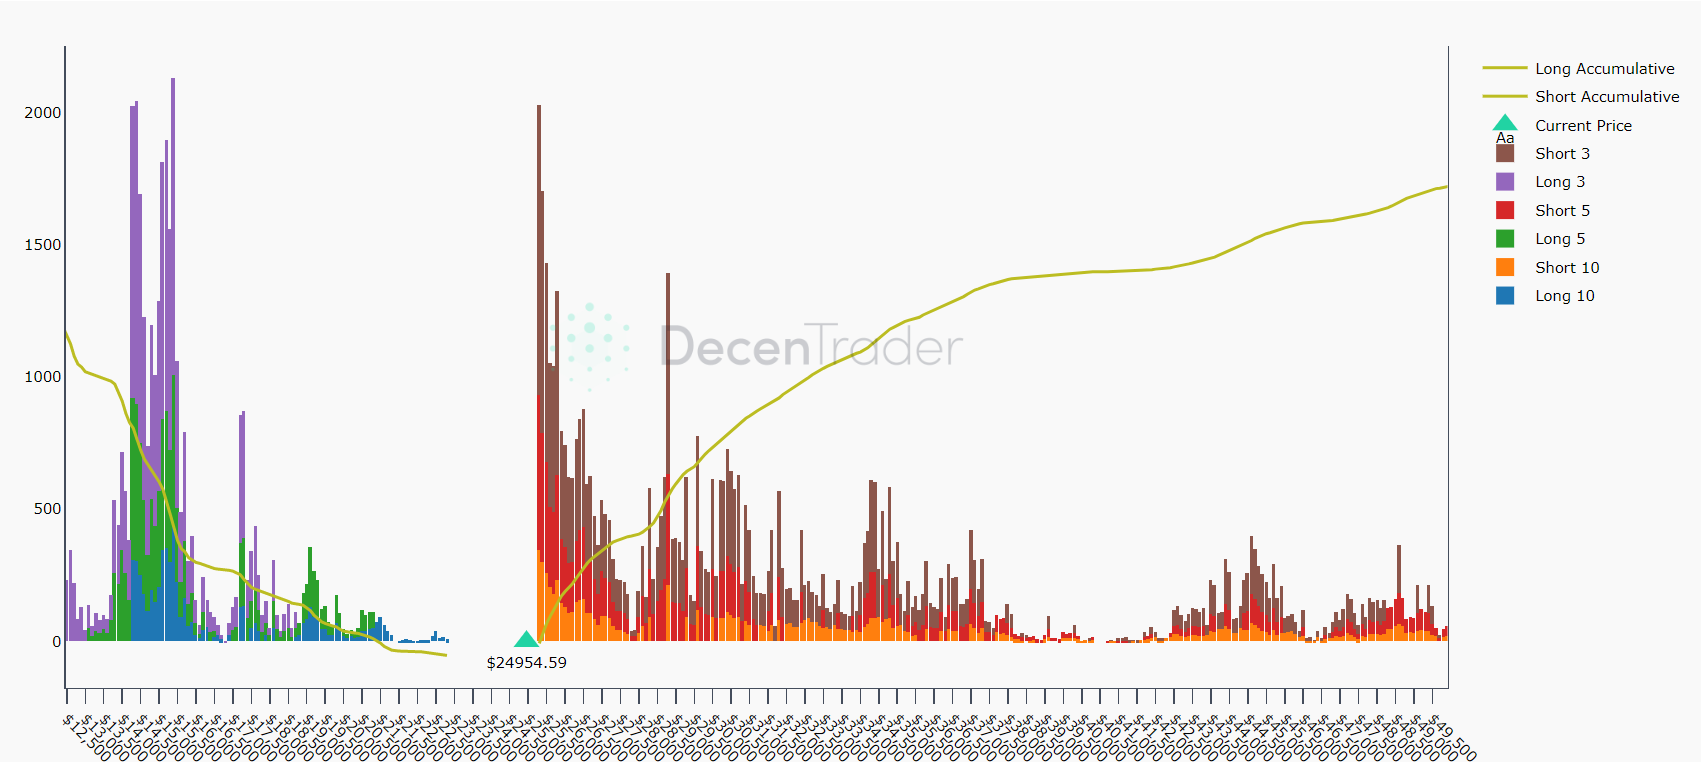
Decentrader—Leveraged liquidation Levels
Last week’s strong PCE inflation report caused crypto to turn lower as it significantly increased expectations of more rate hikes from the Fed. PCE is the U.S. central bank’s preferred inflation gauge.
The Wall Street Journal also reported last week that banks were ending partnerships with crypto firms for fear of reprisals from regulators, further dampening crypto sentiment.
A note from Citifx also suggested that their preliminary estimate for FX hedge rebalancing pointed to strong U.S. dollar buying for this month’s end, which could further weigh on crypto assets.
Retail Buyers
One rule that I have been constantly taught is that retail traders tend to be on the wrong side of the trade.
If this is correct, then there are very worrying signs in the crypto market now. The stock market should start to set some alarm bells ringing as well.
Retail has basically been responsible for the recent run higher in both crypto and stocks, according to most of the data points I have been viewing.
Individual investors have been snapping up stocks at the fastest pace on record.
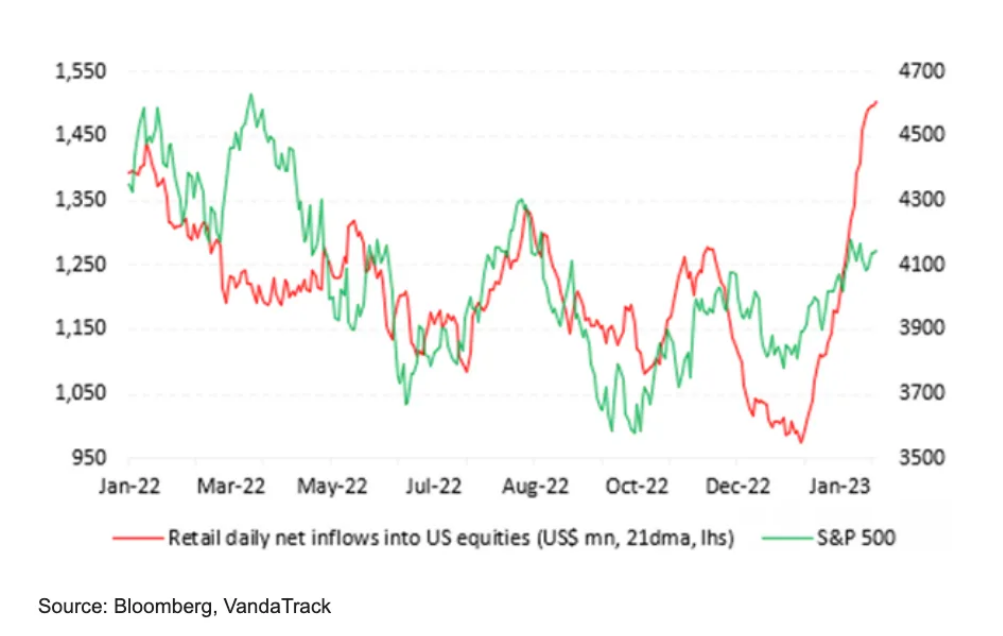
Over the past month, retail investors funneled an average of $1.5 billion each day into U.S. stocks, the highest amount ever recorded, according to data from research firm VandaTrack published last Thursday.
With this in mind, it is quite plausible that we are in the midst of a bear market rally that got way too overextended. We may not have seen the lows in crypto yet.
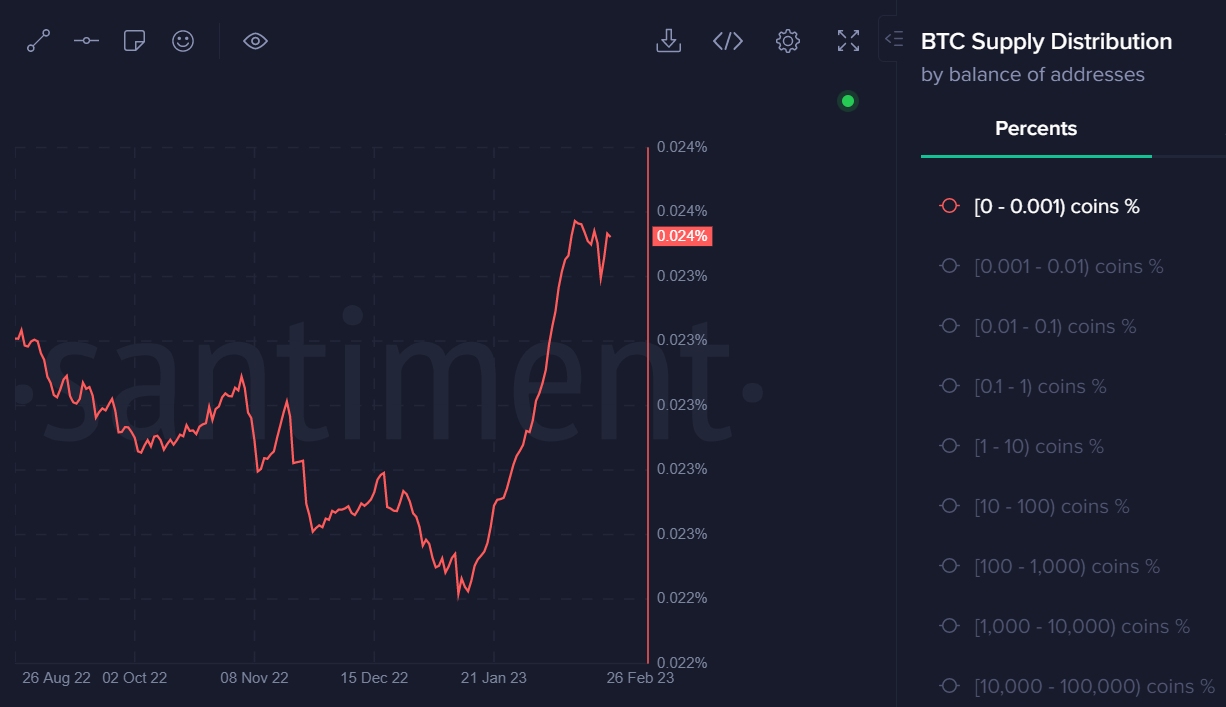
On-Chain Watch
As you can see by the attached price chart, small BTC holders—far from deterred by the latest price correction—are still buying aggressively. Very worrying indeed.
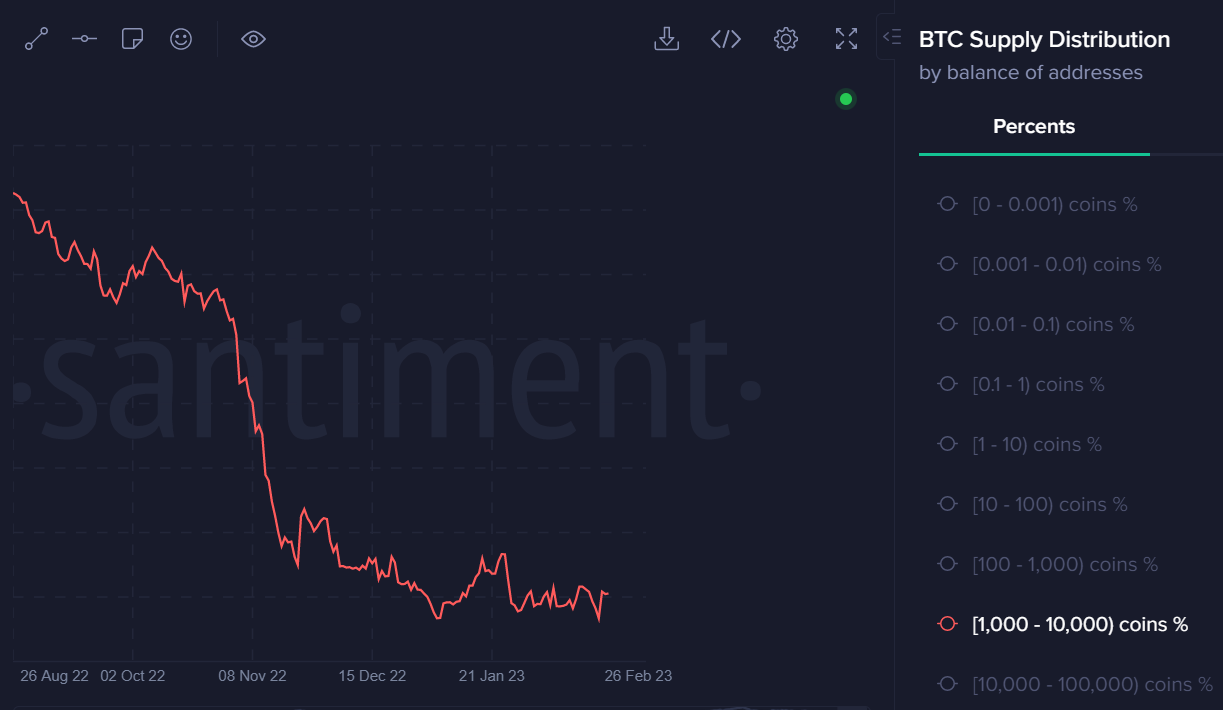
Conversely, mid-tier whales remain disinterested in this rally and have basically failed to participate since $23,000 was tagged.
Moving to Daily Active Address Activity, we can spot some notable divergences with price.
Looking closely at the chart, the DAA adjusted price divergence extends down towards the $21,700 level and at its most extreme down to $20,000.
BTC Waves
Elliot Wave analysis is coming out with some very interesting projections right now. Basically, QCP’s analysis suggests that BTC could be in the midst of a Wave 5 now, and going down to the Wave 3 low of $15,480—maybe deeper.
The theory introduced by Ralph Nelson Elliott has always been a difficult one to grasp. Never one to care much about what other analysts say, I do find the theory interesting as I also lean bearish right now.
Elliot claims that asset price movements can be predicted by observing and identifying a repetitive wave pattern.
A break of $19,700 would confirm the same for me, with a target of $14,000 of $13,000 being my personal analysis as long-time PRO BTC Trader readers know.
Only a break above $25,300, with momentum, would convince me that the bull case is alive and kicking. $28,000 would become the next bullish target.
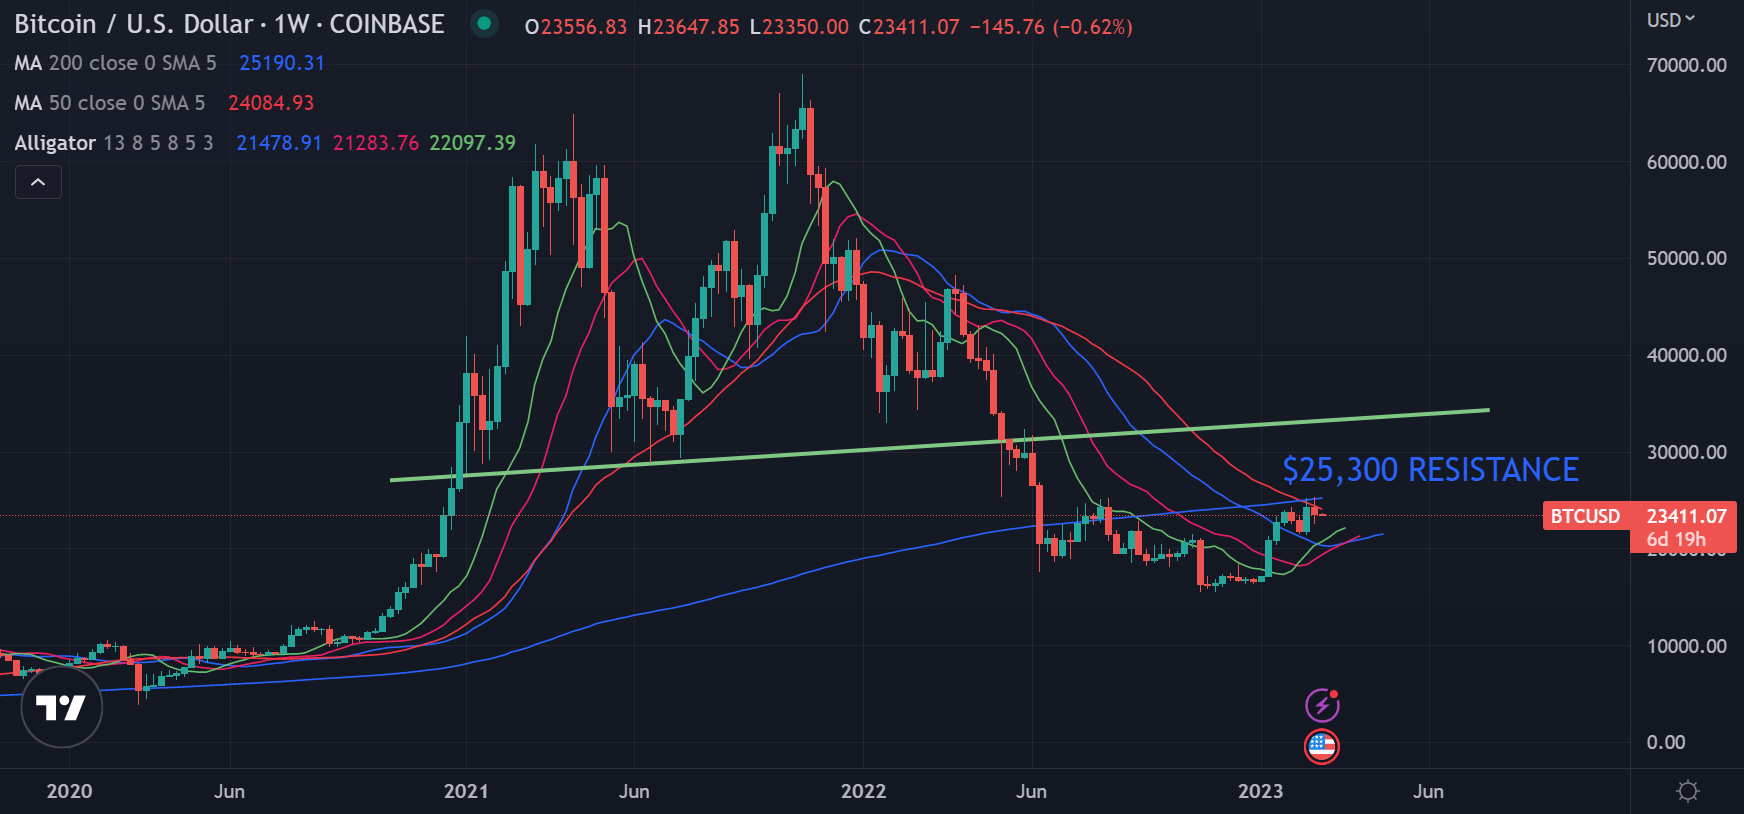
BTC/USD Tradingview.com
ETH and $1,400
I posted in January that the big area to watch for ether was the $1,700 to $1,750 area, and seeing as a big rejection has taken place, it seems the direction of travel is lower.
Based on technical analysis, I am going with the $1,400 level as the first meaty bearish target if the correction gains strength. A monthly close under this level, and I would be inclined to look much lower for a final bearish target.
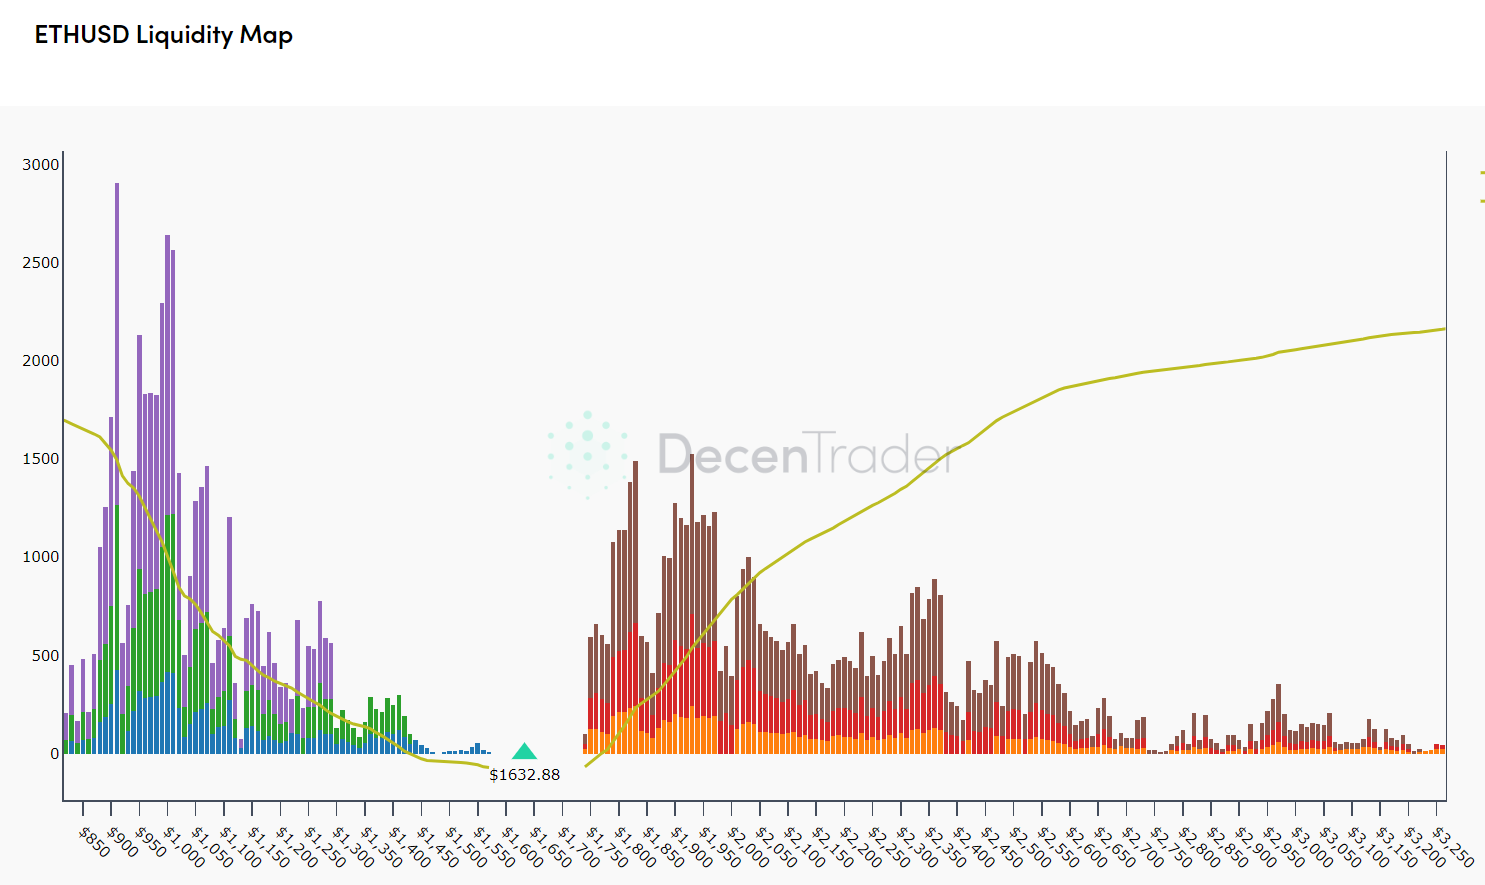
I am going to throw an even more interesting chart in the equation today. Take a look at the leverage liquidation levels for ETH. Liquidations really begin to speed up below $1,250.
Also, you can see ETH narrowly avoided taking out a series of large sell stops during the recent push above $1,700.
One day, when those stops are blown, the chart alludes to a quick price pump to $2,400.
XRP Weakness
Ripple has been one of the big underperformers of this early year recovery. Despite talk of XRP entering into a new bull market, this has not happened.
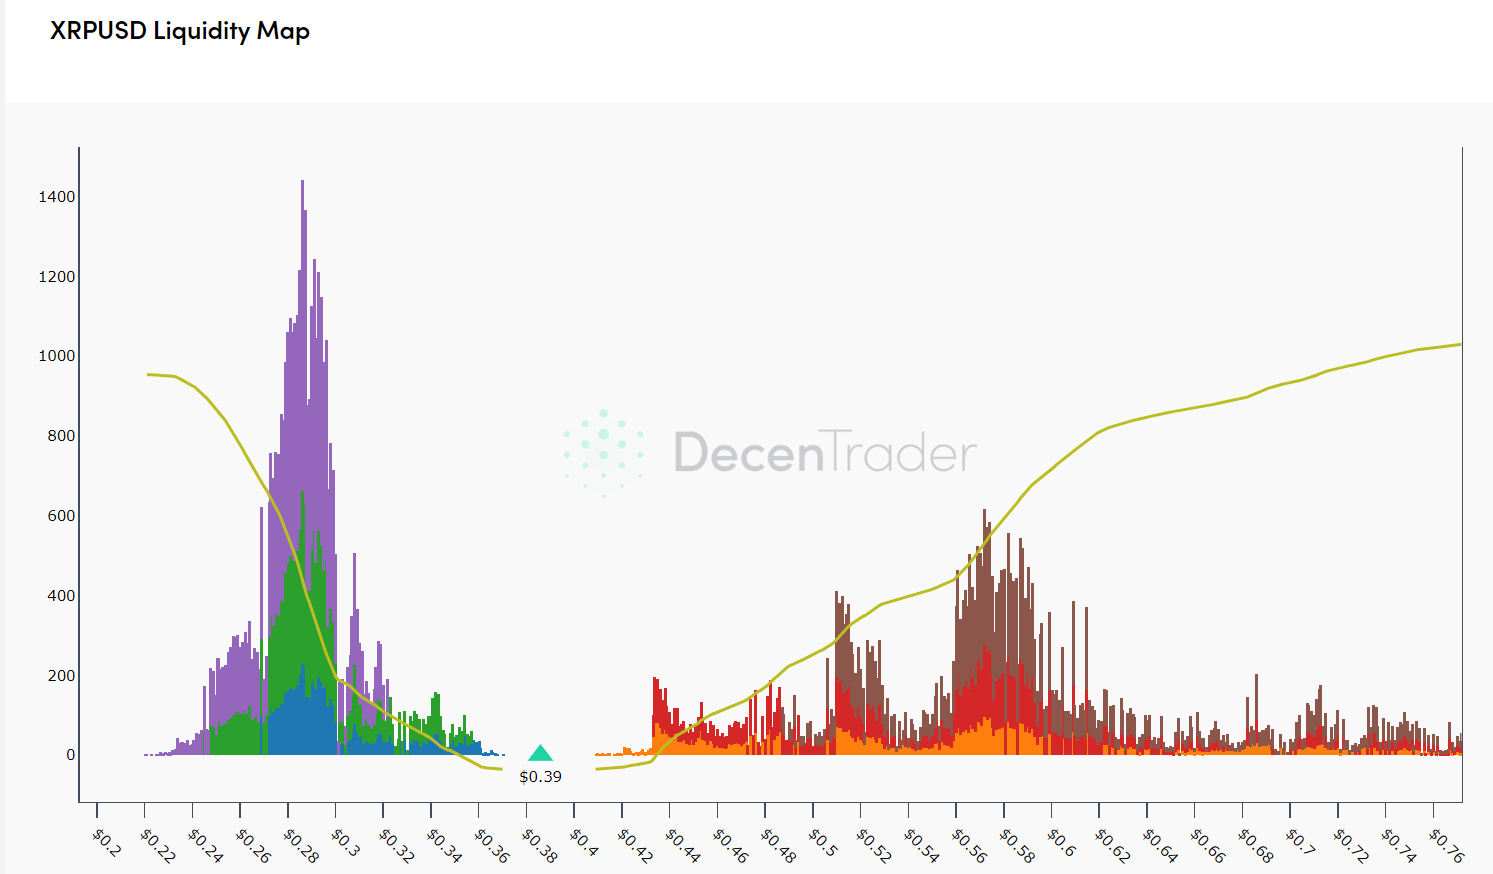
Liquidation level analysis highlights the $0.50 level as the breakout level area. I don’t see that on the cards just yet.
On the flip side, buy stops are layered down to $0.2800 and really accelerate down to $0.2150. If those stops are blown out, I might just pick up some XRP.
In Summary
This will be another important week for BTC. Technically, the stage looks ready for a rally-or-bust scenario in March.
The huge cash injection coming in from China could be a valid reason why crypto assets have risen so dramatically, and may continue to do so.
Keeping a close watch on stocks, whale activity, and the PBOC’s daily operation is well advised this week.
