The Rally’s Mixed Signs

Bitcoin rose last week and reached the $23,400 resistance zone, finishing a third week of solid price gains. Gains in U.S. technology stocks, alongside comments from some Fed speakers last week, helped this move.
The market shrugged off the news about Genesis filing for bankruptcy and the DOJ’s actions against Bitzlato. That’s reasonable, given a rather neutral-to-positive outcome for DCG and its products, and Bitzlato being a lesser-known exchange.
According to CoinShares, investments in crypto funds rose last week, with relatively small inflows following three weeks of withdrawals. Bitcoin investments increased by $10 million and Ethereum by $6 million. For altcoins, Solana recorded the most significant inflows ($1.3 million), while XRP showed the most significant outflows ($3.3 million).
Despite solid gains, many crypto assets remain undervalued according to their respective MVRV Z-Scores.
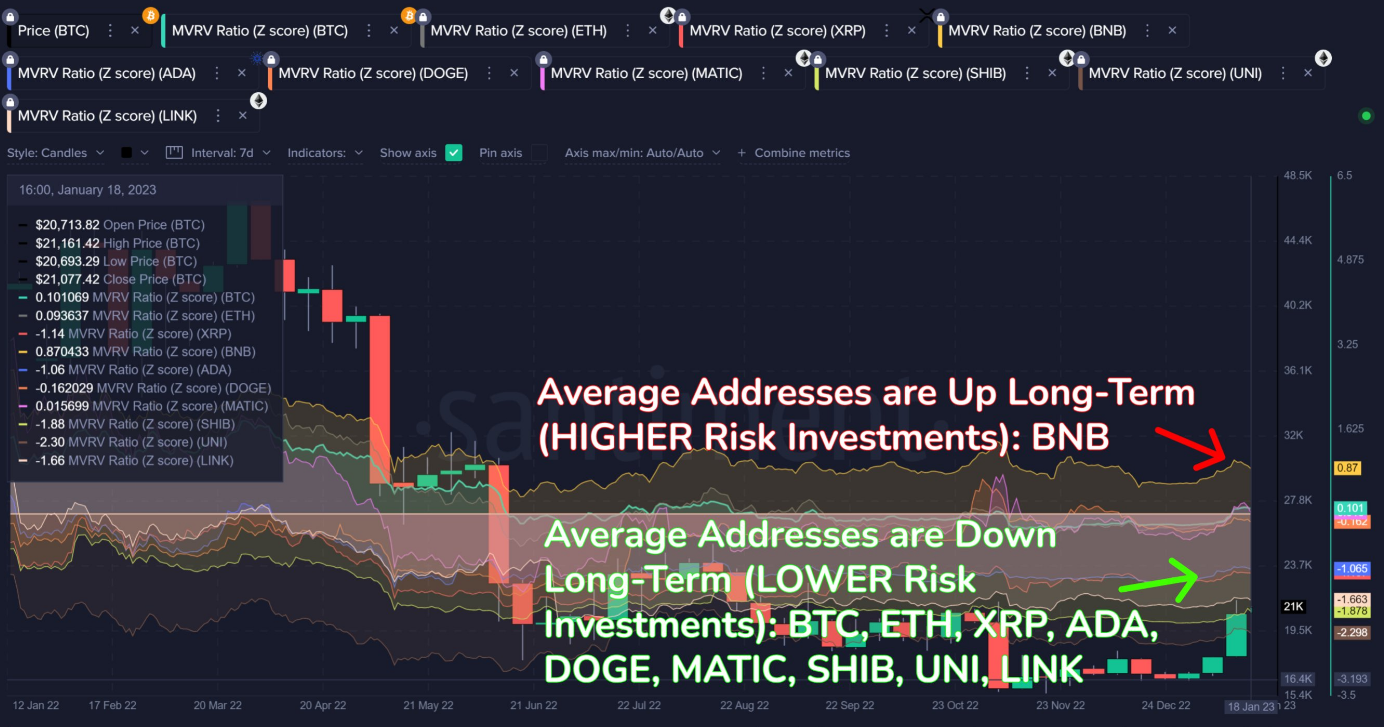
MVRV Score BTC, ETH, XRP, BNB, ADA, MATIC SHIB, UNI (Source: Santiment).
On the other hand, the Lunar New Year is going until January 24. During this time, many Asian Over-the-Counter (OTC) services will be closed, which could increase crypto volatility. Chinese New Year has historically been bearish for crypto.
Is Crypto Decoupling From Equities?
Last week the crypto data provider Santiment tweeted that BTC was starting to decouple from equity markets, and that bull markets usually start when there is a low correlation between equities and crypto.
However, Friday’s price action shows that the correlation between crypto and stocks remains. Thus, Santiment’s argument appears to be premature.
The market still largely depends on the Fed’s policy regarding interest rates. The market isn’t out of the woods until the Fed changes its hawkish stance. And some Fed officials said yesterday that more rate hikes are needed.
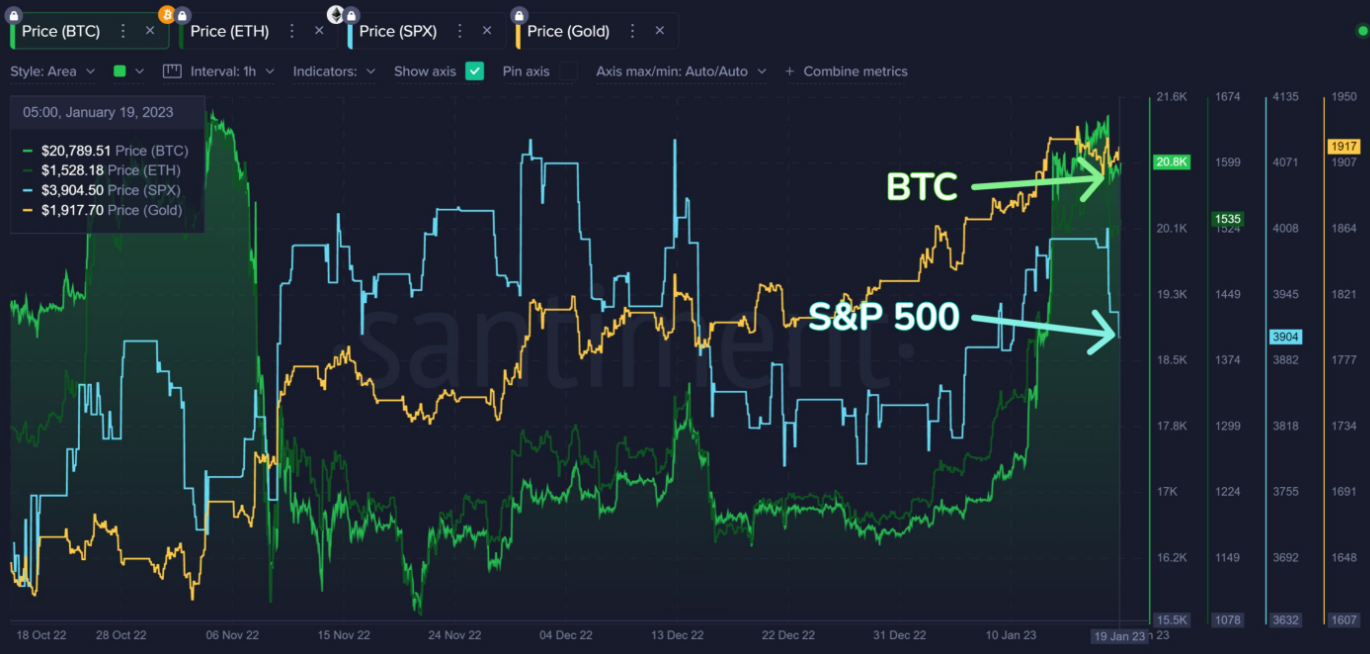
BTC vs. equities and gold (Source: Santiment).
I still think that U.S. equity markets, especially the S&P 500 index, have not bottomed out yet.
My chart points squarely toward the 3,300 to 3,200 area as a final target for the S&P 500. If this target is reached, crypto will likely head lower as well.
And if the bottom is in already, recovery is still in its early stages, so I’m seeking more confirmations.
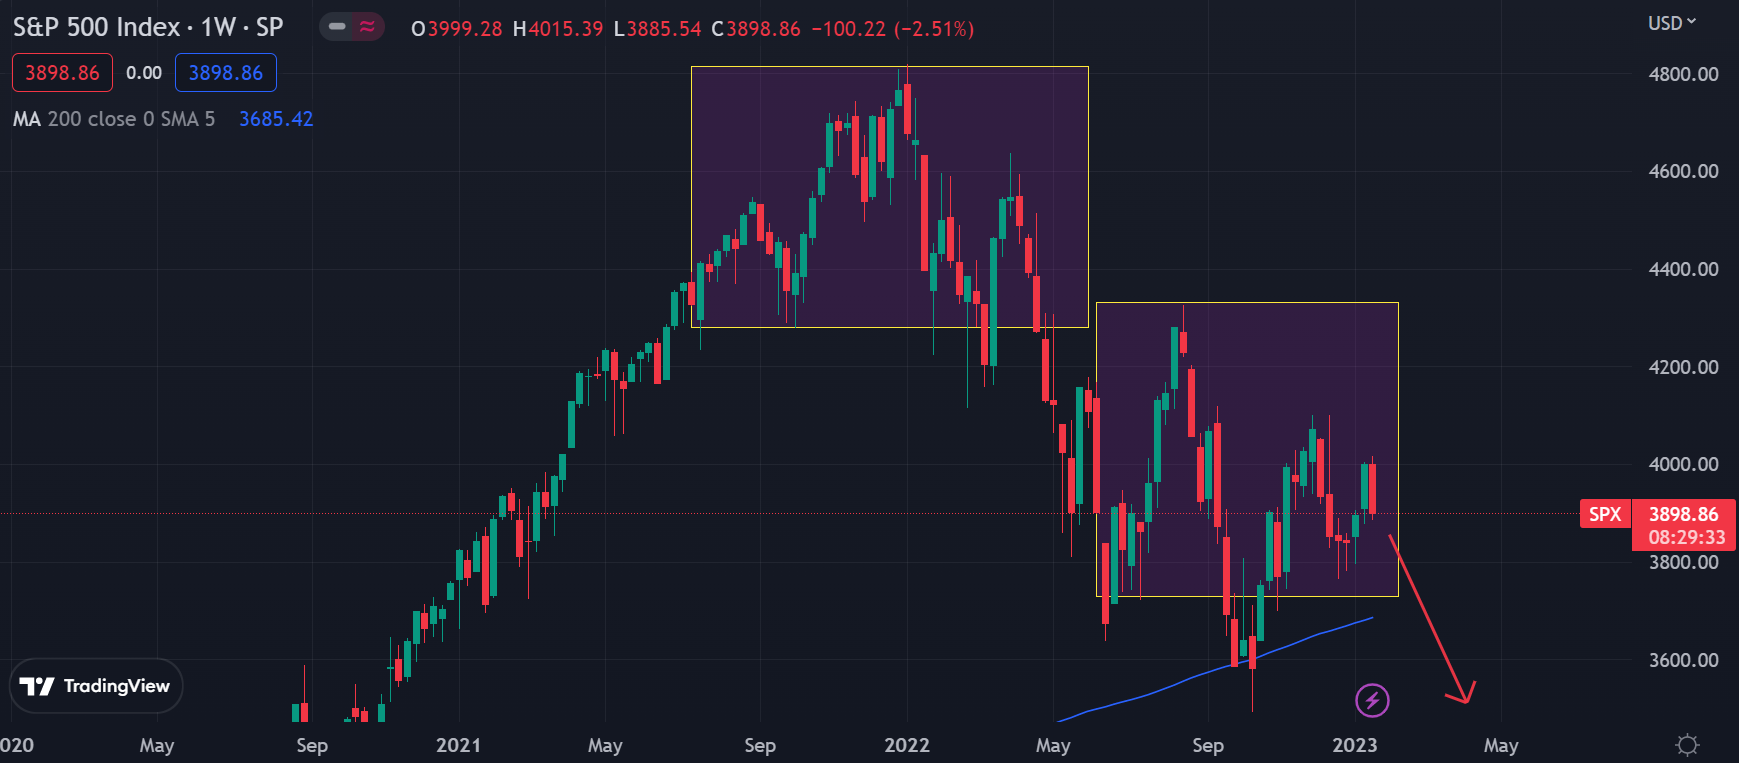
S&P 500 Weekly chart (Source: TradingView).
Economic Calendar
With the attention switching away from Fed speakers, this week, traders will get to assess some economic data again, as we will see the release of the U.S. GDP, manufacturing, and trade data.
Last week, data indicated that jobless claims continued to slump in the United States. This fact alone can give the Fed reason to continue hiking rates.
On-Chain Watch
Regarding on-chain activity, the signals for a new bull market are reasonably mixed. This week I will touch upon Profit Taking, Exchange Data, Whale Behaviour, and on-chain Volume.
Last week BTC Network Profit and Loss spiked quite dramatically in both directions, which clouded any potential signal. However, given the spikes, smart money could be cashing out.
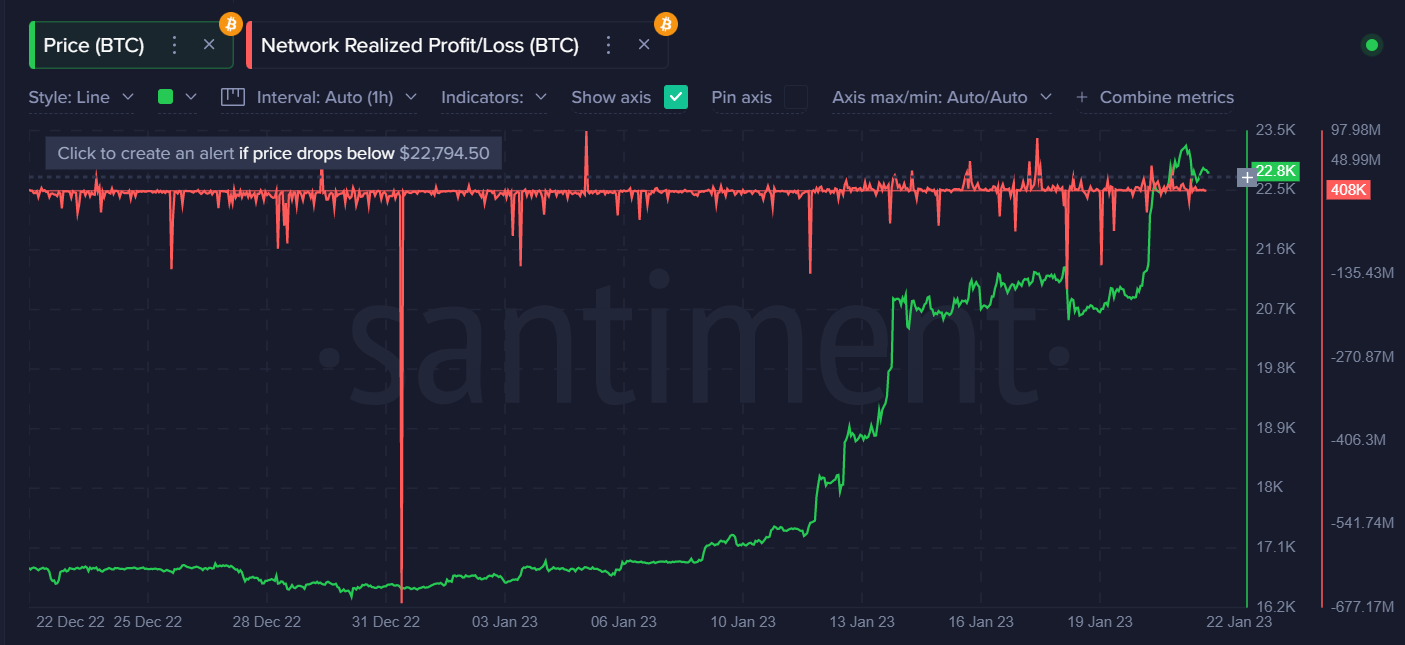
Source: Santiment.
At the start of this rally, we saw big downticks in this metric. A substantial dip in this metric implies the coin’s holders are (on average) realizing losses, suggesting panic sell-offs and investor capitulation. Alternatively, that can be attributed to tax loss harvesting.
BTC Exchange Flow Balance went up the highest since September 2022. Such upticks are bearish, so BTC could start to retrace in the coming days.
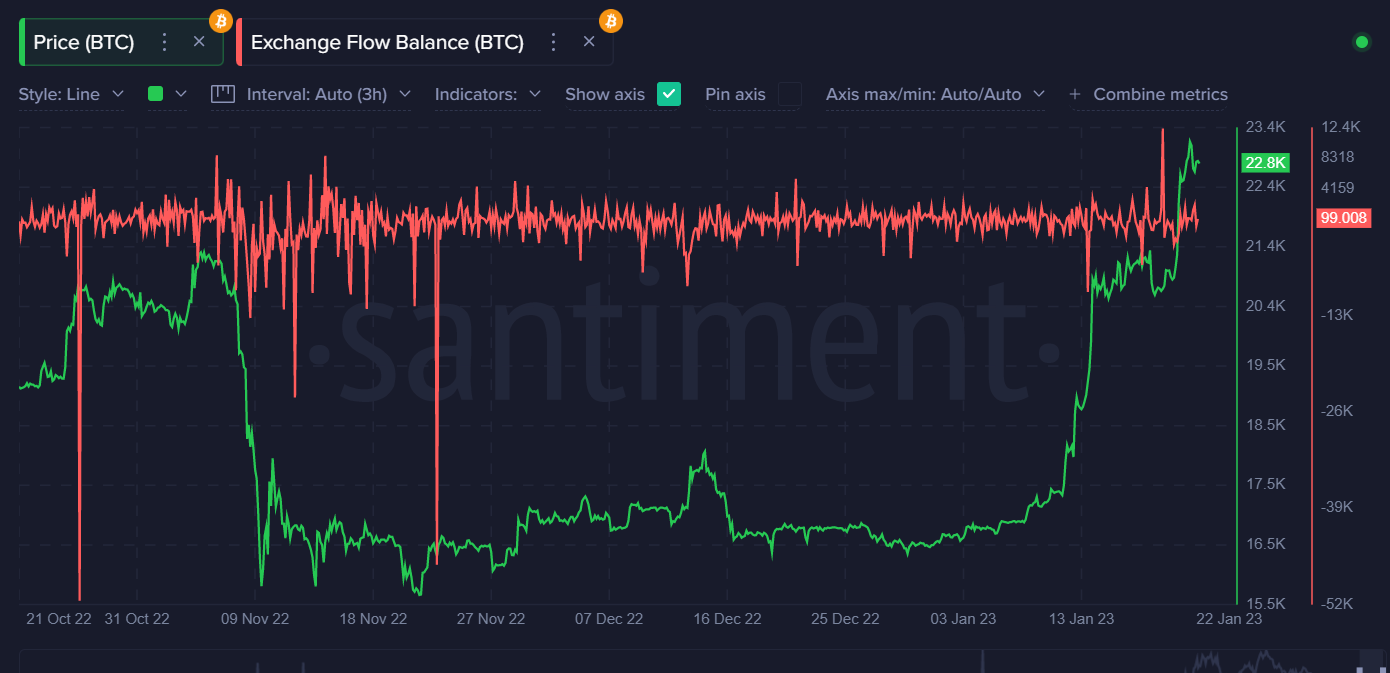
Source: Santiment.
Mid-tier whales continued to buy Bitcoin last week. However, pay attention to the attached six-month mid-tier whale balances chart. If the rally continues, BTC can go a lot higher, but at the same time, it is premature to be overly bullish here.
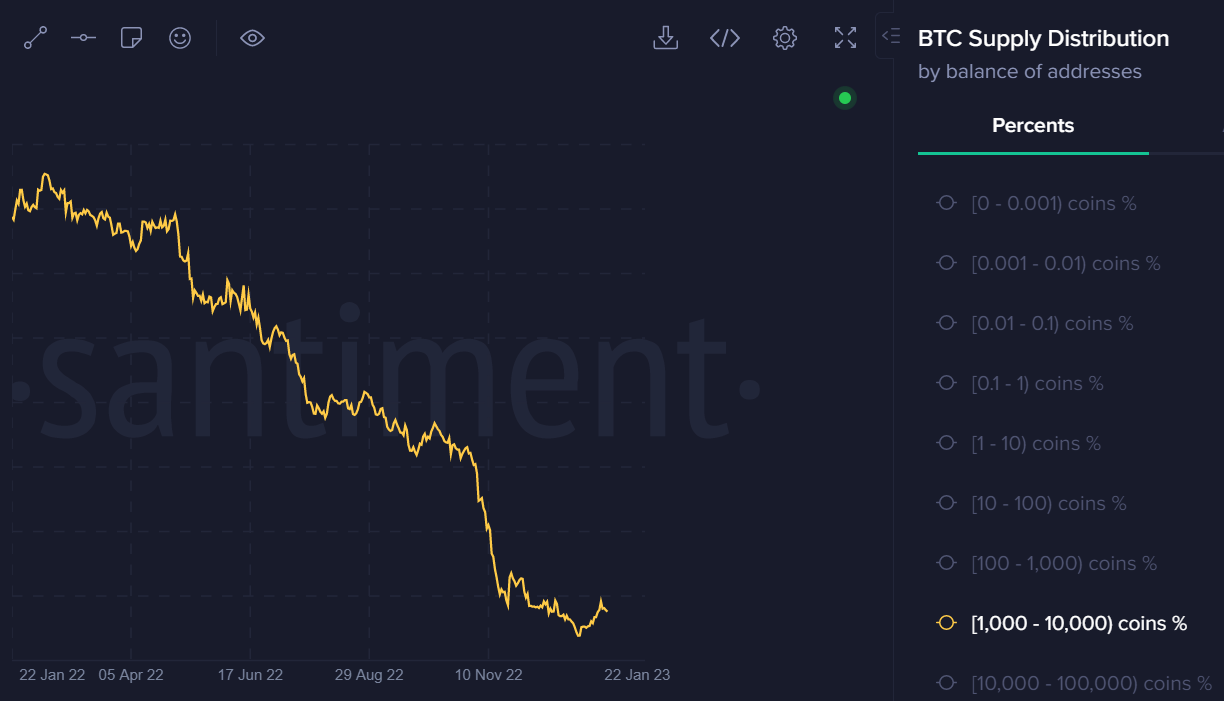
Source: Santiment.
Volumes have remained rather tepid. Buy volumes aren’t consistent with previous cycle recoveries. They are far lower.
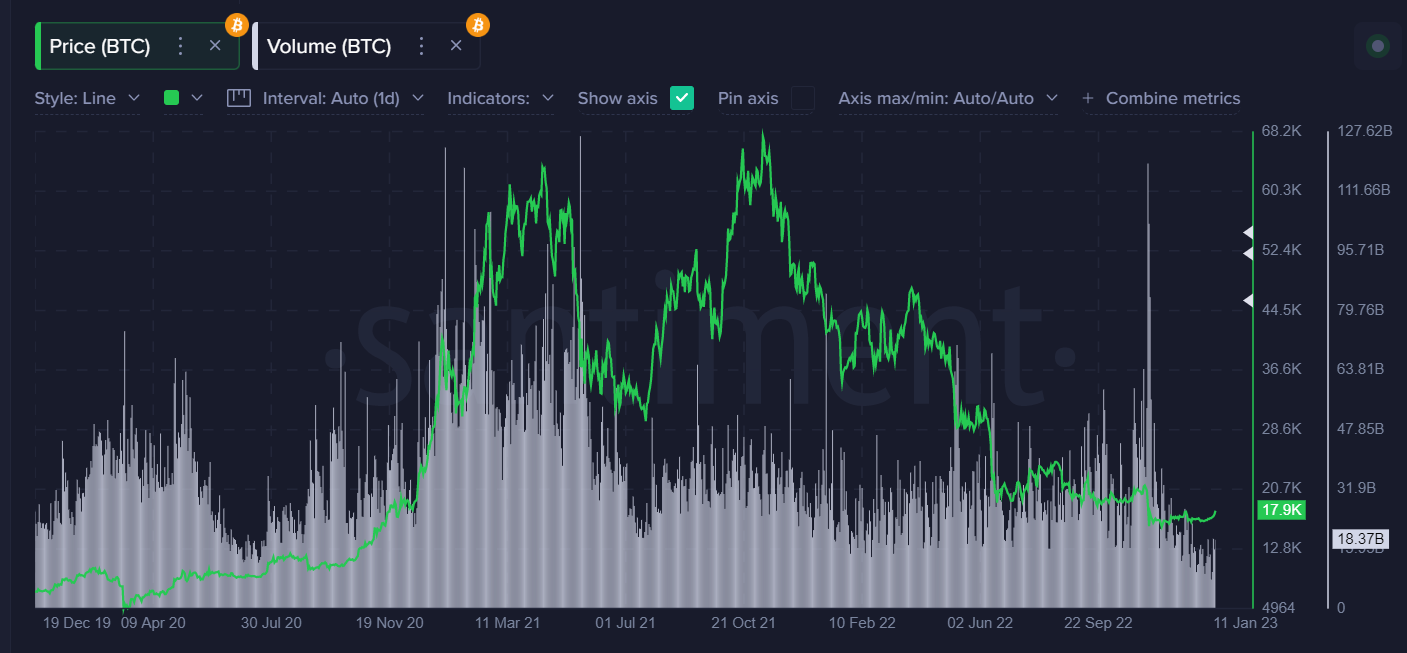
Source: Santiment.
BTC/USD: Make or Break
I see two scenarios on the table in the short term, which involve key moving averages.
Either BTC is heading towards $25,000, the location of its 200-week moving average, or the $19,300 area, the location of its 200-day moving average. Buying a dip to the 200-day or selling a test of the 200-week are the most reasonable trade ideas here.
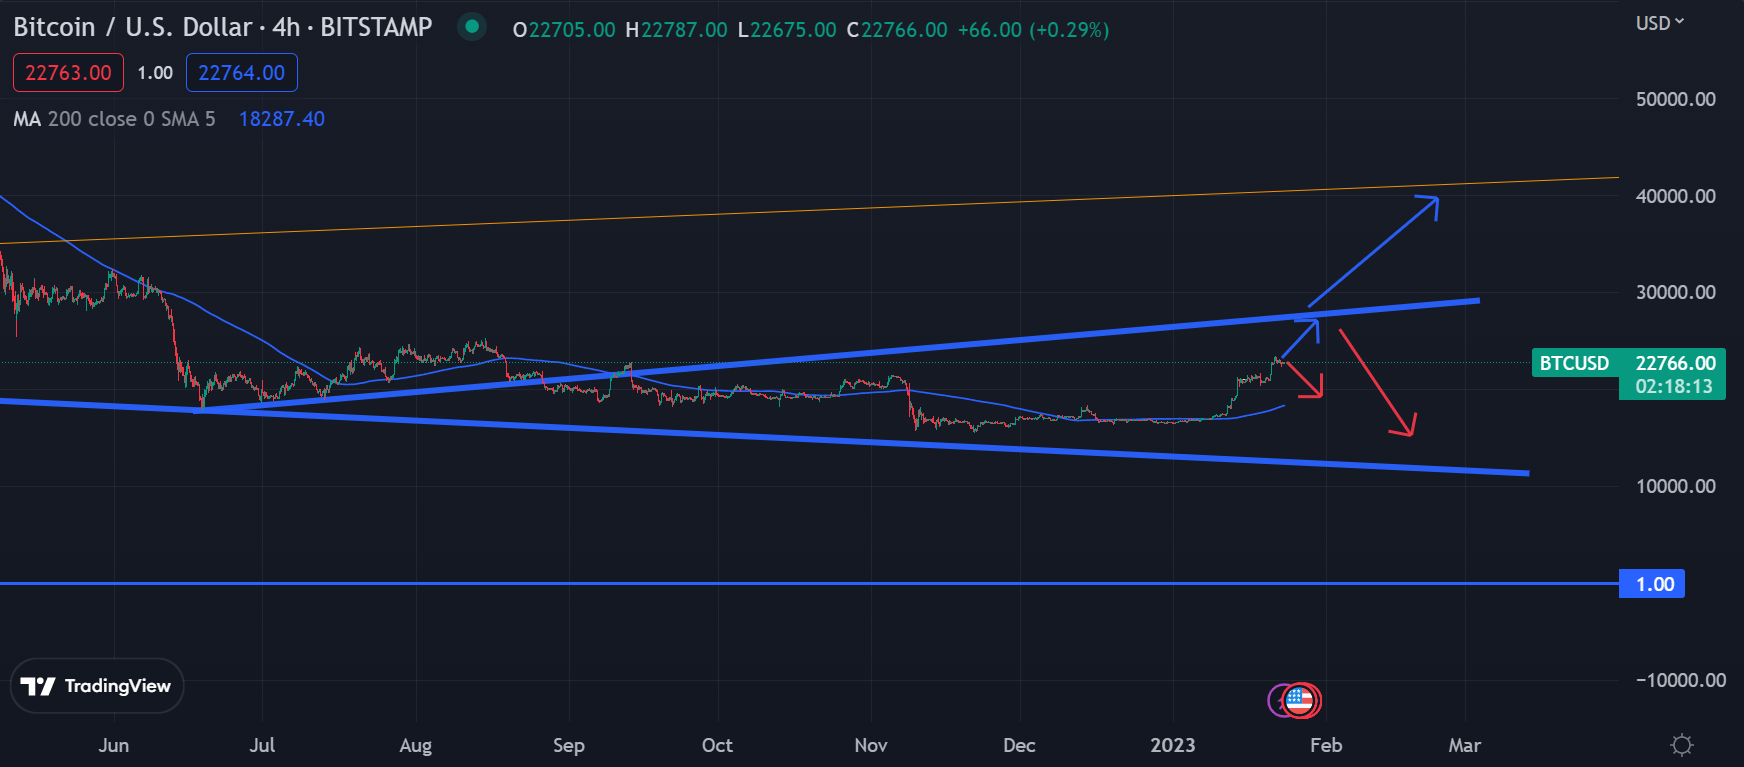
BTC/USD four-hour chart (Source: TradingView).
ETH/USD: Overbought
ETH is showing me some worrying signs on the charts right now, such as a bearish MACD price divergence and being at its most overbought on the RSI since mid-2020.
We should pay close attention to the $1,730 to $1,750 area this week as it is of extreme technical importance to Ethereum.
Should we see rejection in this area, ETH could roll back toward the $1,300 level. A breakout past this area, and we could see a $2,000 test.
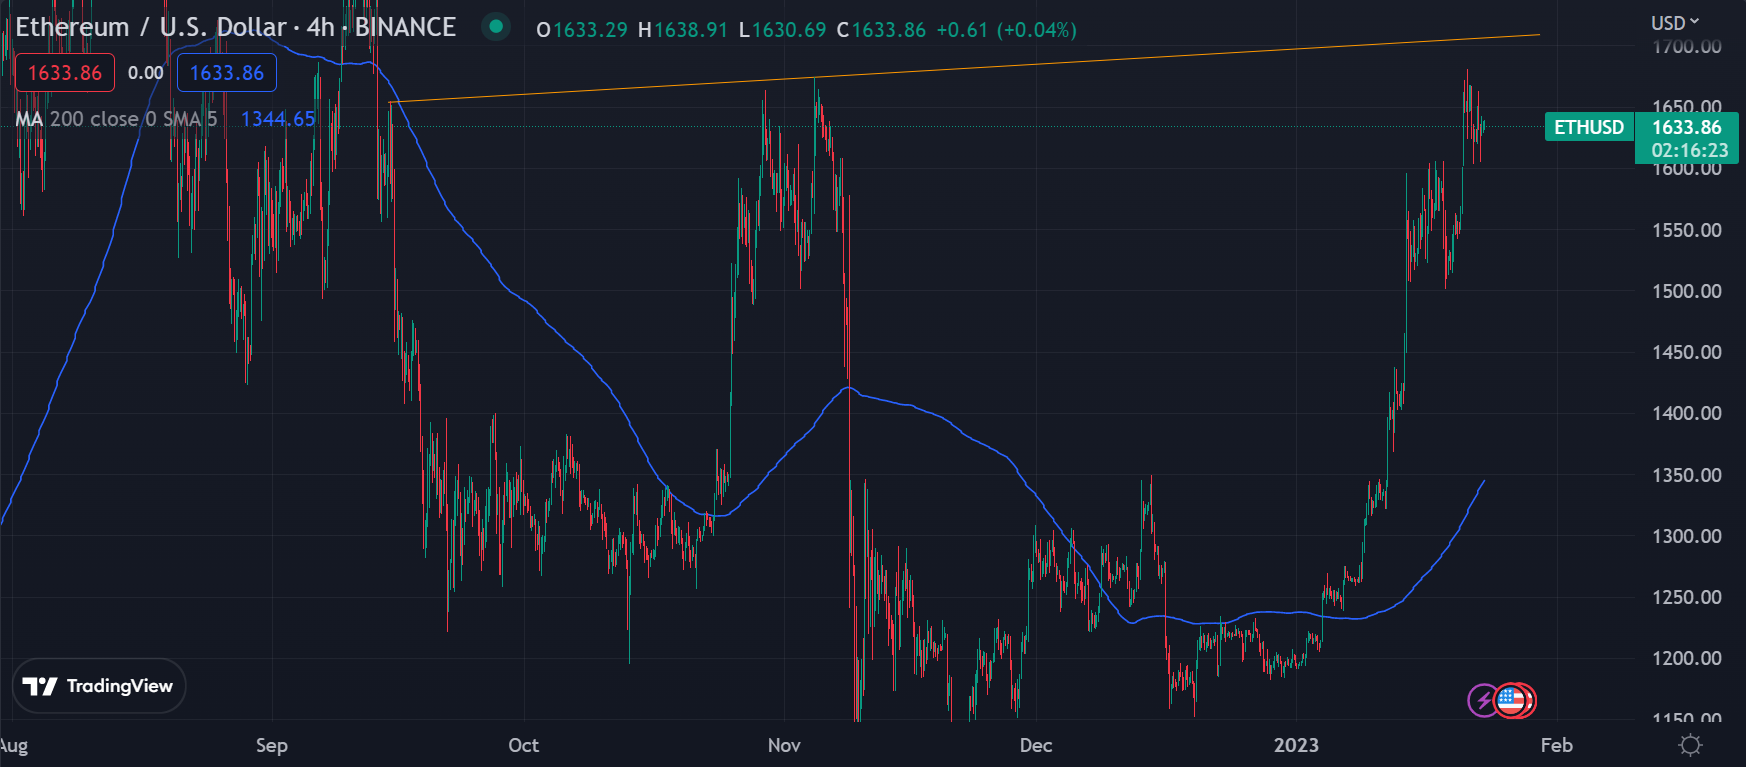
ETH/USD four-hour chart (Source: TradingView).
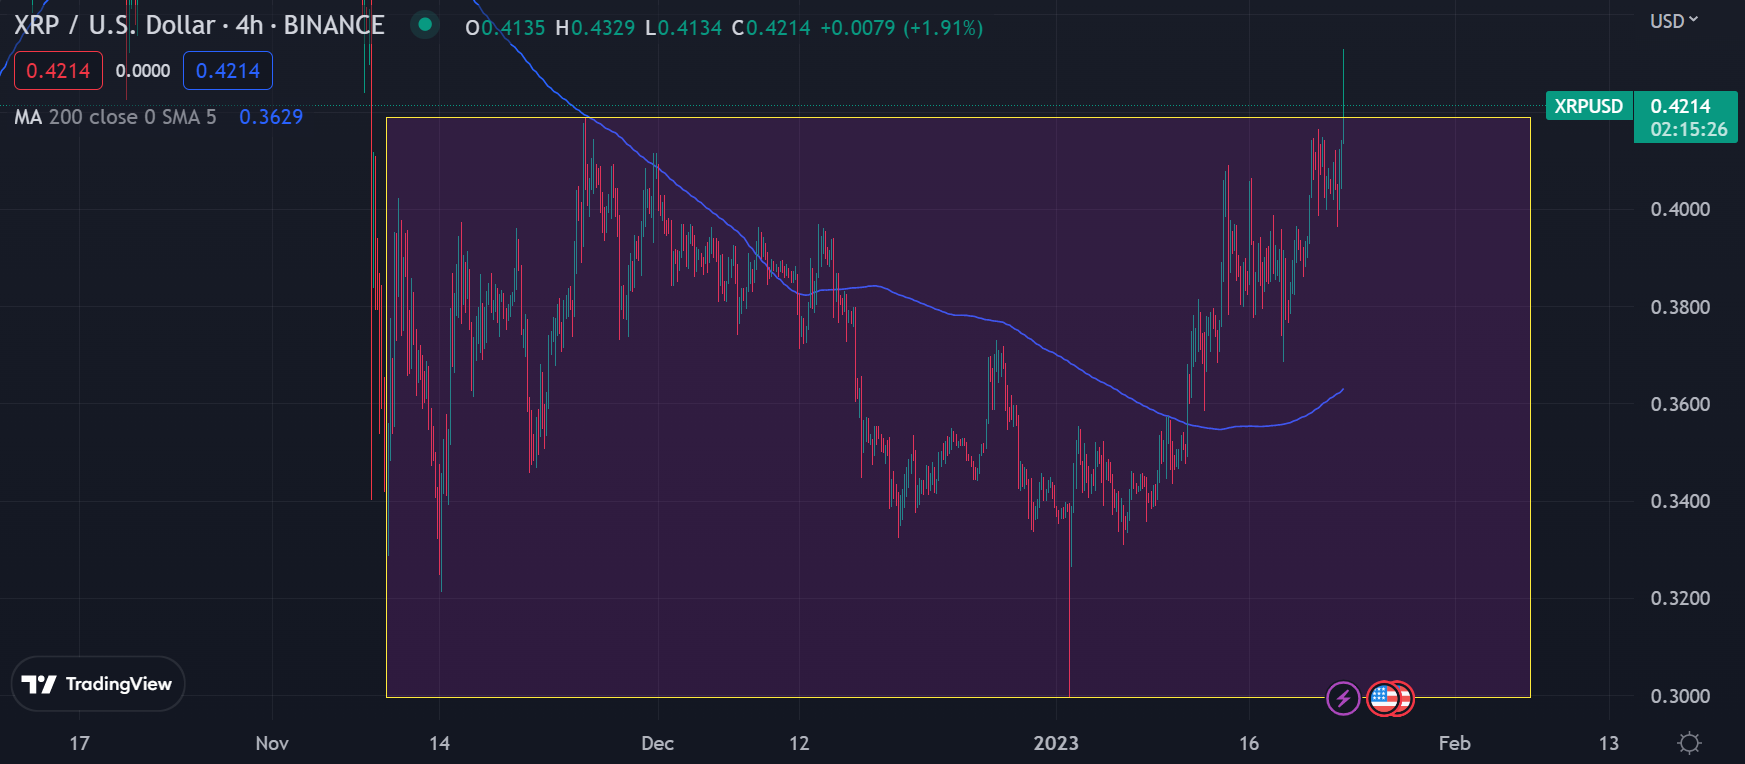
XRP/USD: The Laggard
Ripple has been lagging other cryptos quite considerably during this latest move higher.
Lesser-loved cryptocurrencies often lag in the early stages of recoveries, and then play serious double-digit catch-up later. So if you are bullish on XRP, you may still have a chance to enter.
The charts are clear for XRP at the moment: continued strength above $0.4200 would mean much-more upside movement and, eventually, a test of $0.5000.
If XRP clears the $0.5000 level, the upside potential is tremendous. I still have doubts about this happening though, as the broader market appears frothy.
Conclusion
Bitcoin is showing some very encouraging signs from a technical perspective. However, on-chain activity is less impressive. Weak volume and a slight recovery in whale buying are not trend-change signals.
Much will depend on the next Fed meeting. Mixed messages from Fed members certainly make trading decisions more challenging.
Overall, I remain on the fence right now. Only a break above $25,000 would convince me that BTC will not revisit the year’s lows.
