Lower, Then Higher

Last week, bitcoin continued to move lower toward the $16,000 level amidst painfully slow holiday trading conditions as trading volume and liquidity largely declined.
Blockforce Capital recently reported that BTC’s seven-day annualized volatility hit its lowest point since July 20, 2020, and declined by over 10 percent from the previous trading week.
As bitcoin closed out a painful year, its overall decline was nearly 65%.
Additionally, BTC posted a fourth consecutive negative quarterly performance for the first time in history, further underscoring the extent of the ongoing bear market.
In terms of price catalysts last week, news that Microstrategy sold some of its BTC negatively impacted market sentiment, even though reports showed it re-bought some coins later.
Moreover, the amount of BTC transactions over $1 million is now at its lowest level in over two years, according to data from Santiment.
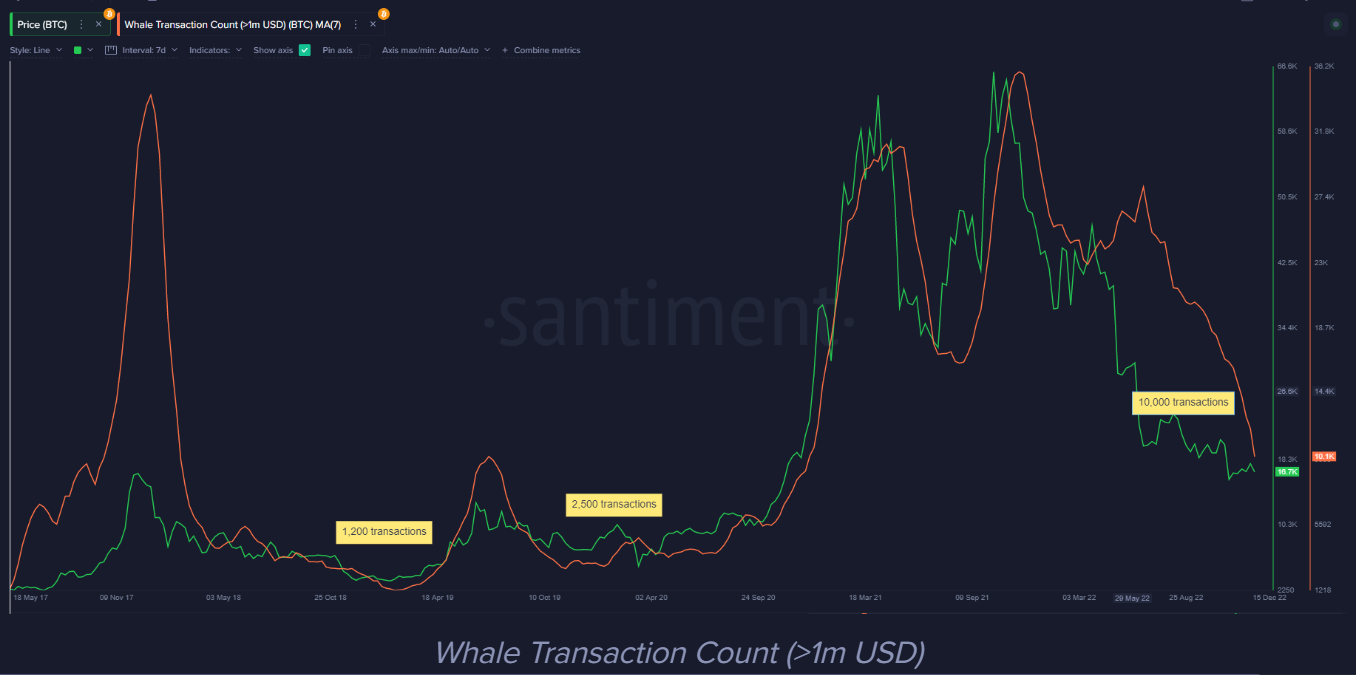
Whale Transaction Count (Source: Santiment).
Without positive news catalysts, BTC can be easily pushed lower on low liquidity.
January Outlook
January is usually a losing month with high volatility and an average monthly loss greater than 20 percent.
This historical data fits well with the current backdrop for cryptocurrencies. However, a significant reversal candle could also form if BTC finds strong dip-buy interest between $14,000 to $12,000.
The macro backdrop is the primary concern. If global economic data continues to deteriorate, it could be a case of stocks slumping and dragging risk-on assets lower.
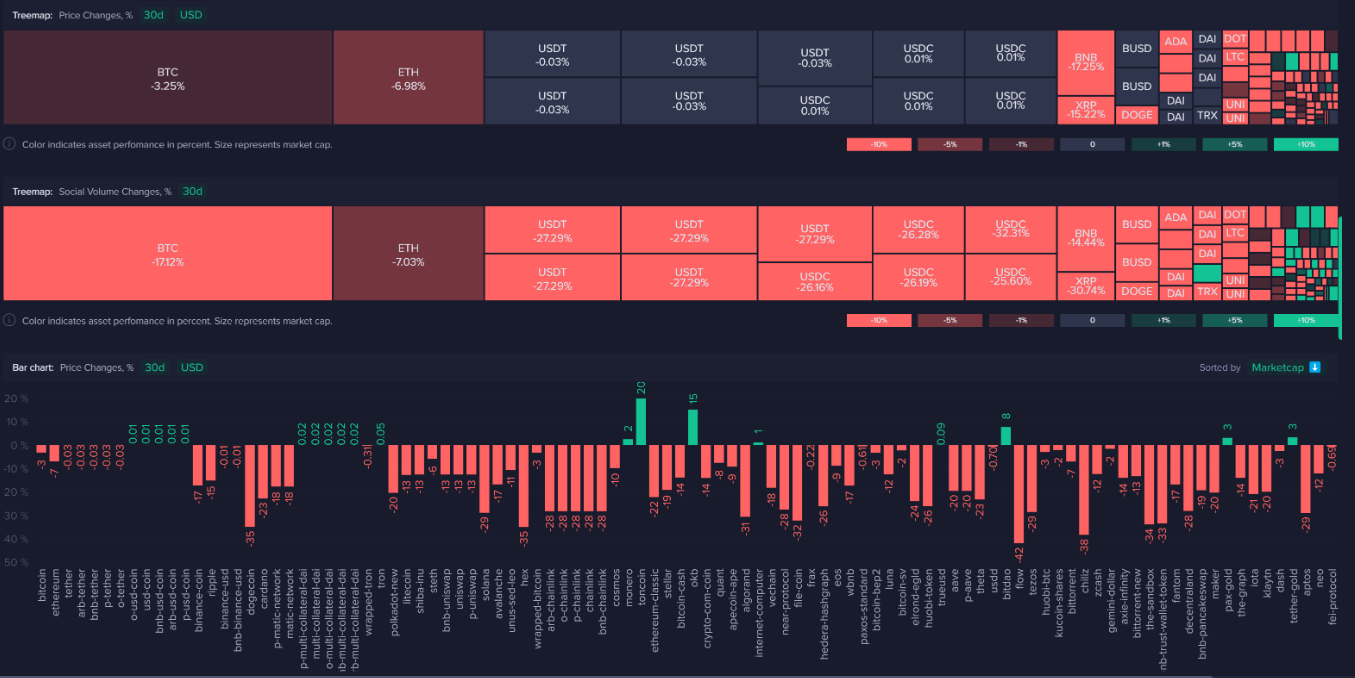
Crypto Performance in December 2022 (Source: Santiment).
Chinese Catalyst
One source that could bring positivity in 2023 is China.
Starting from January 8 next year, China will reopen its borders and lift quarantine measures, ending its around three-year-old zero Covid policy.
This change will have significant implications globally. We’re likely to see a normalcy resume, which fits with my Bitcoin 2023 Q2 move higher theory.
If all goes according to plan, China travelers will have to play catch up, and that pent-up demand will also show up in other parts of the world as Chinese spending resumes again.
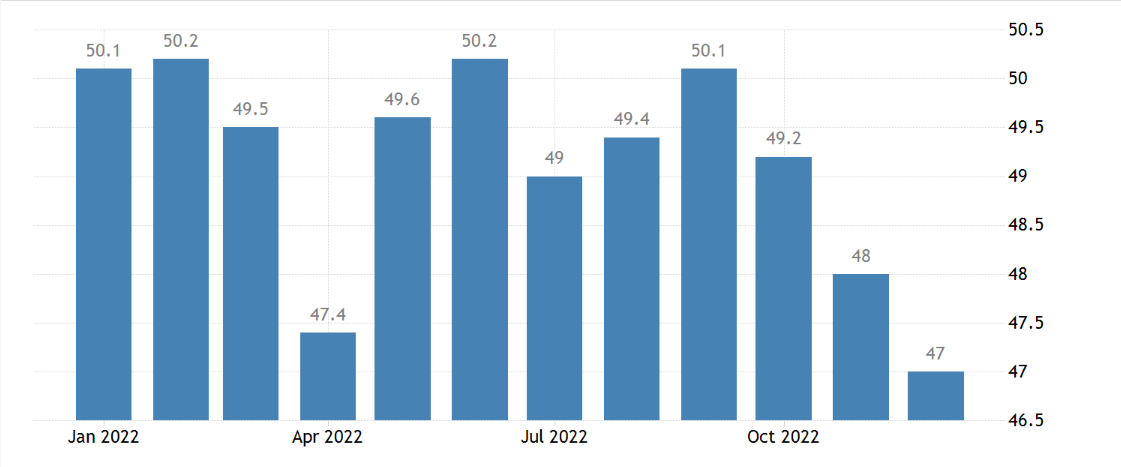
China’sChina’s Manufacturing PMI shows a decline in the country’s manufacturing closer to the end of 2022 (Source: Trading Economics).
This wave of new consumers will be good for the global economy but could also result in an uptick in inflation, depending on how consumption pans out.
The easing of shipping restrictions is also a welcome development. We are not likely to see any significant hiccups for supply chains anymore.
The most significant thing to watch is how all this impacts the inflation outlook for 2023. Demand from China citizens could add some sparkle to equity markets if the Fed slows rate hikes by this spring.
On the other hand, if the situation around Taiwan deteriorates, the market wouldn’t be optimistic.
On-chain Watch
Mid-tier whales with 1,000 to 10,000 BTC continue to sell aggressively. Until this changes, we should expect lower prices. Once they stop, we will most likely see a price reversal.
The two smallest sets of holders with 0.001 to 0.01 BTC have also been selling. The point at which they start to capitulate could also mark a bottom. It should coincide with whales pivoting from selling to buying.
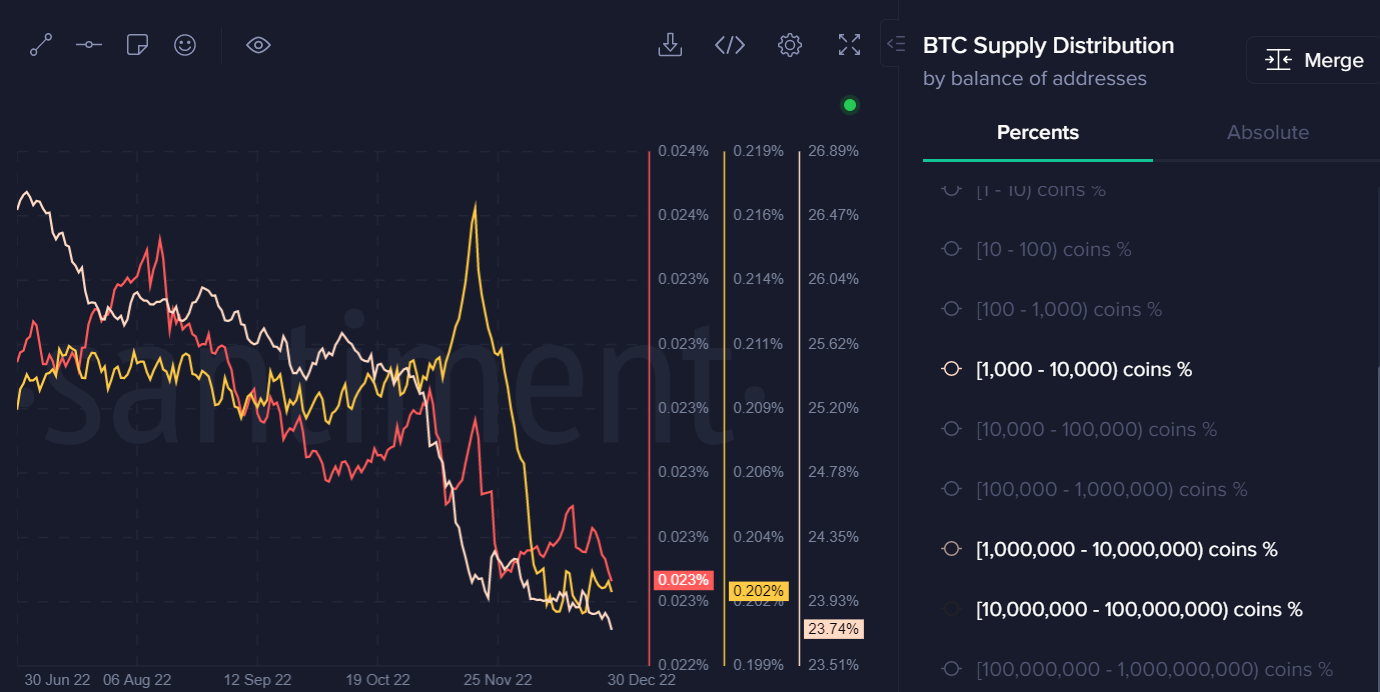
Whales are selling. (Source: Santiment).
BTC/USD: Stay Alert
Bitcoin looks bearish on the short and long-term charts, and the chances of the BTC/USD breaking under the end-of-2022 levels remain high.
A move below the $15,550 level is needed to trigger major stop losses, with the $14,600 and $14,000 levels being primary price targets.
Price patterns on the lower time frames suggest that $12,000 is reachable. However, I suspect that $14,000 or even $15,000 might be low enough, and the probability of a substantial rebound at $14,000 is very high.
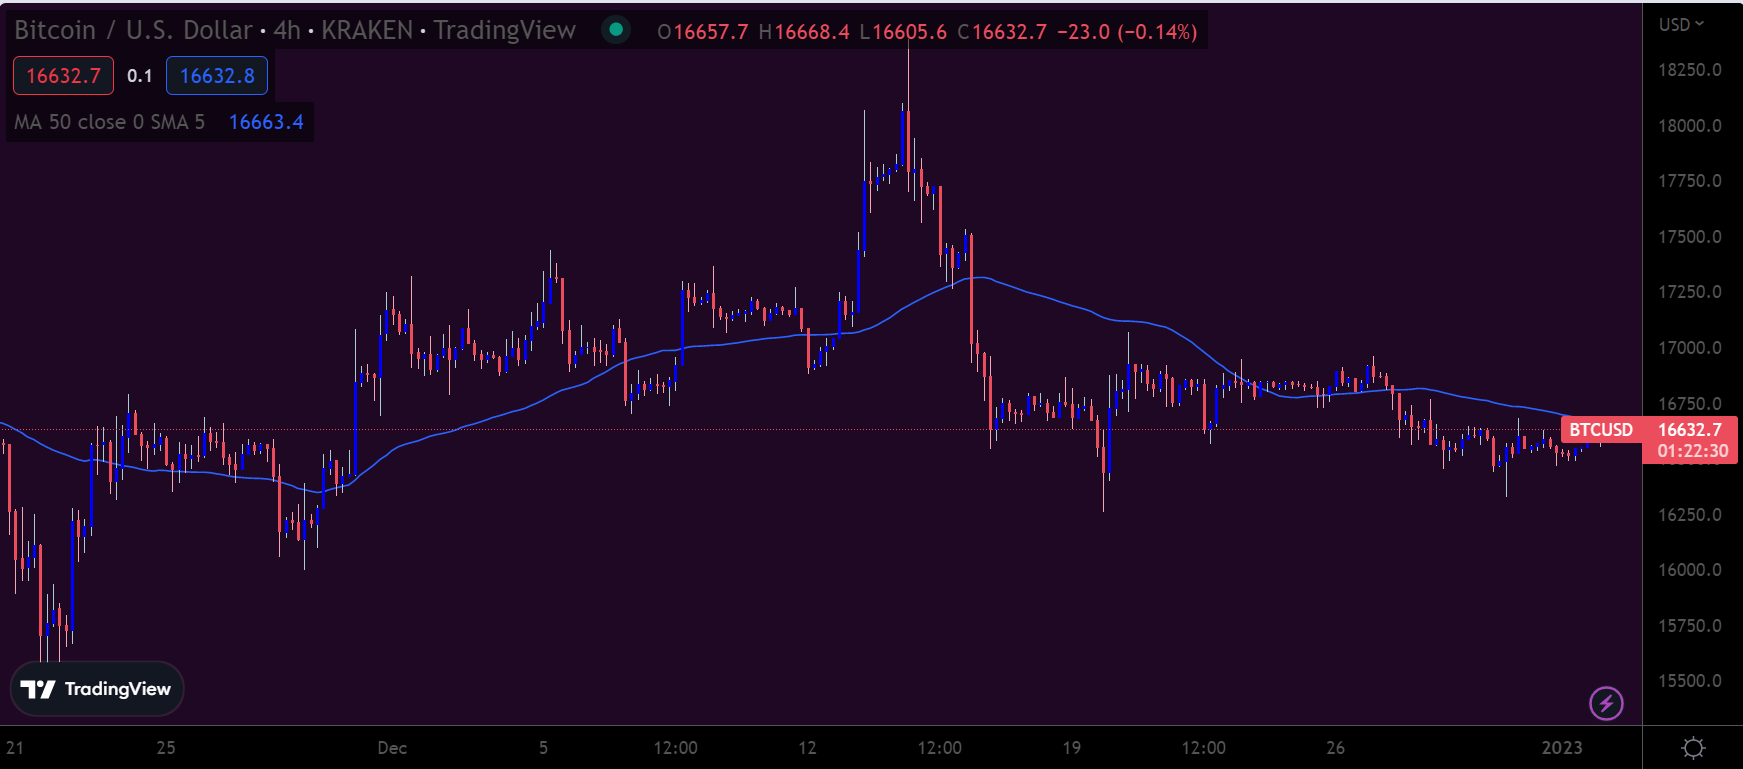
BTC/USD four-hour chart (Source: TradingView).
ETH/USD: Uncertainty
Ethereum is the one to watch this week as bulls repeatedly fail to move the ETH/USD pair away from the danger zone, and buying interest still looks minimal at current levels.
Trying to pinpoint where the bottom for Ethereum could be in 2023 is tricky. However, a lot depends on how altcoins will react if we see BTC taking another dive.
This week’s trading plan is more down while the $1,250 resistance level continues to hold. The primary targets remain $1,000 and $800. A move under $800 could cause cascading liquidations.
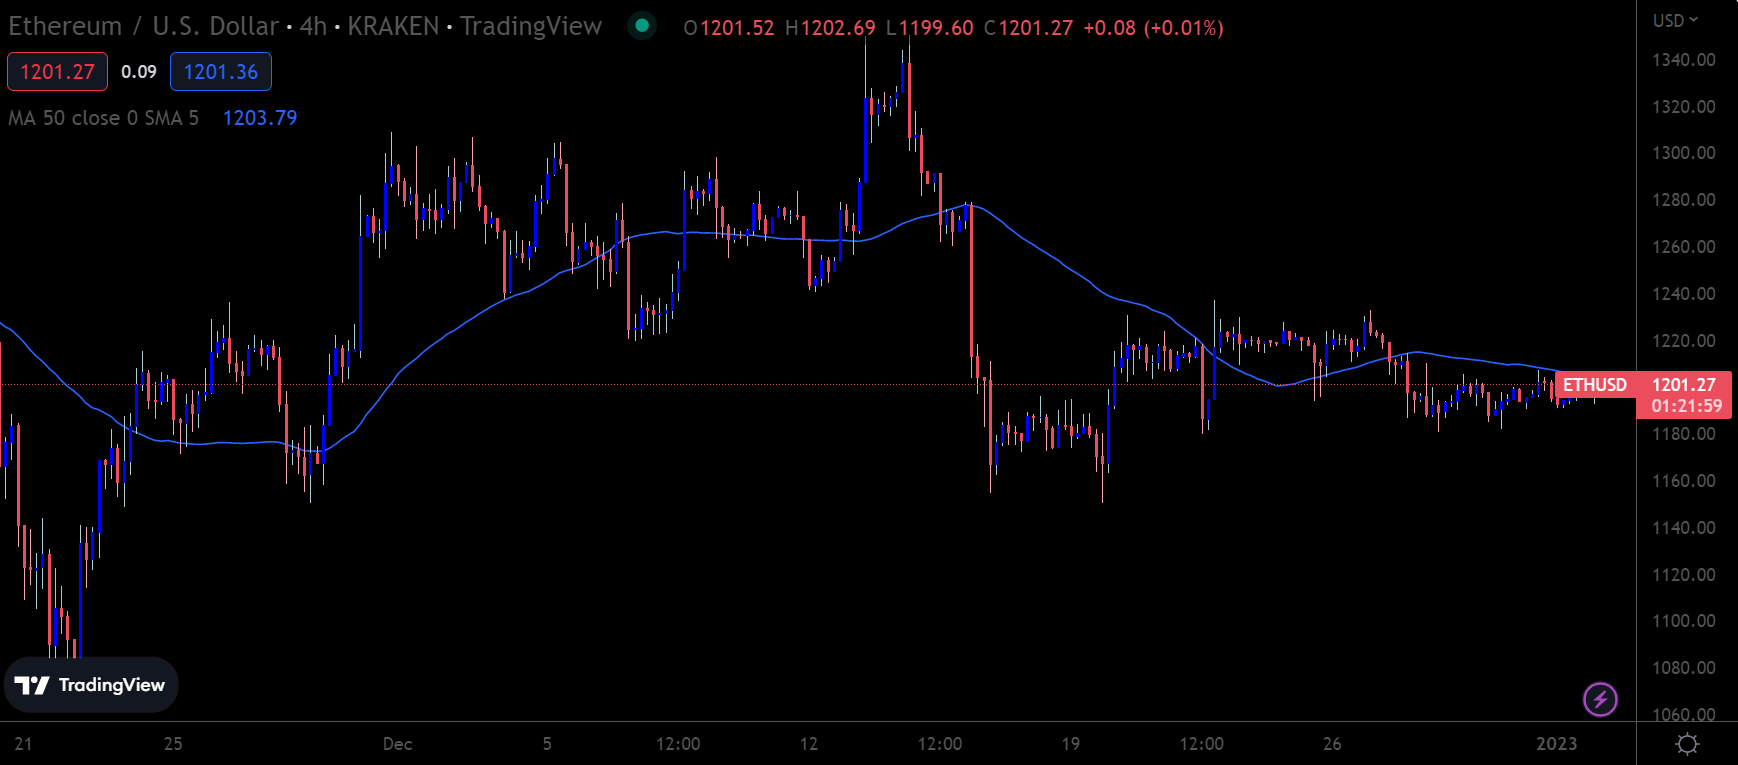
ETH/USD four-hour chart (Source: TradingView).
Market Cap Prediction
It’s worth watching how altcoins react if BTC posts another leg lower.
Bitcoin usually leads bull markets, then altcoins start rallying, eventually outpacing BTC in percentage terms. However, the end of a bear market is usually very messy for altcoins.
A plausible scenario for altcoins in 2023 would be BTC turning sharply lower again at the start of the year or first quarter and many of the top altcoins suffering almost double the percentage losses.
The crypto market cap points to $500 billion as the potential bottom. It will be interesting to see if Bitcoin losses get it there or if it will be altcoins suffering.
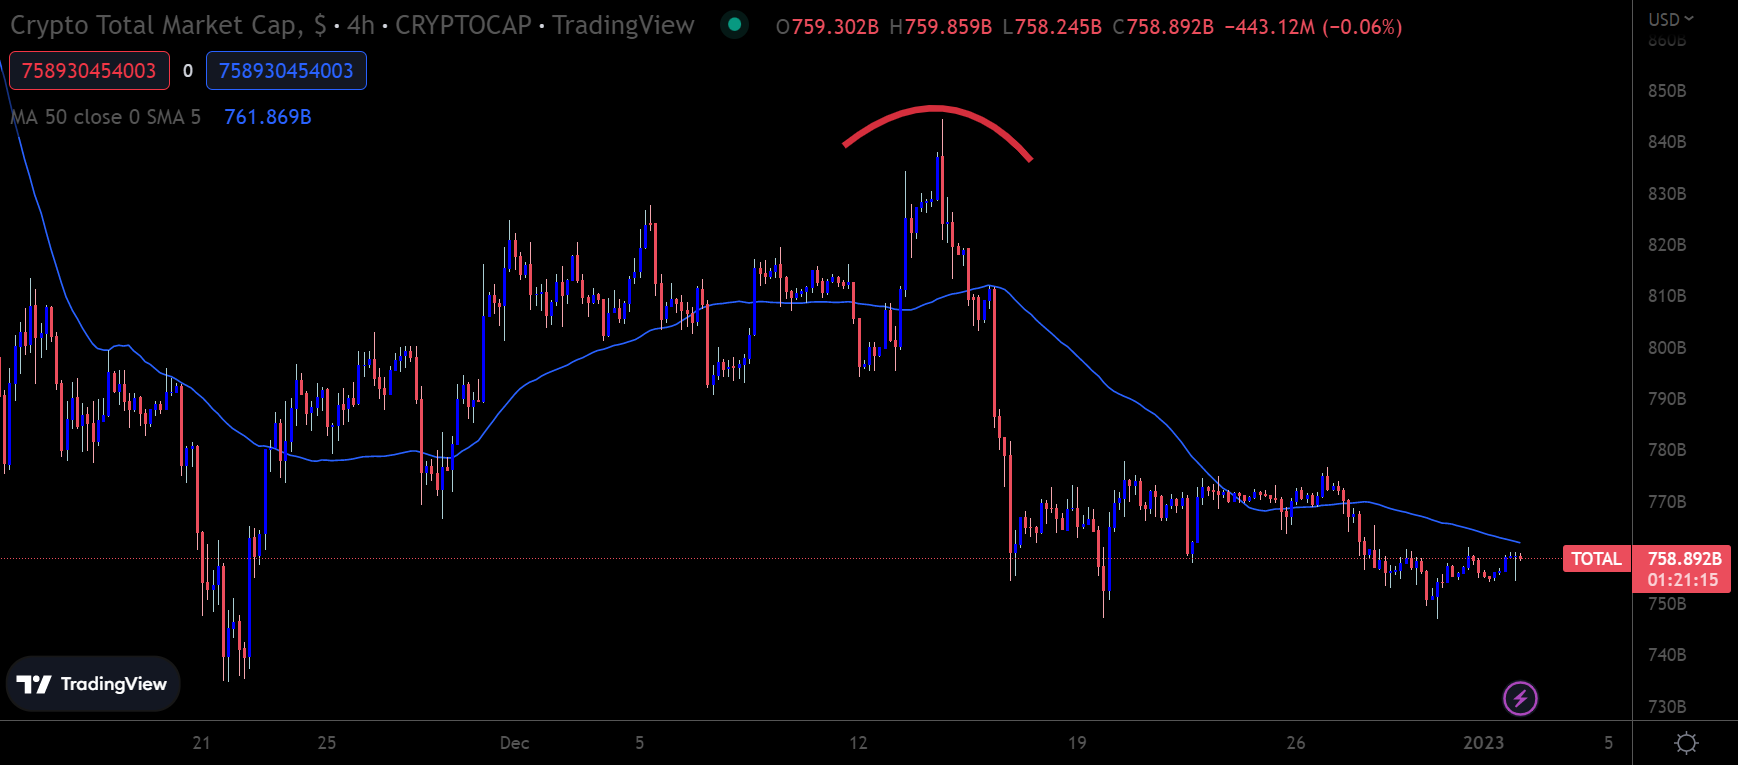
Crypto Total Market Capitalization four-hour chart (Source: TradingView).
Market Summary
I expect more losses unless we get sustainable strength above $18,500 per BTC.
It will also be interesting to see how cryptocurrencies perform if broader financial markets finally move from a risk-off to a risk-on in the second quarter of 2023. I think the chances of BTC being back at $25,000 by late spring 2023 are high.
