Correction time

Bitcoin finally corrected last week, after the Securities and Exchange Commission (SEC) charged two Kraken subsidiaries, Payward Ventures Inc and Payward Trading Ltd, with failing to properly register their staking-as-a-service program.
Kraken agreed to immediately cease offering staking services to settle the charges. Crypto industry participants are worried the SEC’s move could eventually lead to a ban on staking altogether.
On top of the Kraken news, the New York Department of Financial Services (NYDFS) is reportedly investigating stablecoin issuer Paxos, which issues Binance’s BUSD.
The full scope of the investigation is unclear, but its mere existence is already a negative factor.
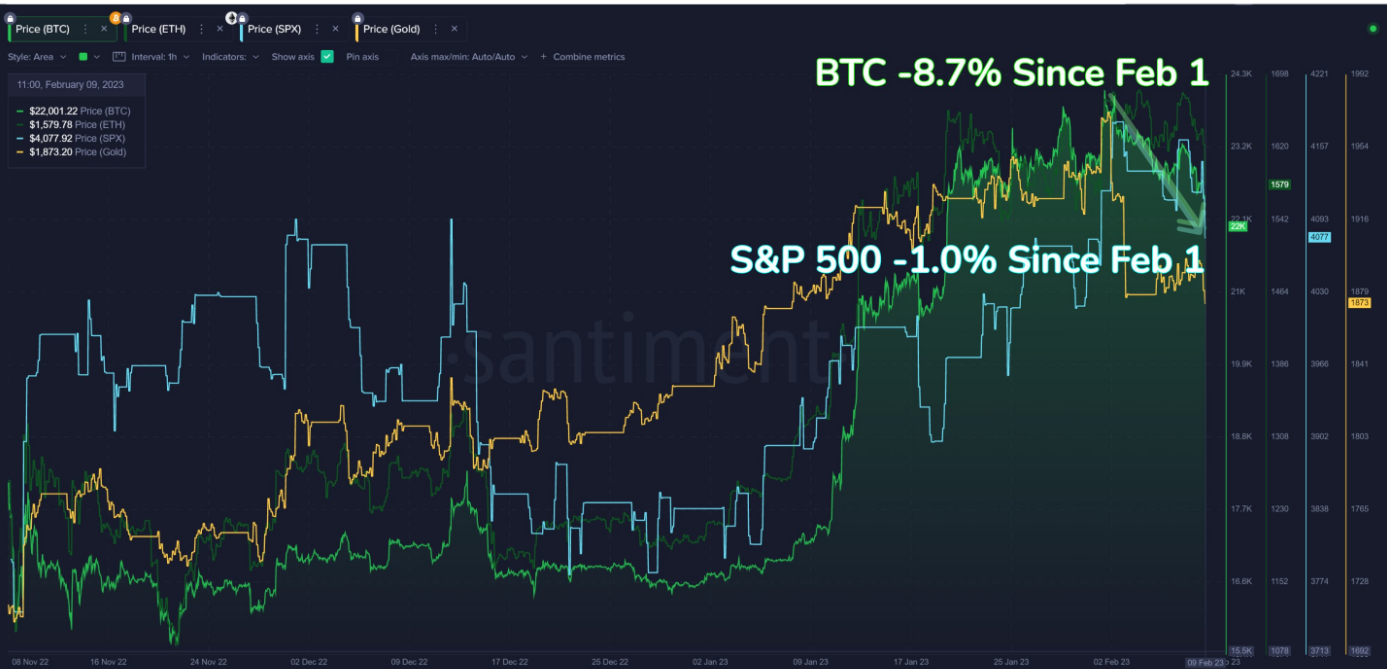
The S&P500 and the Nasdaq also went lower last week due to mixed earnings reports from a number of top U.S. companies. Meanwhile, Federal Reserve Chair Jerome Powell claimed last week that the disinflationary process had started, though he was quick to note that the Fed would turn aggressive once again if the economy ran too hot.
A number of Fed speakers also came out with more-hawkish-than-expected comments with regards to further rate hikes.
CPI Watch
This week’s U.S. CPI inflation report will likely determine crypto’s trade direction for the rest of the month.
The recent Kraken/Paxos news will likely be pushed into the rear view mirror for now, since bitcoin has become so intertwined with broader financial markets and rate tracking.
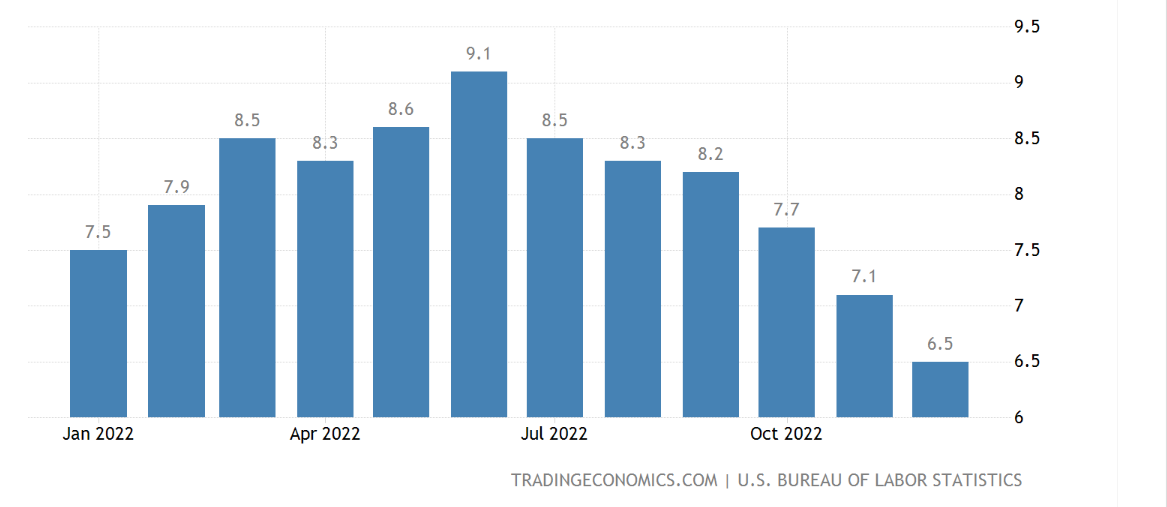
Expectations are mixed for the January CPI report: the monthly CPI is expected to tick higher, by around 0.5%, while year-on-year CPI is tipped to come in at around 5.2%.
The last CPI inflation revisions came out for the December print: they showed that monthly inflation had actually increased by +0.1% (as opposed to the previous number, -0.1%).
Should the monthly CPI report come in higher, I would expect to see bitcoin move towards the $20,000 support zone for a major trend test of its 200-day moving average.
If CPI inflation comes in lower than expected on both a monthly and annual basis, we could probably see BTC move back towards the $22,700 to $23,500 area—for starters.
On-Chain Watch
On-chain activity on Bitcoin has been extremely muted over the past few days, which is curious considering the strong price correction BTC and the rest of the crypto market underwent.
However, two metrics have been fascinating to watch. Firstly, Supply Distribution data, which tracks the behavior of specific subsets of BTC holders (these subsets are sorted out by address balance).
The most interesting part of BTC Supply Distribution chart below is the rise of minions, the smallest subset of holders, who hold 0 to 0.001 BTC.
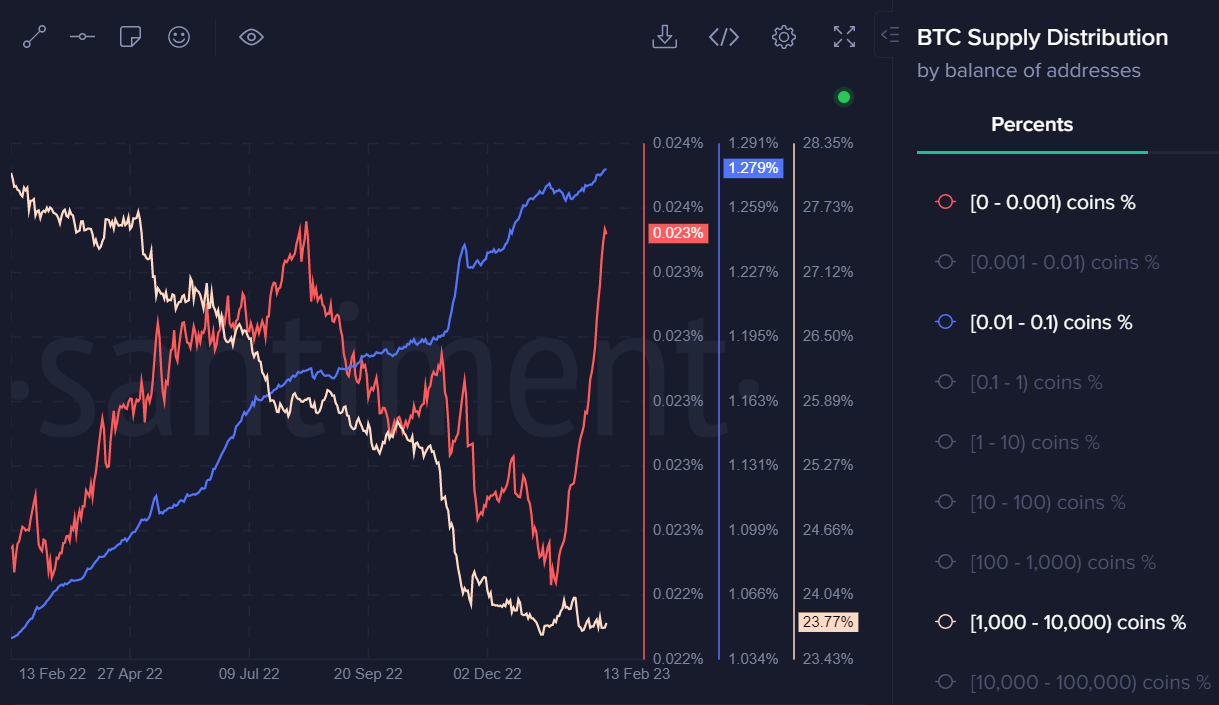
Source: Santiment.
As you can see, they began purchasing bitcoin right at the top of the range, as well as around the $22,000 and even $23,000 areas.
Since we typically look to fade retail behavior, this could be a particularly strong contrarian signal. We could see BTC actually starting to crash over the coming weeks.
Secondly, Bitcoin’s Stock-To-Flow ratio recorded its largest spike ever last week.
I am still uncertain as to what caused this spike. But historically, such spikes foreshadow massive price swings.
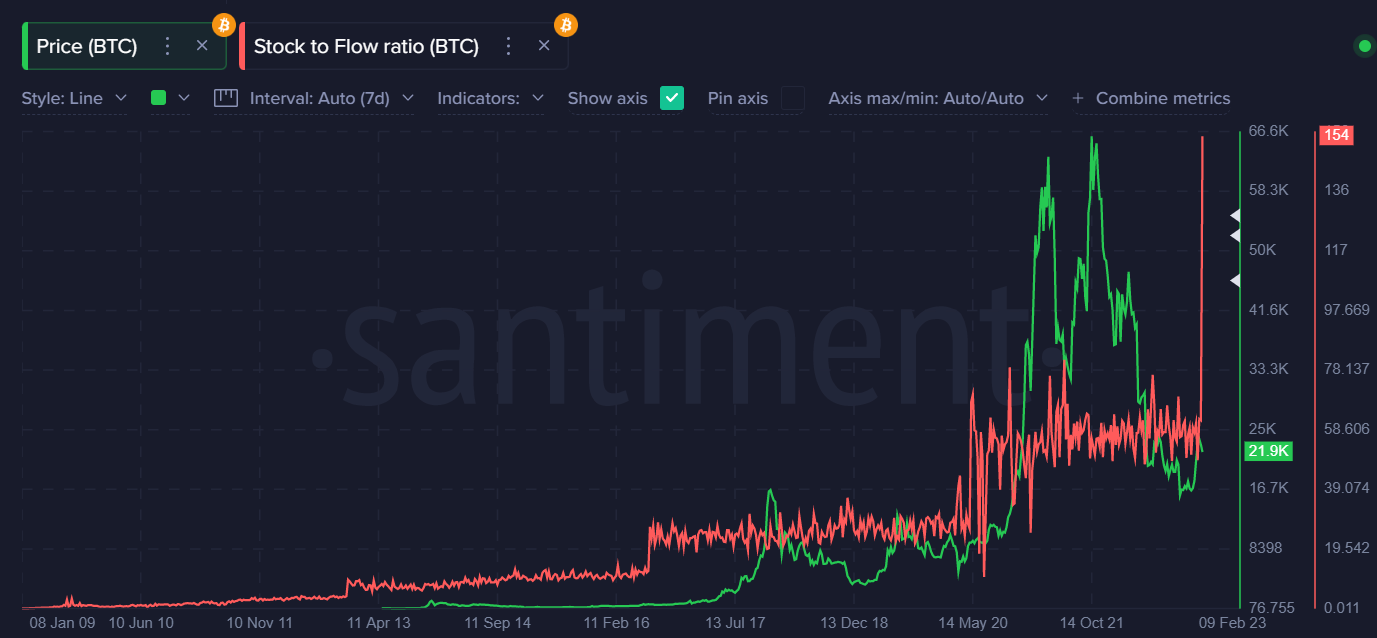
Source: Santiment.
Bitcoin Watch
Bitcoin has finally gone lower after soaring above the $23,000 area over recent weeks.
The direction of trade this week will depend on whether the CPI report continues to trend lower, or whether it flips in the opposite direction and starts to derail deflationary trades.
BTC may have a date with destiny around the $20,000 level if the drop continues. This would probably be where the smart money would look to add, or at least wait and see whether a breakdown happens.
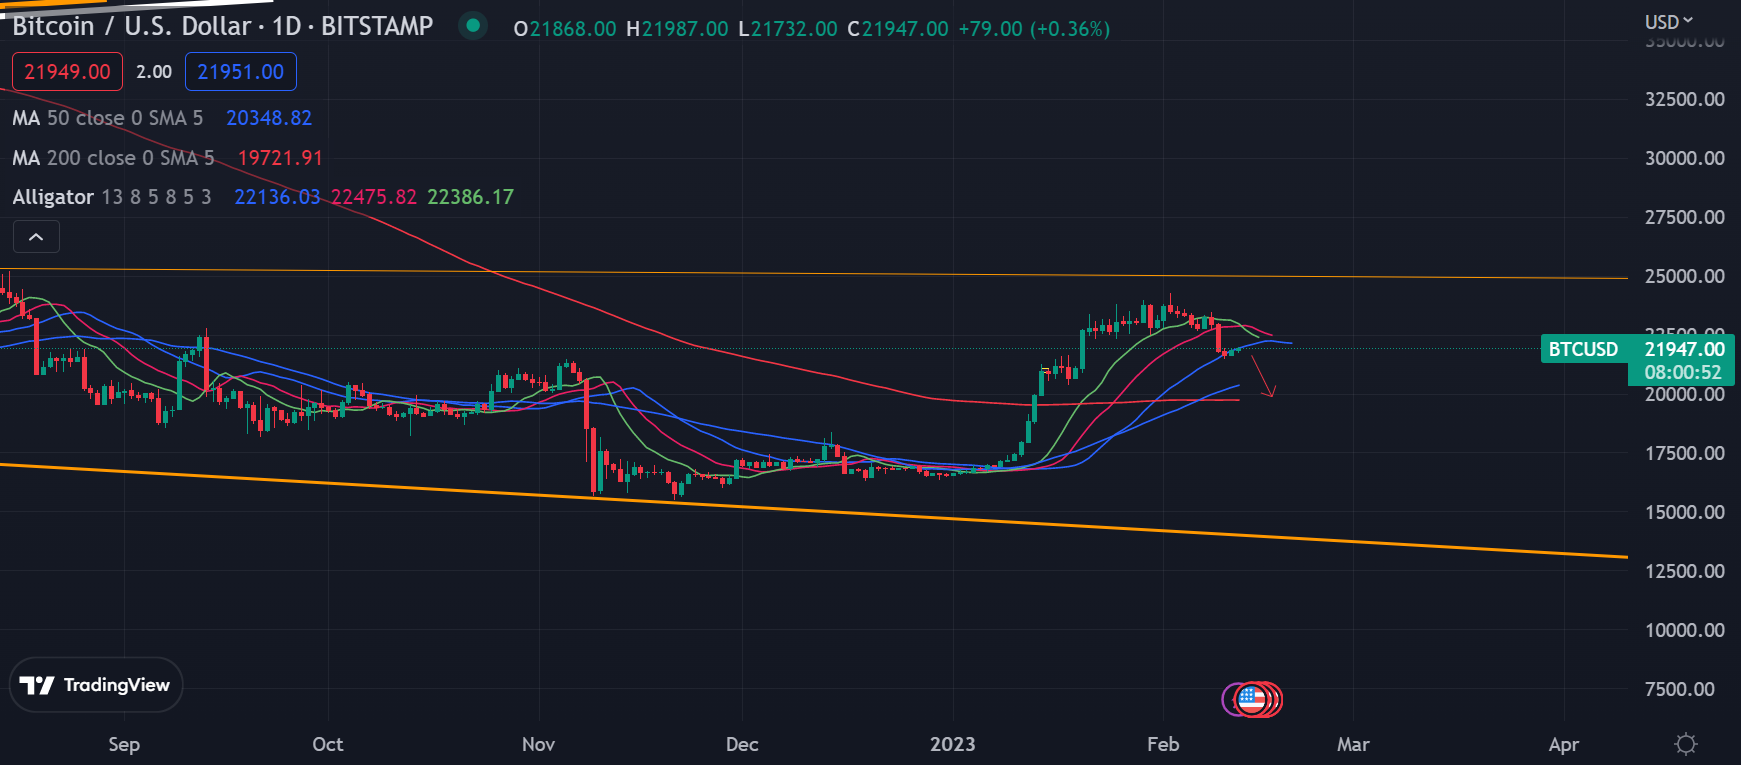
BTC/USD four-hour chart (Source: TradingView).
Ether Pressured
Ether is obviously in a similar position as bitcoin this week, meaning that the CPI report is going to impact how ETH/USD trades.
Technically, a huge rising channel breakout is underway, at least as long as price keeps trading below the $1,560 level. The size of the channel indicates a drop towards the $1,420 area could be in the cards.
This is interesting, as the $1,420 area is a huge market pivot for ETH, and a former key swing high from 2018. A break under this area could open up the floodgates.
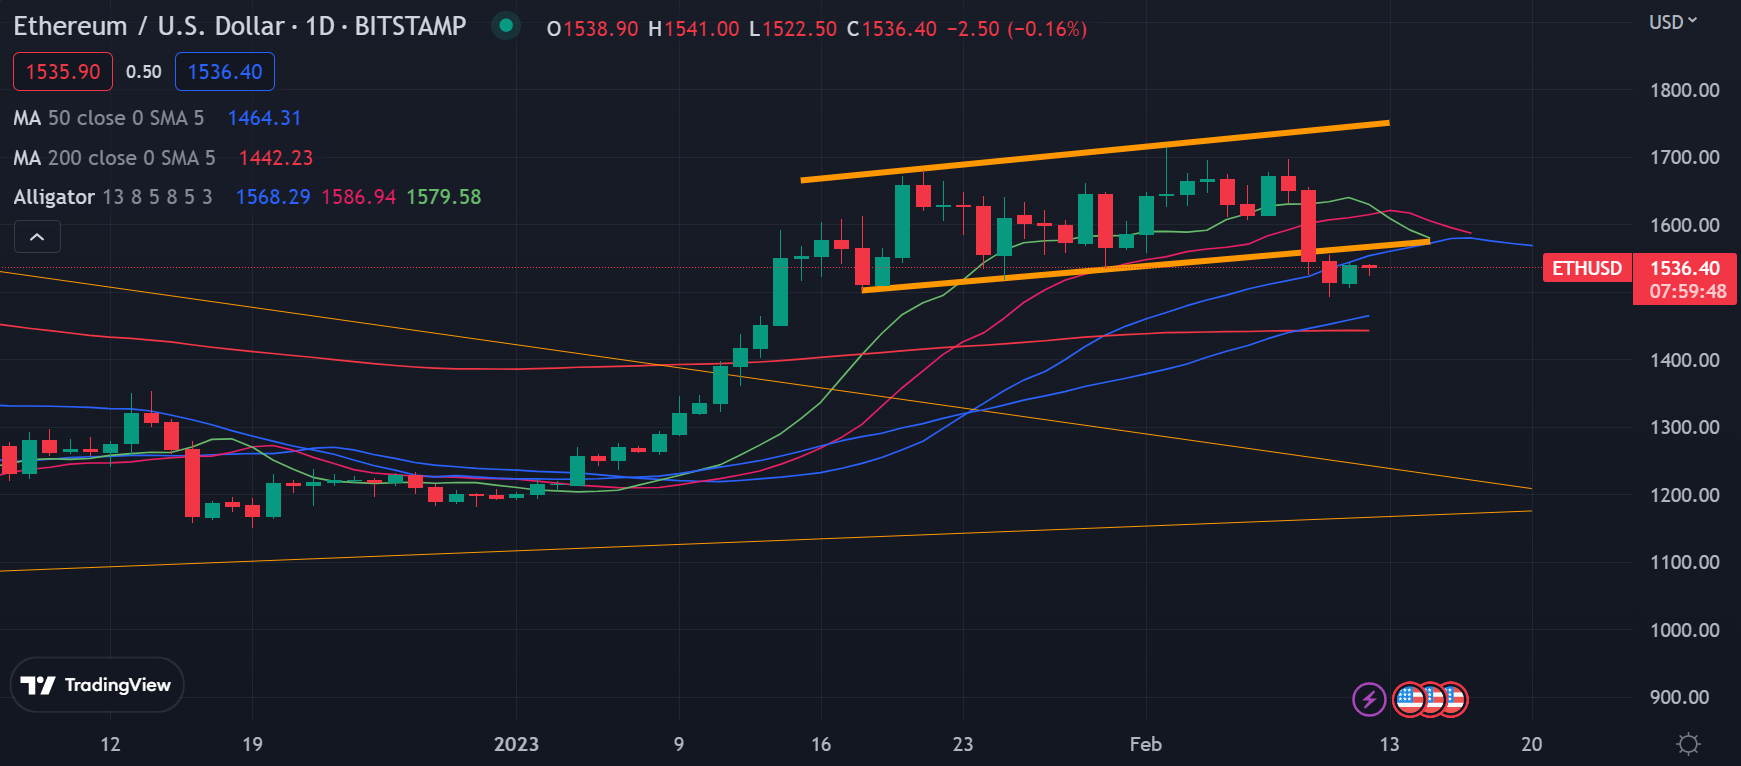
ETH/USD four-hour chart (Source: TradingView).
MATIC Change
MATIC has a nasty double-top playing out across the lower time frames. If the market turns lower this week I would expect MATIC to trade below $1.00.
From a longer term perspective, the MATIC/USD pair could potentially head towards $0.80 if the market takes another serious leg down.
On the other hand, if BTC and ETH hit new highs, then I would expect MATIC to eventually tag the $1.50 level.
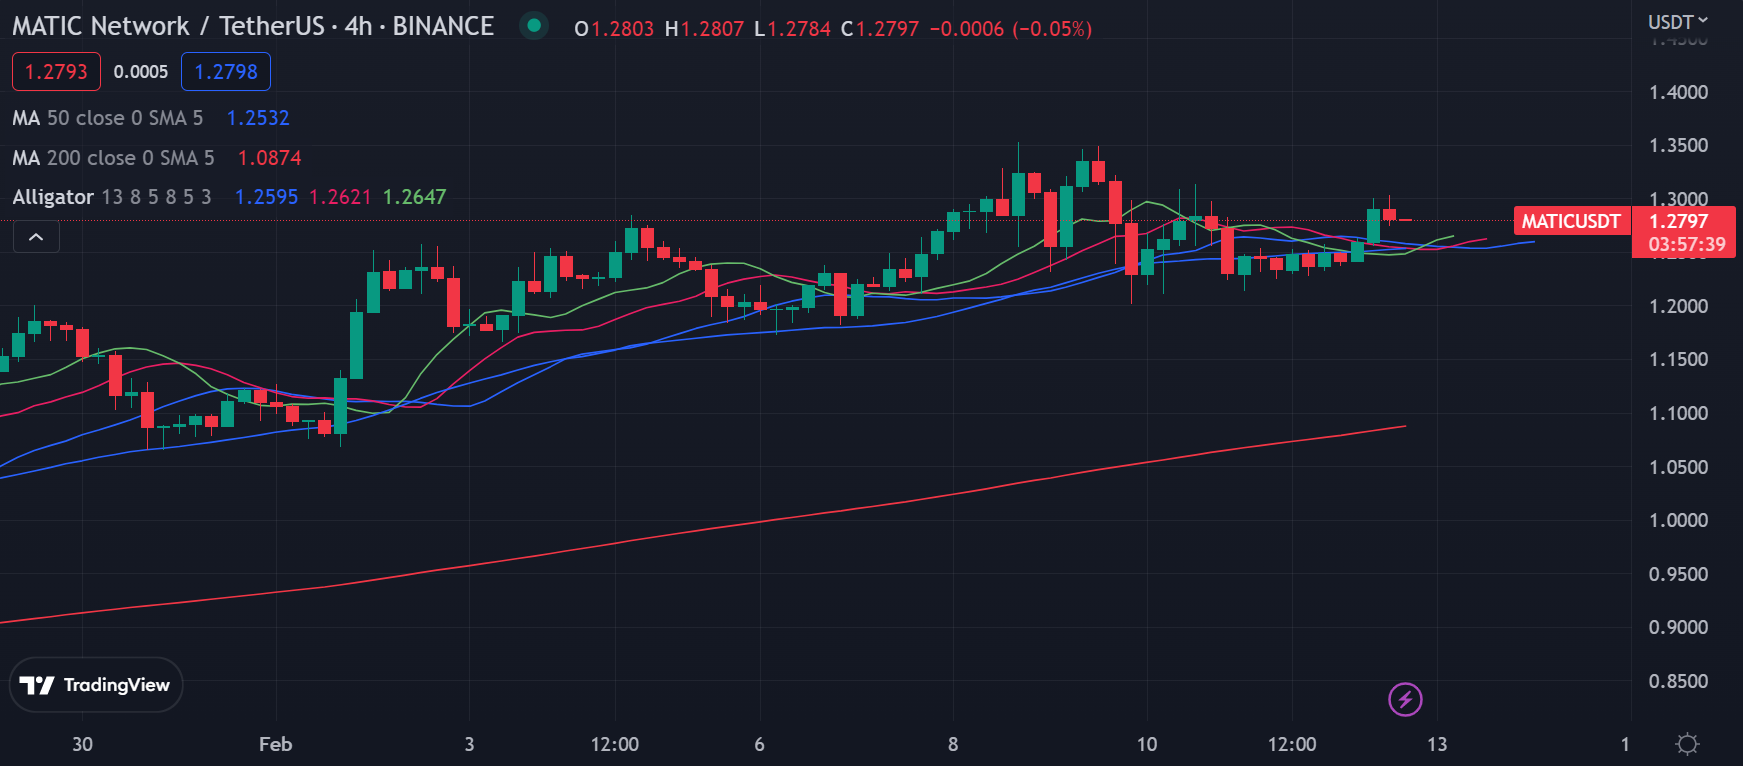
MATIC/USD four-hour chart (Source: TradingView).
In Summary
Bitcoin has benefitted from the idea that inflation is falling and that the Fed is going to stop its rate hike cycle at some point over the coming months.
Any flipping of this narrative could be hugely detrimental to BTC and other cryptocurrencies’ early-year gains. This makes this week’s CPI report very important.
Concerning aspects of the rally have included the lack of volume, and the lack of mid-tier whale participation. Additionally, BTC minions started loading up around year-highs, which is a big yellow flag.
The recent spike in Bitcoin’s Stock-To-Flow ratio should also not be ignored as it could signal that a large one-way directional move is coming.
