Bitcoin Hits $28,0000

Bitcoin incurred a bout of extreme volatility last week, as the first cryptocurrency corrected lower and then posted blockbuster gains towards the $28,000 level over the quiet Christmas Holiday weekend.
BTC started the week on the backfoot as market fears over a new mutant strain of COVID-19 caused the top cryptocurrency to sell-off towards the $21,800 support area.
Crypto traders were left scratching their heads, as Bitcoin failed to rally over news that the U.S. congress had finally agreed on a new $900 billion stimulus package.
Bitcoin quickly recovered, and exploded towards the $25,000 level on Christmas Eve. The breakout move higher eventually found resistance from just above the $28,000 level, which created the largest ever weekend price gap on the CME futures chart.
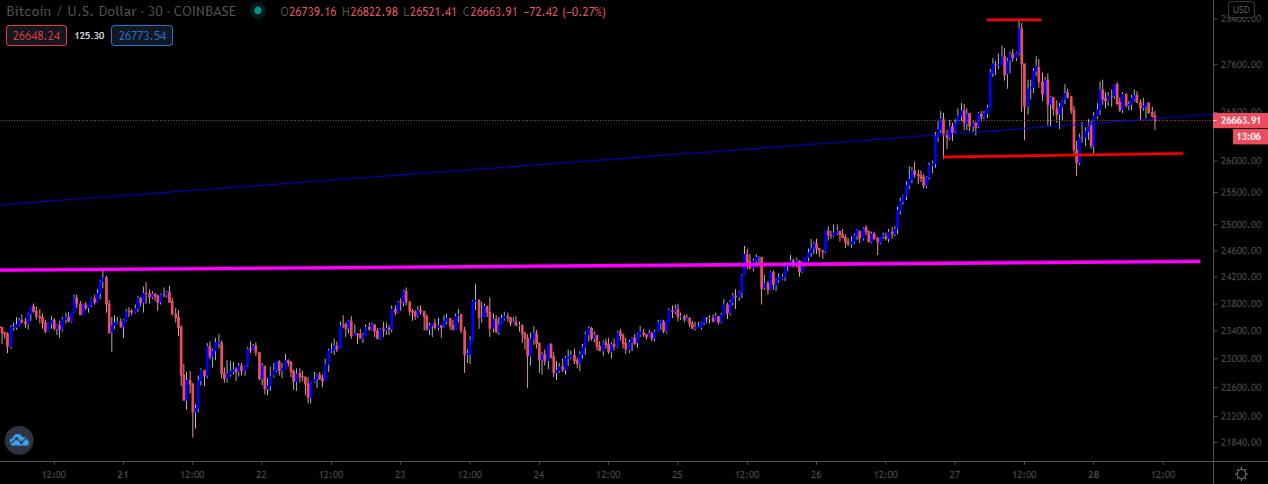
BTC/USD 30-Minute Chart
Source: Tradingview
Grayscale Bitcoin Trust also performed it’s largest ever single day purchase of BTC last week. The company reportedly bought a record 12,319 Bitcoins, underscoring the appetite for BTC above $20,000.
Bitcoin also received a nice boost, as SkyBridge Capital announced that they were going to be launching a new $25 million Bitcoin fund in 2021.
Additionally, news that a pro-crypto SEC Chairman was appointed to replace the outgoing Jay Clayto was seen as being bullish for Bitcoin.
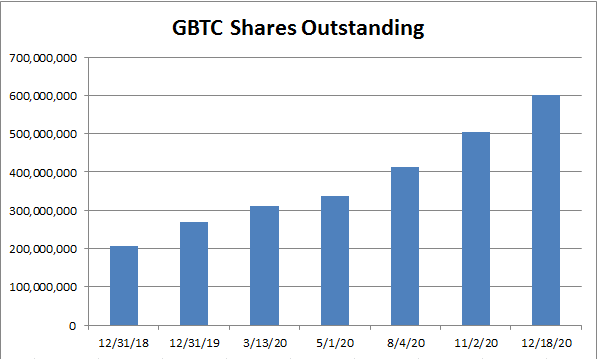
GBTC Quarterly Report
Source: SeekingAlpha
On-chain data continued to paint a bullish price picture for BTC, as major exchanges recorded an outflow of 16,000 BTC in one single day, adding to fears of a growing supply shortage.
Whale activity also intensified last week, as data from on-chain behavioral platform Santiment recorded a number of huge spikes in it’s Token Age Consumed metric.
Data from crypto analytics platform Glassnode also showed that a record amount of people now own at least one whole Bitcoin.
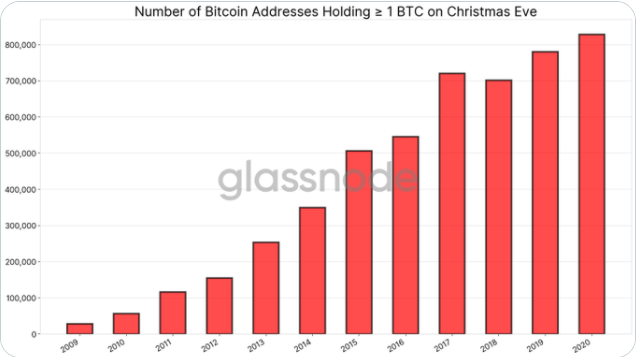
Source: Bybt.com
The crypto market struck a slightly more cautious tone as Christmas Day approached, following news that the SEC was launching a lawsuit against Ripple.
Many exchanges chose to delist XRP, which further exacerbated selling pressure towards the third-largest cryptocurrency.
The Crypto Fear and Greed Index remained in a state of “extreme greed”, although it did manage to break it’s all-time high reading, of 95 points.
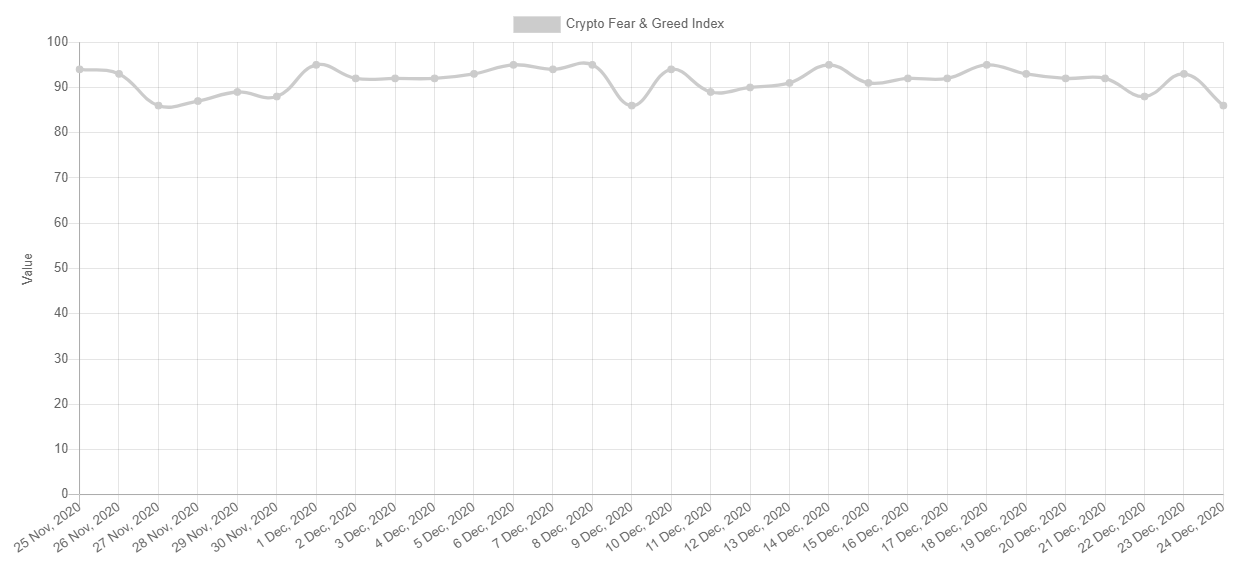
Source: Alternative.me
The crypto total market capitalization rallied to a new multi-year high last week, as Bitcoin and Ethereum continued their respective multi-week advances.
Ripple dominated the news in the altcoin space, as the XRP/USD pair traded down nearly fifty percent on the week at one stage. Chainlink, and Hegic also came under heavy downside pressure last week.
During my upcoming webinar I will be looking at Cup and Handle Patterns, and I will also be charting Bitcoin (BTC), Ethereum (ETH), Ripple (XRP), and Polkadot (DOT).
The Week Ahead
Bitcoin did the unexpected right before Xmas day last week, and broke above the $24,300 level and has not really looked back since. Myself, and many others were not expecting BTC to be this lively over the Xmas holiday period.
It is difficult to put a finger on what drove the Xmas rally in Bitcoin. I can’t imagine institutions were open on Christmas Day pushing BTC higher. The idea of massive retail volumes pushing BTC up on Xmas day doesn’t cut it with me either. Could it be the payment service that never sleeps, PayPal, was scoping up BTC while others slept. Quite possibly.
For the first-time I can remember, I am struggling to find meaningful resistance for Bitcoin, with only $30,000 and $36,000 highlighted as strong upside targets BTC could gravitate towards.
I do remember a few months ago seeing BTC options bets for January for $34,000 and $36,000. These guys must be feeling good at the moment, considering BTC was trading at nearly $10,000 when they placed these bets.
BTC has come so far so fast, and the price action is still very bullish, which is quite a statement considering the $10,000 advance we have seen in a little over one-week.
On-chain data towards BTC is also still rampantly bullish, with the supply shortage getting worse, so at the moment traders and investors have few reasons to be bearish towards Bitcoin.
In terms of risk events this week crypto traders obviously have the coming U.S. wallet regulations to worry about, as well of the threat of some Mt.Gox holders selling their BTC. However unlikely it may see.
End of year profit taking is a very real phenomenon to worry about. Anyone who observes a BTC price chart towards December 2017 to January 2018 can see this can be a wild month. Meaning that BTC could trade in a huge range over the next few weeks. But again, with the market expecting BTC to march higher still, I don’t see a big exodus from BTC happening at this current moment without a big fundamental shift.
Personally, I’d love to see a retest of the $19,900 to $19,600 support area. My gut feeling is that this important technical region could well be a spot to look for BTC longs in January or February next year. If the mentioned area is broken, watch out below, because things could get nasty in a hurry.
Very little to get excited about on the economic calendar this week. U.S. political twists and turns are likely to dominate the news, and could influence the price of BTC in the short-term.
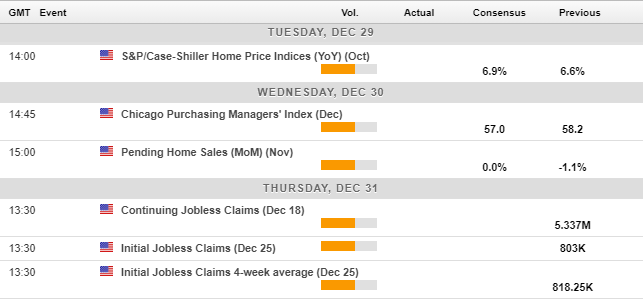
Economic Calendar
Source: Forexlive
The technicals surrounding Bitcoin (BTC) look fairly mixed in the short-term, and a head and shoulders pattern could form if we see sustained weakness under the highs of last week.
According to the overall size of the pattern, BTC could drop towards the $24,300 to $24,000 area if we see the $26,300 support level breached with some conviction this week.
In reality, bulls are likely to be waiting below the $25,000 area, in anticipation of a coming run back towards $26,000, $28,000 and possibly $30,000 levels.
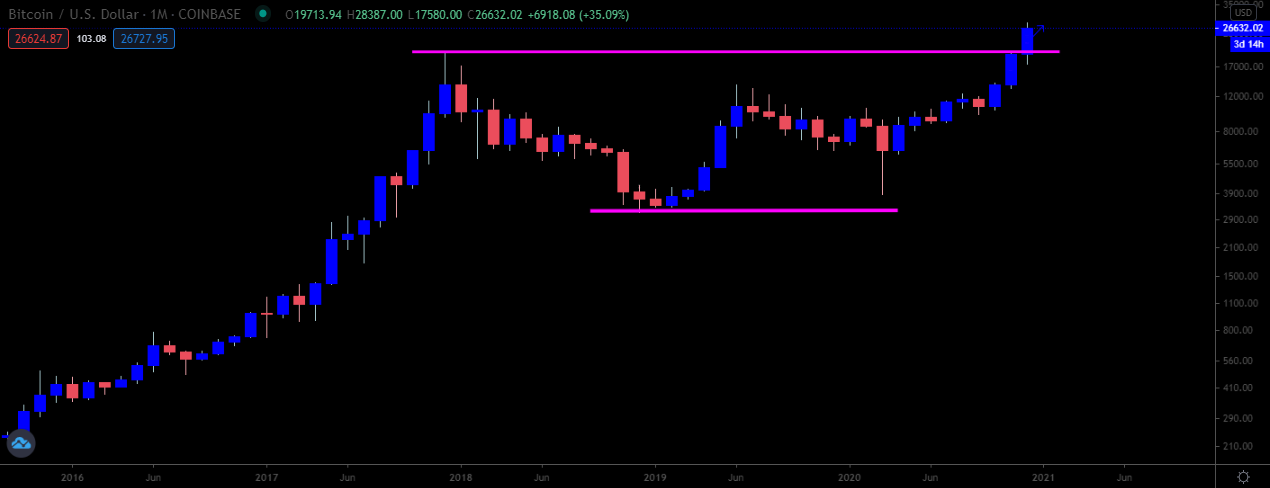
Looking at the overall, and much bigger picture for BTC on the monthly time frame, a huge inverted head and shoulders pattern was activated when Bitcoin finally cracked the $20,000 resistance barrier.
This pattern is fairly scary in its overall size, and is projecting a move towards the $36,000 level. As I said earlier, those bets on the options market for BTC reaching $34,000 in January look pretty good right now.
A monthly price close below the $19,900 level is required to change the technicals for BTC right, however unrealistic this sounds right now, it is crypto remember.
BTC/USD Daily Chart
Source: Tradingview
Ethereum (ETH) Ethereum is in fine form as we start the new trading week, and looks set to challenge towards the $800.00 level in fairly rapid fashion.
As I said last week “traders who are bullish towards ETH/USD may attempt buys around the $570.00 area, so do be careful shorting around this region”. And that is what we saw.
In terms of this week, and what has happened to Ripple since we last spoke, Ethereum could be going a lot higher than I previously thought.
Once again, traders that are bullish, may try their luck around the $680.00 region, as this is now former key resistance turned key support on the lower time frame charts.
This scenario makes a lot of sense, and in reality, this could be a safe spot to pick-up Ethereum at a reasonable level before we start to see big psychological levels taken out, like $800.00 and $900.00.
It is possible that ETH could tag $1,000. According to higher time frame analysis, $1,010 is a possible upside target if the $840.00 is broken.
Looking at the more pessimistic case, a heavy rejection from $770.00 and subsequent drop below $670.00 may cause traders to become more cautious, and they may look for ETH buys closer to the $500.00 area. However unlikely this scenario is, it’s always best to look at both sides of the trade, so not to get too biased.
Negative MACD price divergence is also present on the charts down to the mentioned targets, although at this current moment in time the fundamentals are simply outweighing the technicals.
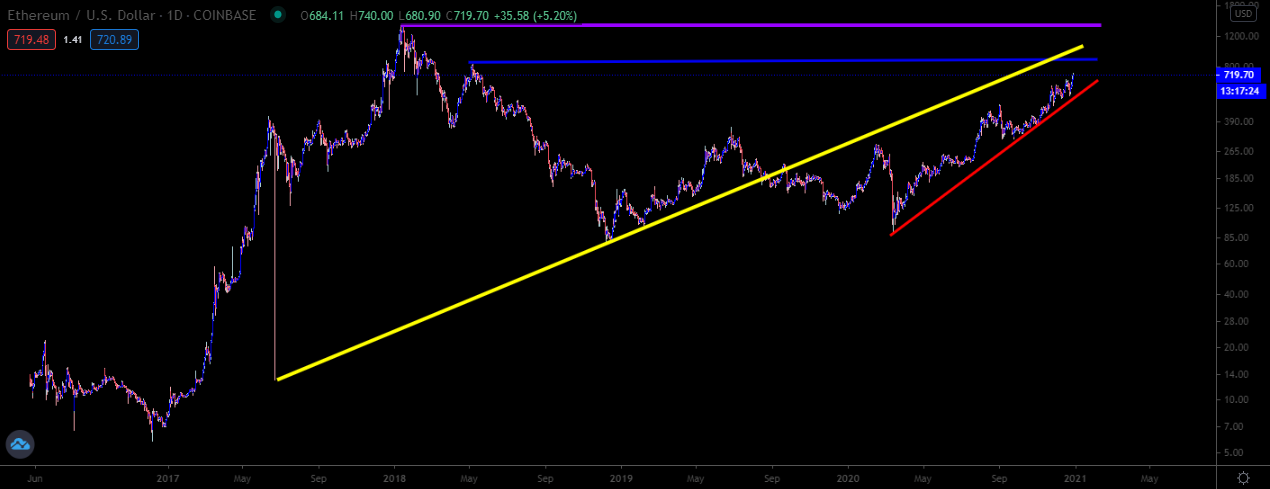
ETH/USD Daily Chart
Source: Tradingview
