September 14 Crypto Market Roundup

Bitcoin (BTC) showed tentative signs of starting a much-anticipated recovery last week, as sellers failed to gain momentum below the psychological $10,000 level.
The pioneer cryptocurrency found strong weekly support from just above the $9,800 level, and then staged a notably slow rebound towards the $10,570 resistance area.
Traders noted that seasonality could also be in play, as historical data shows that September is Bitcoin’s worst performing month, with the BTC/USD pair proving an average return of -7%.
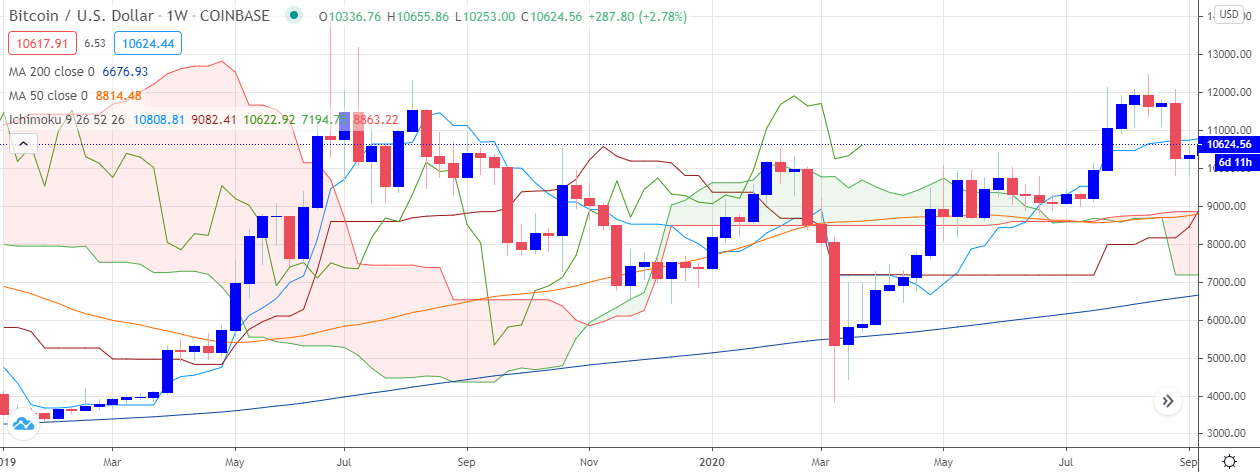
BTCUSD Weekly Chart
Source: Tradingview
Muted downside momentum, a rising hash rate, positive on-chain data, and uncertainty towards the recent rebound in the U.S. dollar index all aided in the rebound towards the $10,570 area.
The BTC/USD pair also shared an increasing price correlation with U.S. equity markets and gold last week. Data revealed that Bitcoin’s correlation with the S&P 500 was approaching all-time highs.
Bitcoin’s network hash rate advanced to a new all-time high this week, further underpinning the case for higher price, as miners appeared unfazed by recent decline.
On-chain data from crypto behaviour analytics company, Santiment, showed a number of optimistic signs, and pointed to waning selling pressure towards BTC.
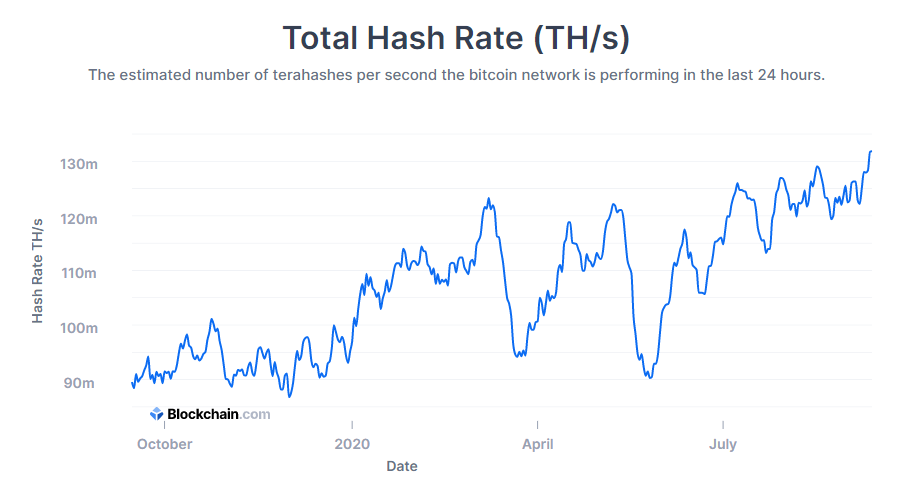
BTC Hash Rate
Source: Blockchain.com
This week’s Commitment of Traders report from the CME revealed that open interest for Bitcoin had seen a significant decline since the recent reversal below towards the $9,800 level.
The CoT report also showed that institutions were starting to increase their exposure towards BTC long positions in the futures markets.
Positioning data amongst the top performing traders on the cryptocurrency platform OKEx showed an increased number of long positioning entering into the market.
The Crypto Fear and Greed Index showed that traders had moved back into a state of “fear”. The index traded back at levels not seen since Bitcoin launched it’s breakout rally in late-July of this year.
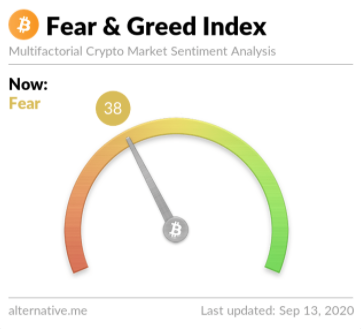
Source: Alternative.me
The total market capitalization of the cryptocurrency traded between the $297 to $330 levels, as Bitcoin and a number of top coins started to gather upside traction.
Spot volumes for the total market capitalization continued on an upward trajectory, and traded at levels not seen since April this year.
Data showed a large amount of whale activity surrounding Ethereum and Ripple last week. While the trading action surrounding Sushi (SUSHI) and Tron (TRX) hit the headlines in the DeFi and altcoin space.
During my upcoming webinar, I will be taking a look at Synthetix Network (SNX,) Yearn Finance (YFI), Aave (Lend), and Bitcoin.
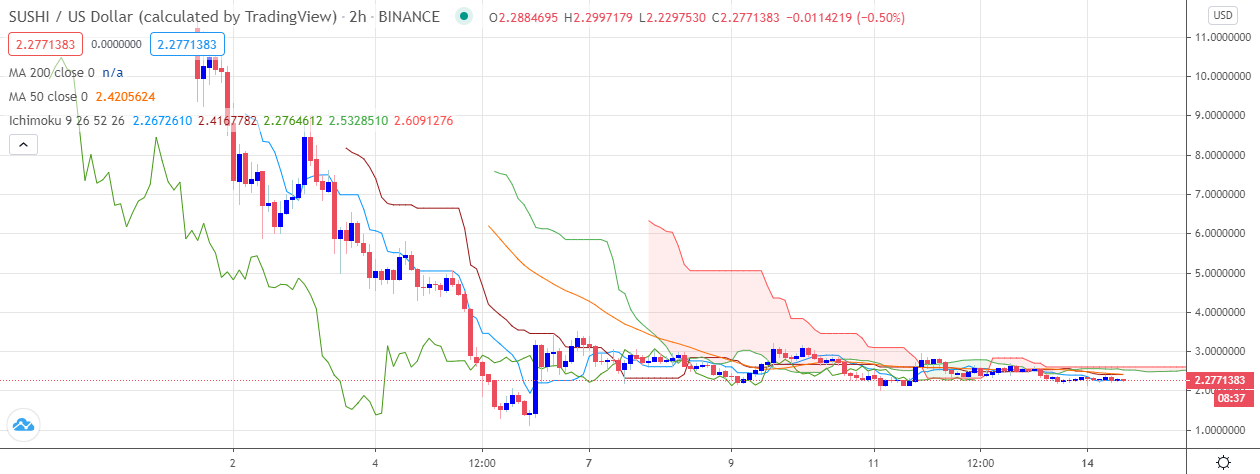
Source: Tradingview
The Week Ahead
If the $10,000 support zone continues to hold Bitcoin certainly has the potential to start pushing higher again this week, and even more so if we see the S&P 500 holding the 3,300 support level, and the U.S. dollar index once again losing upside traction.
This week I believe we have three key dynamics to watch, which could shape the potential recovery in the cryptocurrency.
Firstly, markets are likely to be in a cautious mood ahead of Wednesday’ FOMC rate decision. No real change is expected by economists, although FOMC members will be offering their economic projections, and FED Chair Powell is expected to elaborate and receive questions about his Jackson Hole speech.
Secondly, we have the ongoing speculation that the U.S. senate will soon be approving a new coronavirus stimulus bill, with $1,200 cheques attached, despite the ongoing stalemate in between Democrats and Republicans.
If a second bill is approved, traders are likely to sell the greenback, buy Bitcoin, gold, and indeed tech stocks. If the stalemate continues, with no real signs of progress ahead of the election, it may be supportive for the U.S. dollar. Watch out for ongoing news about this over the coming days and weeks, and perhaps even buy the rumor and sell the fact coming into play.
Thirdly, we have the big wild card, Brexit. The chances of UK-EU negotiations falling apart are high at this current moment. If we continue to see downbeat news coming from negotiations, it could spill over into a global equity market sell-off, which could ofcourse impact Bitcoin.
Another point to raise is that the correlation between Bitcoin and the S&P 500 has become increasingly apparent over recent weeks, so therefore I am watching the index very closely, and giving extra attention to daily closes on the S&P 500.
In short, failure to crack the 3,300 level on the S&P 500 this week, and the index could be headed back towards it’s all-time highs, this could be a bullish catalyst for BTC. If the mentioned support area does break on the S&P 500, be prepared for a quick retest of the $10,100 to $10,000 area.
The economic calendar is really dominated by the S&P 500 and the UK Parliament vote on Brexit this week. The UK economy does play an increasingly diminished role in the global economy, however, any Brexit shocks could still impact equity markets, so it is still worth watching in regard to any impact on BTC.
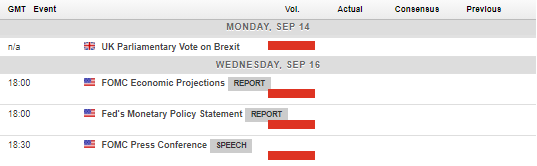
Economic Calendar
Source: Forexlive
The current technicals for Bitcoin show that the cryptocurrency has formed a bullish reversal pattern, which suggests that an eventual rally back above the $11,000 level.
Bulls must successfully anchor the cryptocurrency above the $10,630 area in order to activate the inverted head and shoulders pattern.
Traders should be aware that the exact bullish target of the pattern is $11,430, and the pattern will be invalidated if price moves below the $9,800 level.
In the near-term, the recent recovery in the BTC/USD pair looks set to continue while price trades above the $9,800 level. A drop below the $9,800 level and BTC could be on a slippery slope towards $9,000.
Key weekly support, and potential swing areas are found at the $10,220 and $10,080 levels. Key resistance is found at the $10,900 and $11,100 levels.
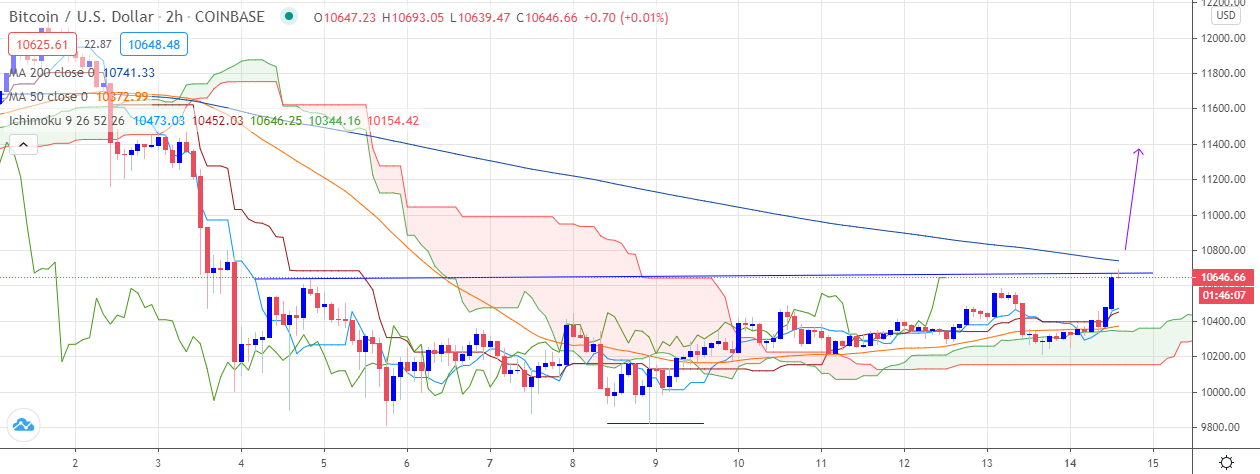
BTC/USD H2 Chart
Source: Tradingview
Ethereum (ETH) performed a bullish price close above the neckline of a huge bullish reversal pattern that has yet to fully play out to the upside.
The pattern suggests that ETH/USD has the potential to rally towards the $600.00 area while trading above the $365.00 level. However, ETH/USD is unlikely to reach $600.00 any time soon.
A potential rally towards the $430.00 or $450.00 area would seem more appropriate if BTC/USD heads towards the $11,400 area over the coming days or weeks, and the altcoins starts to recover.
The fact remains that the ETH/USD pair has bearish price divergences still in play between the $270.00 and $240.00 levels, therefore downside risks are still fairly highly.
In the near-term, continued gains above the $365.00 level and the $395.00 $415.00 levels are the next upside targets.
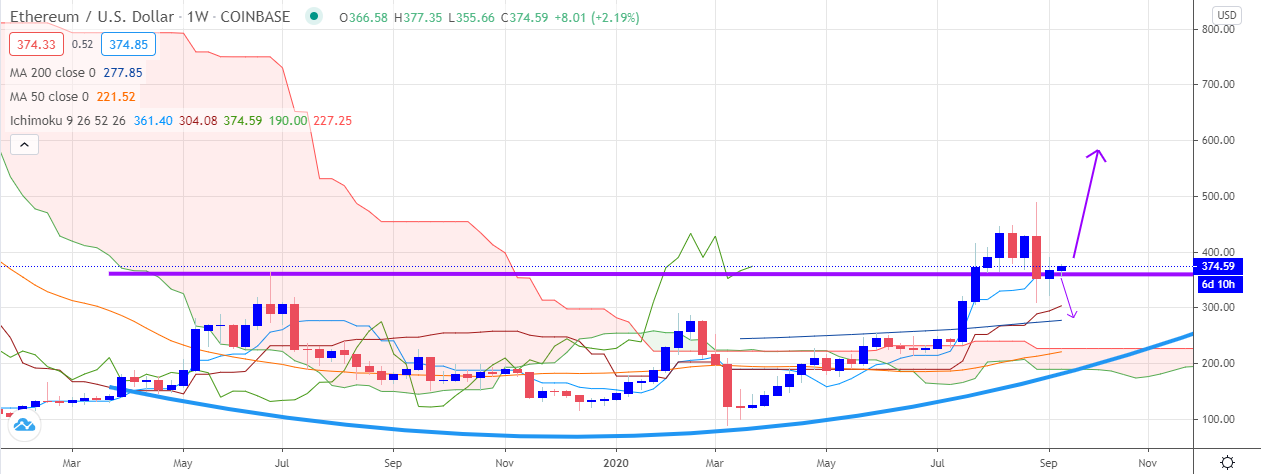
ETH/USD Weekly Chart
Source: Tradingview
