September 7 Crypto Market Roundup

Bitcoin (BTC) suffered its largest single-day loss since the March 13th flash crash last week, following a series of bearish fundamental and technical developments.
Unusually large selling pressure from BTC miners started to weigh on the price of Bitcoin, following a brief recovery above the $12,000 level at the start of the trading week.
Bitcoin started to unravel further, following news that the Bithumb exchange has been raided by South Korean police, a resurgence in the U.S. dollar index, a sharp decline in the S&P 500, and an unexpected bearish breakout under the technically important $11,100 level.
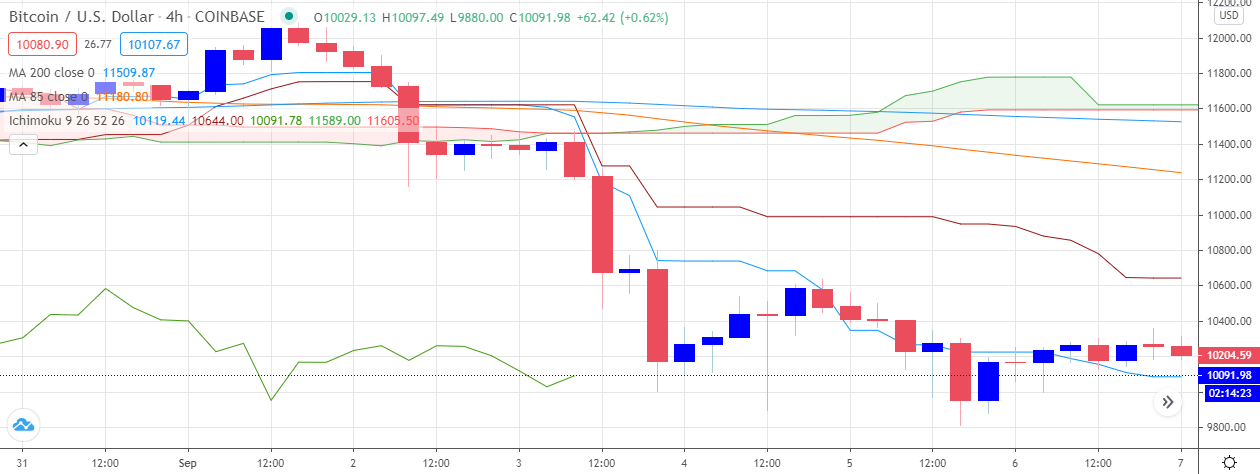
BTCUSD H4
Source: Tradingview
The Crypto Fear and Greed Index suffered its largest one-day decline of the year last week. Prior to the crypto markets sharp decline the index had been trapped in a state of “extreme greed” for it’s longest period on record.
The VIX volatility index also recorded it’s largest single day spike since June 11th this year last week, as equity markets and Bitcoin sold-off.
On-chain data from crypto behaviour analytics company, Santiment, recorded a massive spike Token Age Consumed around the $12,000 level last week, as large players moved their bags.
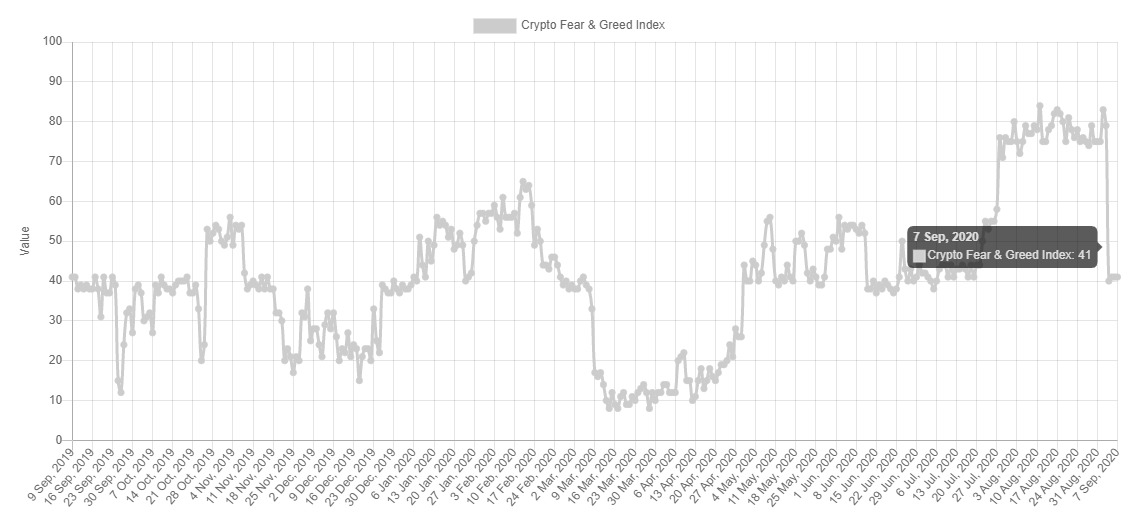
Crypto Fear and Greed Index
Source: Alternative.me
Santiment also released a report after the recent sell-off, which highlighted that a number of bearish on-chain divergences had been reversed during last week’s sell-off, and that some key on-chain metrics remain bullish.
Positioning data amongst margin retail traders on a number of the major exchanges showed surprising divergences. Traders on the Bitfinex and BitMEX exchanges remained heavily long BTC, while traders on Binance were resounding short BTC.
The latest BTC Commitment of Traders report showed that asset managers and institutions on the CME futures exchange increased bullish bets towards BTC, while professional traders increased shorts.
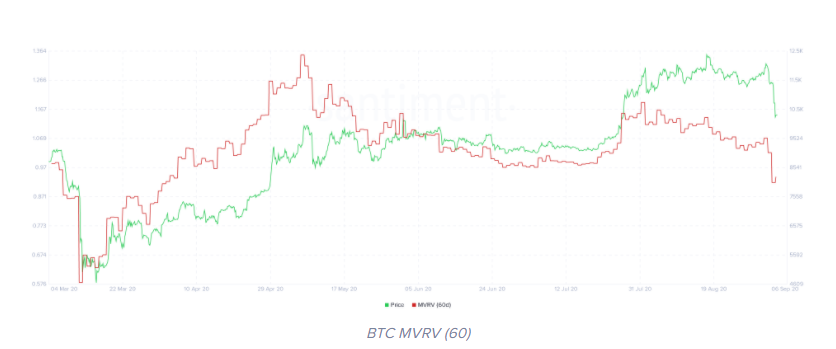
Source: Santiment.net
The total market capitalization of the cryptocurrency market fell sharply last week, as losses from heavyweights crypto Bitcoin, Ethereum (ETH) and Ripple (XRP) caused a major price plunge in the value of the cryptocurrency market.
Spot volumes for the total market capitalization exploded to levels not seen since May 10th this year, while futures trading volumes on the CME exchange also saw a dramatic uptick.
The decline in the cryptocurrency market was broad based, with all of the top altcoins, and leaders inside the DeFi space experiencing heavy losses. The much-hyped cryptocurrency Polkadot (DOT) eroded nearly 50% of its value, after falling back towards the $3.70 level.
During my upcoming webinar, I will be taking a look at Polkadot (DOT) on the charts, alongside Ethereum (ETH) and a host of other altcoins.
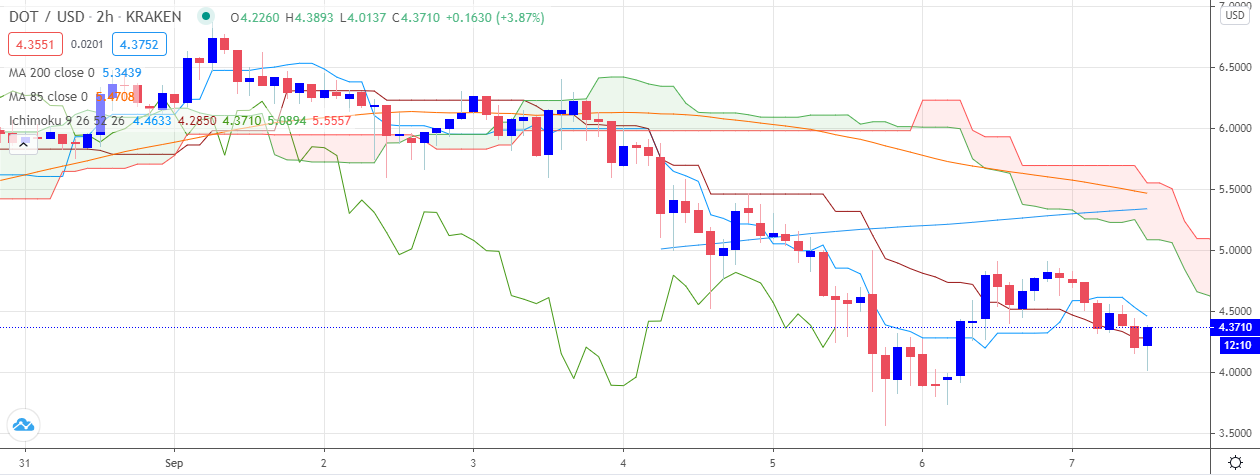
Source: Tradingview
The Week Ahead
Bitcoin has a huge week ahead, the overall uptrend in the pioneer cryptocurrency, and also the broader crypto market now hangs in the balance.
Bitcoin is likely to take its cue from broader financial markets, or more specifically the S&P 500 and the U.S. dollar index.
The reasoning behind the recent decline in the S&P 500 is still largely unclear to many analysts. Large-scale profit taking ahead of the U.S election, technical selling, and a rotation away from tech stocks are all possible reasons behind last week’s decline.
The recovery in the global economy is still not underway in any meaningful capacity, while the Federal Reserve QE programme being hugely supportive for stocks.
Thus I remain skeptical that last week’s decline in the major U.S. indices was a genuine reversal, and could indeed be a healthy correction within a questionable bull trend, and probably still has some room to run to the upside after testing its 200-day moving average.
Last week’s recovery is still U.S. dollar index is also still questionable. The greenback started to firm after the solid August ISM manufacturing report. I still believe it is too early to call a bottom in the U.S. dollar downtrend.
Daily price closes on the U.S. dollar index and the EUR/USD will be key to gauge the validity of last week’s reversal.
Traders that were sidelined last week, and are still bullish towards BTC, and indeed the top coins, are likely to attempt to enter back into the ongoing uptrend, and position themselves for the next major rally.
Speaking directly to Bitcoin, the directional of the S&P 500, and the U.S dollar will play a critical role in the cryptocurrencies performance this week.
Failure to build on last week’s gains for the greenback, and failure to break under last week’s lows in the S&P 500 should be hugely supported for Bitcoin.
This week the U.S. economic calendar is heavily focused on central bank rate decisions from the European Central Bank and the Bank of Canada, and data from the Chinese economy.
CPI inflation data headlines the U.S. economic calendar, watch out for fireworks in financial markets if U.S. CPI undershoots expectations. FED Chair Powell has been explicit that the Federal Reserve will not tolerate deflation.
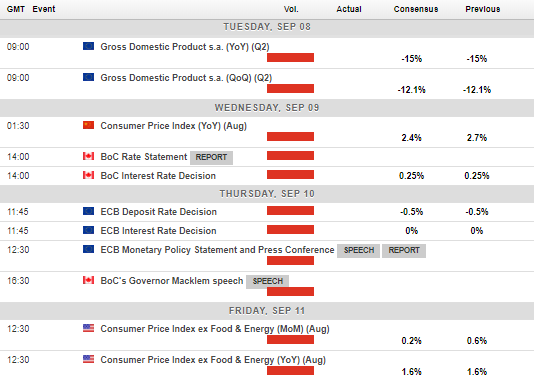
Economic Calendar
Source: Forexlive
The current technicals for Bitcoin show that Bitcoin remains in a vulnerable position while trading below the $10,550 level, and is increasingly at risk of overextending to the downside and eroding it’s hard-fought gain from late-July and August.
Bulls must successfully anchor the cryptocurrency above the $10,550 area in order to encourage buyers to test towards former key support, now turned resistance, at $11,100.
Traders that are bullish towards BTC may be looking to enter around the $9,600 to $9,550 area, or await price stabilization above the $10,550 area.
Indeed, traders that are bearish towards Bitcoin, may await failure under the $10,000 level to position themselves for an even larger decline towards the $9,100 to $8,800 area.
The recent bull run will really be put into question if we start to see Bitcoin slipping below the $9,500 area, and would no doubt trigger a significant amount of liquidations on some of the major exchanges.
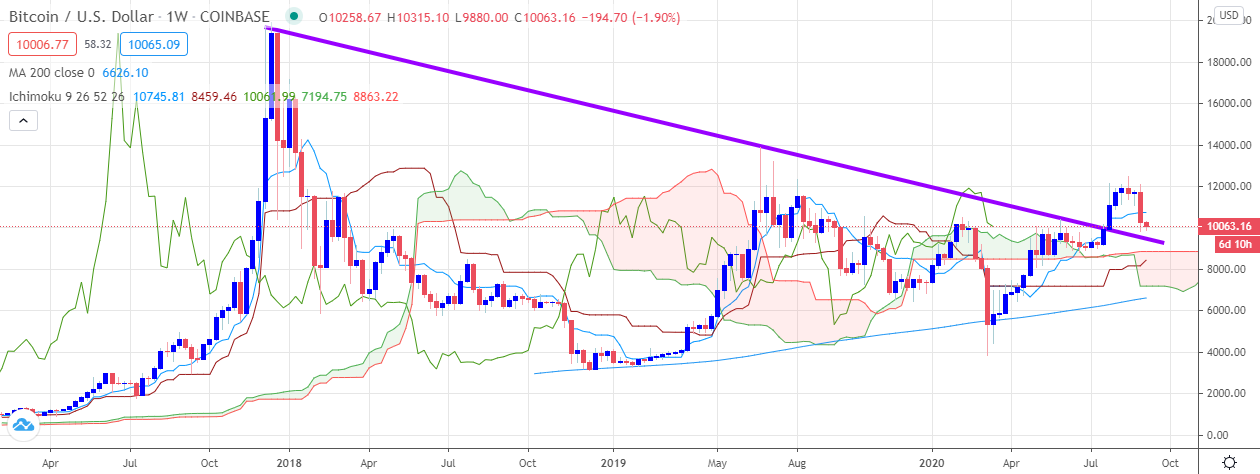
BTC/USD Weekly Chart
Source: Tradingview
Ethereum (ETH) started last week in promising fashion, and set a new multi-month high just under the $500.00 level. Since peaking last week the ETH/USD pair has been quickly unravelling, and especially since Bitcoin broke critical support. At the moment it appears that Ethereum could soon test below the $300.00 area.
The prominent bid-tone supporting Ethereum over recent weeks is no longer present, and it appears that a number of bearish divergences may have to be reversed before a wider recovery can begin.
According to the MACD indicator, The ETH/USD pair has bearish price divergence between the $270.00 to $240.00 levels. If we see the $300.00 level broken I would not be surprised to see these price divergences reversed.
The key upside levels to watch are $365.00 and $395.00. However, I would prefer to see the bearish divergences reversed before assessing the strength of any potential recoveries above the mentioned resistance areas.
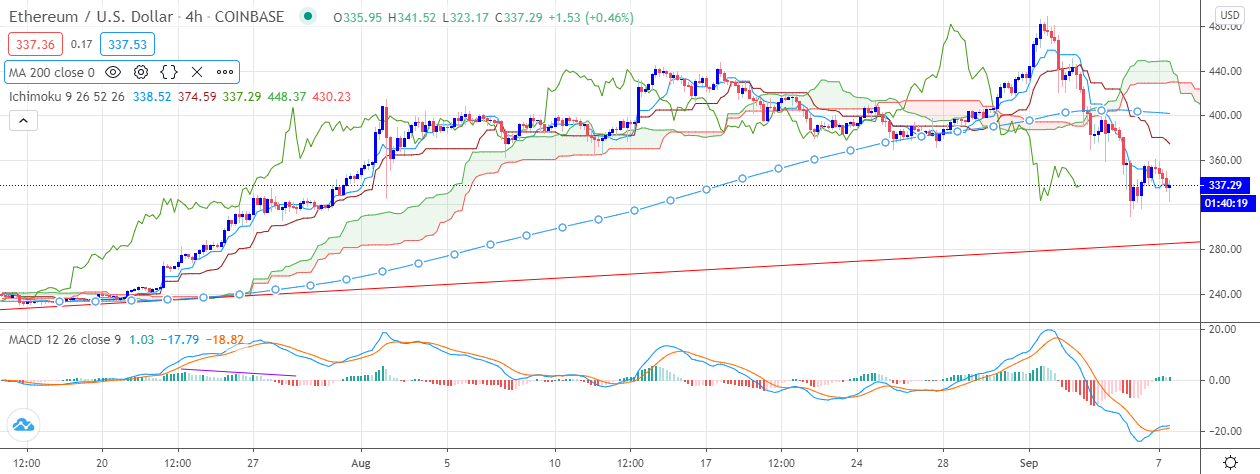
ETH/USD Daily Chart
Source: Tradingview
