August 31 Crypto Market Roundup

Bitcoin (BTC) traded between the $12,800 to $11,100 levels last week, as the pioneer cryptocurrency defended critical technical support amidst a barrage of technical selling pressure.
The much-anticipated speech from Federal Reserve Chair, Jerome Powell, at the Jackson Hole economic symposium, coupled with over $1 billion of BTC derivative expiriations caused nervousness amongst crypto traders.
Both events failed to prompt a major sell-off in BTC below the $11,000 support level as traders had previously feared. A number of analysts speculated that the Jackson Hole speech appeared to support the case for an ongoing BTC bull run.
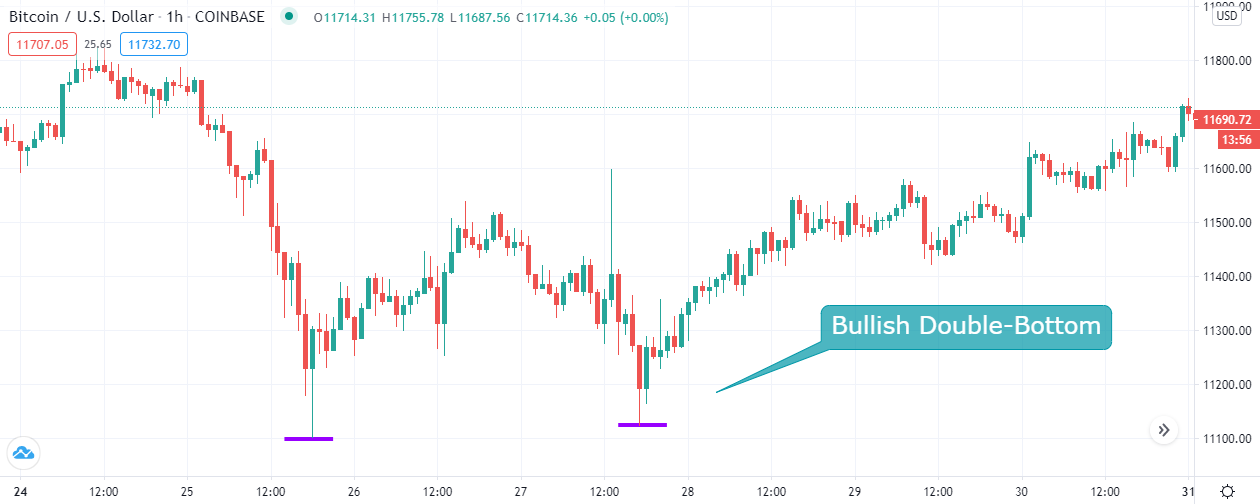
BTCUSD H4 Chart
Source: Tradingview
On-chain data from Santiment last week showed that BTC HODL data remained overwhelmingly positive, despite the sizable pullback from the $12,400 level.
UTXO data highlighted that the amount of Bitcoins that haven’t been touched for over a year reached its highest ever level, further underscoring the bullish fundamentals behind the cryptocurrency.
Bitcoin wallet data last week also continued to suggest that the cryptocurrency was likely to be in the early stages of a long lasting bull cycle.

Total Balance of Owned Coins
Source: Santiment.net
A significant amount of BTC whale activity was recorded last, both before and in the aftermath of the Jackson Hole economic symposium.
Positioning data on the major exchanges showed that a number of top traders remained bullish towards BTC, despite the pullback towards the $11,000 level.
Sentiment data from the Crypto Fear and Greed Index showed that traders remained in a state of “greed” for the longest period of time on record.
The latest BTC Commitment of Traders report showed that institutions drastically reduced bearish bets towards BTC.
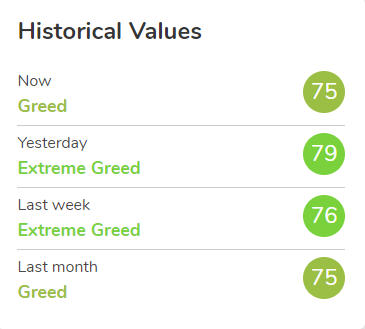
Source: Alternative.me
The total market capitalization of the cryptocurrency market fluctuated between the $358 billion and $331 billion levels, which was a noticeably narrower range than the previous trading week.
Spot volumes for the total market capitalization held steady last week, while a report outlined that around 95% of futures trading volume comes from Asian exchanges.
Cosmos (ATOM) , NEO (NEO), and NEM (NEM) all posted solid gains on the cryptocurrency market last week. Polkadot also captured the interest of crypto traders and investors last week.
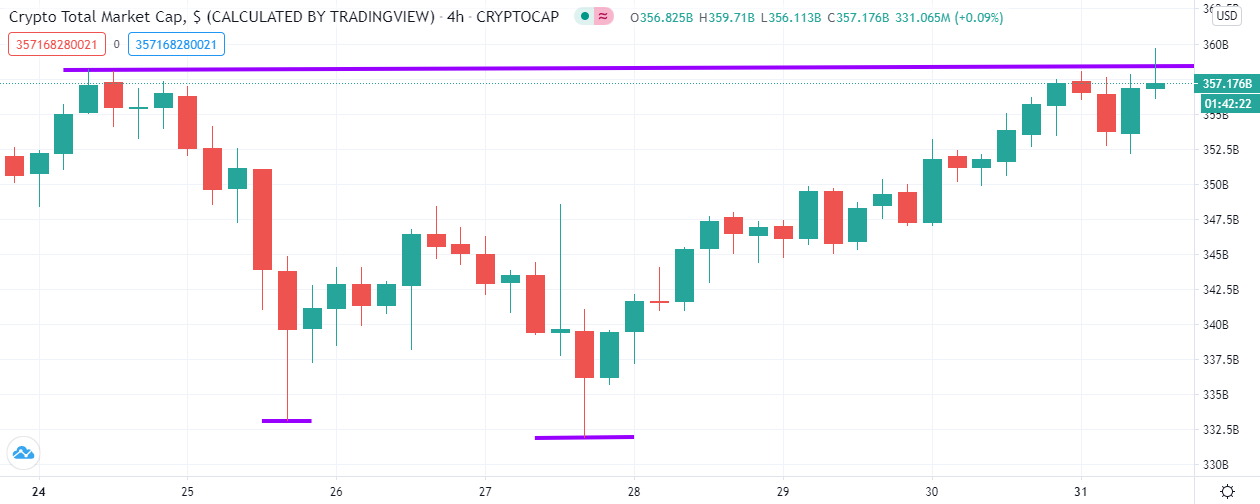
Source: Tradingview
The Week Ahead
Bitcoin may start to pick a clear directional bias this week, as the dust looks to have settled after the Jackson Hole event, and recent futures and options expirations. We should also remember that we are entering a new trading month this week, and also the last month of the third fiscal quarter.
Looking at broader financial markets, the resumption of the downtrend in the greenback, and the uptrend in gold and silver now looks to be back in play, following an initial shake-out leading upto, and in the aftermath of the Jackson Hole speech.
The ramifications for BTC if we indeed see the continuation of the U.S. dollar sell-off, and gold back above $2,000 level are quite profound.
A potential fresh yearly highly above the $12,500 level, and very possibly a continuation of the uptrend towards the $13,500 to $14,000 appears likely over the next few weeks appears to be the base case scenario. The extremely bullish scenario would take Bitcoin towards the $16,000 level.
The fact that Bitcoin held the critically important $11,100 support zone last week, and Ethereum failed to tumble under the $365.00 support level after coming under heavy downside pressure provided early clues that retraces may now be shallow.
Traders that were sidelined last week, and are still bullish towards BTC, and indeed the top coins, are likely to attempt to enter back into the ongoing uptrend, and position themselves for the next major rally.
On-chain data certainly support this case, alongside the bullish technicals while BTC continues to hold above the $11,100 level.
This week the U.S. economic calendar is heavily focused on jobs, with the U.S. monthly private sector report, and the Non-farm payrolls report, not to mention the usual weekly jobs data.
Traders are also likely to fixate on the monthly U.S. unemployment rate inside the Non-farm payrolls report, and also average earnings data.
If inflationary pressure is going to start to rise again in the United States, average earnings data is going to be something to pay attention too.
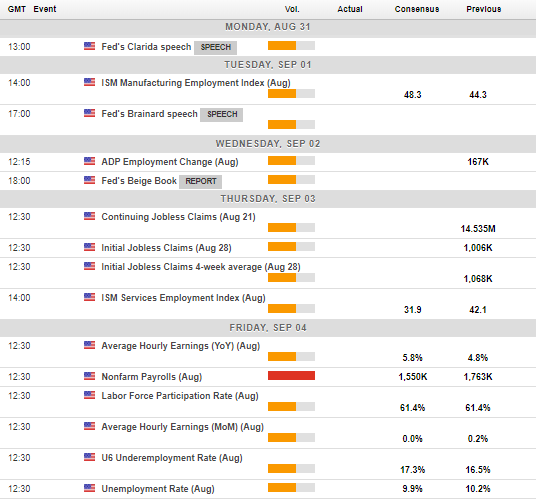
Economic Calendar
Source: Forexlive
The current technicals for Bitcoin show that bulls are trying to move price back towards the former weekly pivot point, around the $11,850 resistance level.
Bulls have also successfully moved BTC back inside a former bearish breakout zone from an ascending triangle pattern, which is found around the $11,700 level.
Traders that are bullish towards BTC may have to be patient this week and await a pullback towards the $11,300 to $ 11,200 area to confirm a higher weekly low. And also gain a far more attractive entry point.
Multiple failures to break under the $11,100 support level appears to have negated the short-term bullish case. As long as bulls continue to defend the $11,100 level traders will continue to expect further upside over the short to medium-term.
If Bitcoin breaks the $12,500 resistance level, then a rally towards the $13,500 to $14,000 area will likely be forthcoming.
Daily price closes above the $11,850 would further cement the medium-term bull case for BTC. Daily price closed above the $12,500 level could almost certainly seal the deal for $13,500.
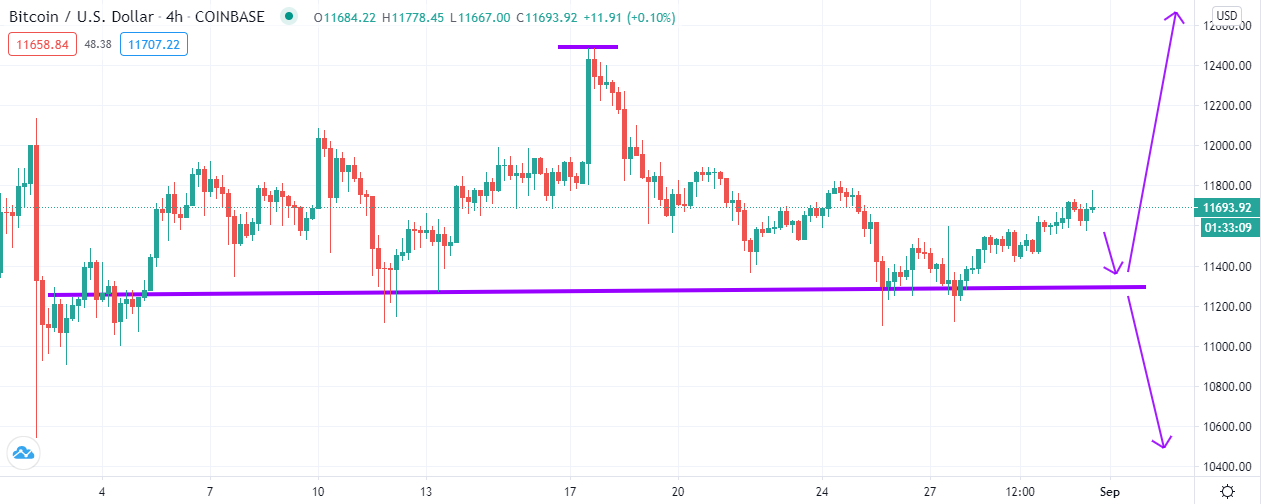
BTC/USD Daily Chart
Source: Tradingview
Ethereum (ETH) staged a bullish reversal from the $470.00 support area last week, as bears failed to breach the neckline of a large head and shoulders pattern, around the $365.00 level.
The former bearish weekly reversal candle appears to have been a false reversal, following last week’s bullish weekly close above the $395.00 level.
The retracement now appears to be a technical retest of the critical breakout zone from July, as clearly highlighted on the daily time frame chart below.
I believe any moves towards the $415.00 to $395.00 area should provide a good opportunity for traders to position themselves for a rally towards the $550.00 to $600.00 area over the long-term. This set-up remains valid while price trades above the $365.00 support level.
Watch out for false spikes towards the $350.00 area to trigger stops. However, given that price action seems very bullish at present, we may not see price much-lower than $380.00 for sometime.
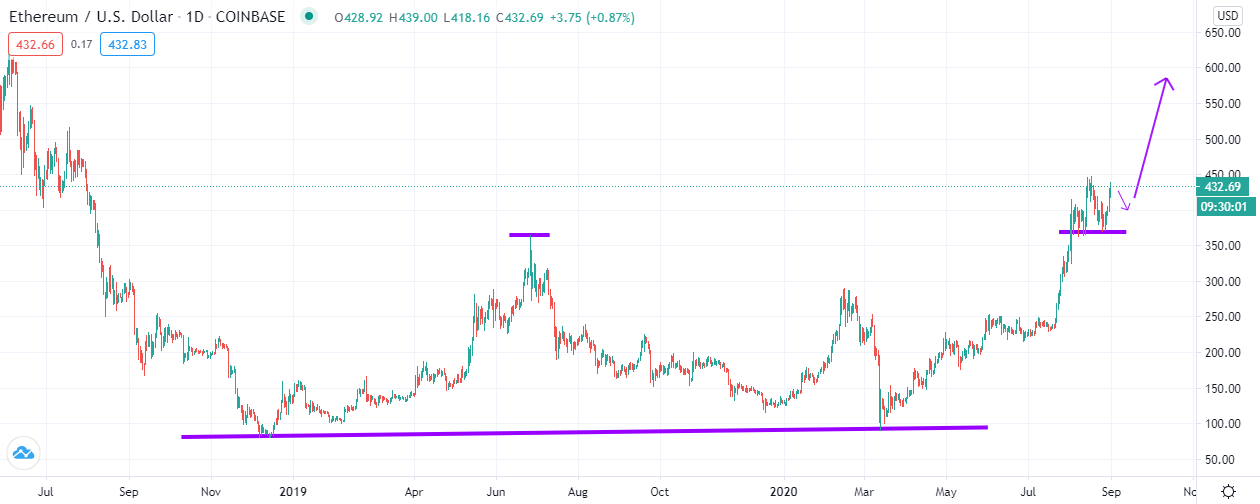
ETH/USD Daily Chart
Source: Tradingview
