Add This Trading Metric to Your Tool Set.

“Token Age Consumed” offers investors insight into the movement of dormant coins. It is the number of tokens that changed addresses on a specific date multiplied by the days since it last moved.
For example, if someone buys 10 Bitcoin on Jan. 1, 2020, and moves it to their wallet on Jan 10, 2020, this will represent 1,000 Token (10 days x 10 BTC). Thanks to blockchain technology, all of this data is easily available.
Of course, you can do this by hand, but there’s no need. Sites like Glassnode and Santiment track this metric, so that you can see clear spikes in Token Age Consumed. A spike indicates that a large amount of dormant tokens have suddenly moved.
Though it doesn’t paint the entire picture, it does reveal behavior of various whales in an ecosystem. And, like the Fed, crypto investors shouldn’t bet against the whales.
Here’s a chart from Santiment to bring this point home:
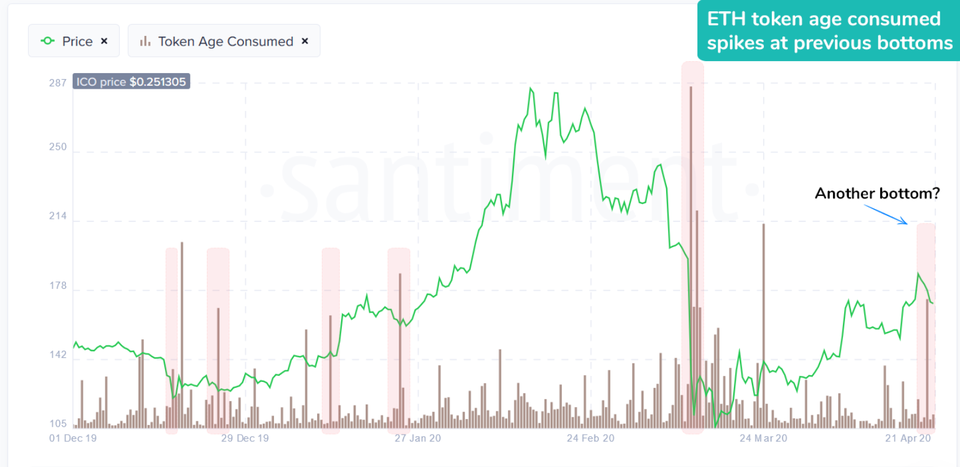
Though this chart would suggest that spikes in Token Age Consumed also indicates local bottoms, it isn’t conclusive. This particular tool is only helpful for observing large bag holders move their tokens.
And whether this tool is particularly useful to you will depend on the toolset you are already using. You also need to consider a token’s hashrate, buying pressure, MVRV ratio, and so on.
Though there aren’t any traders who can see into the future, the best traders act based on a broad spectrum of metrics. Together these metrics form a complete picture of the market.
