August 24 Crypto Market Roundup

Bitcoin (BTC) traded between the $12,480 to $11,370 levels last week, as the number cryptocurrency reversed sharply after hitting a 13-month trading high.
Large scale profit taking just before the $12,500 level appeared to suggest that an interim top had formed, following Bitcoin’s recent epic bull run, which started on July 27th.
Aside from profit taking, a resurgence in the U.S. dollar currency, an increase in institutional bearish bets, elevated bullish retail sentiment, and a lack of fresh upside momentum all caused traders to reassess BTC positioning.
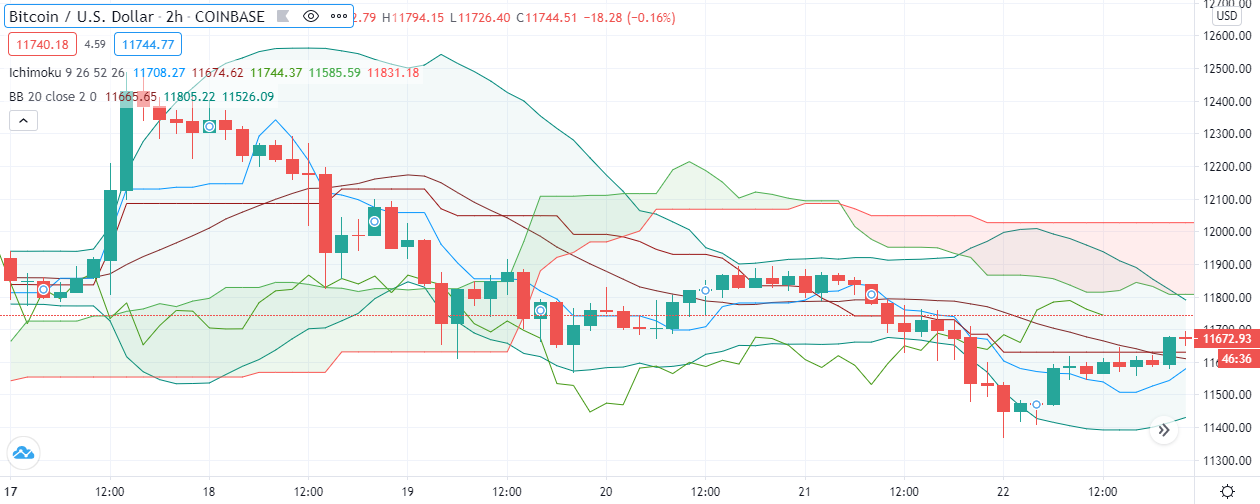
BTCUSD H4 Chart
Source: Tradingview
On-chain data from crypto behavior analytics provider, Santiment, recorded it’s largest single day spike in Token Age Consumed since the May of this year last week, as Bitcoin rallied above the $12,400 level.
Large amounts of Bitcoin whale activity was also recorded last week, as one of the largest crypto whales was reported to be active in the market after a noticeable respite from the market.
BTC holding sentiment also hit a two-year high last week, while positive sentiment towards Bitcoin on Twitter hit levels not seen since June this year.
Open interest for Bitcoin on the CME exchange nearly reached $2 billion last week. Analysts speculated that this was neither bullish or bearish, but rather an indication of coming volatility.
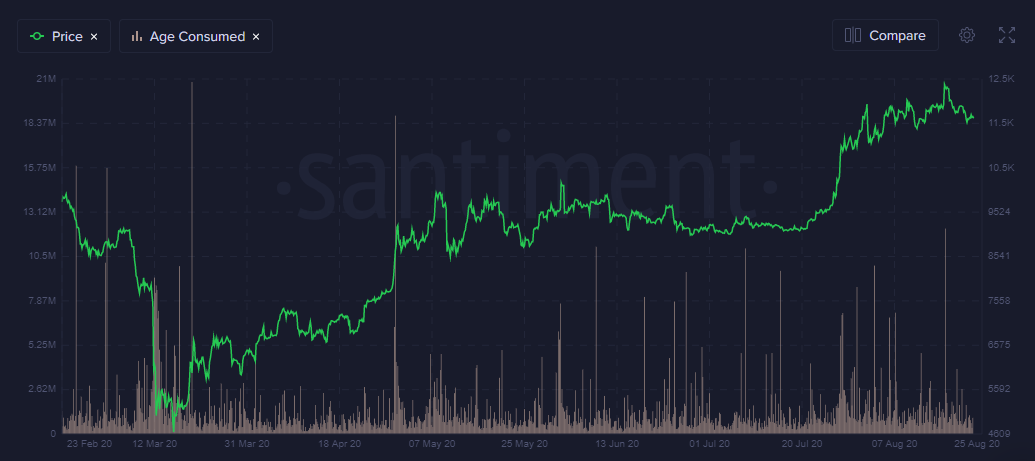
BTC Token Age Consumed
Source: Santiment.net
Sentiment data from the Crypto Fear and Greed Index continued to show that traders remained in a state of “extreme greed”.
Positioning data amongst margin retail traders on the major crypto exchanges showed a clear bullish bias, despite last week’s price pullback in BTC.
Data from the option market last week showed a substantial rise in BTC puts, and also highlighted that traders were offloading their call options onto the market. The latest BTC COT report also recorded a large increase in short positions amongst institutions.
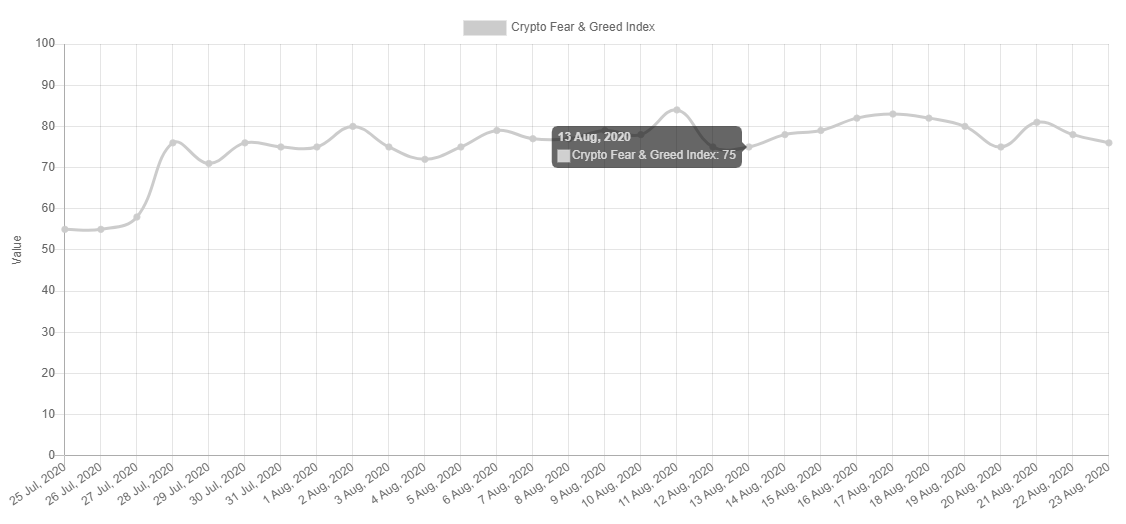
Source: Alternative.me
The total market capitalization of the cryptocurrency market traded in an extremely large range between the $383 billion and $333 billion levels last week.
Spot volumes for the total market capitalization dissipated to levels not seen since July 26th this year, despite the noticeably large weekly trading range.
Chainlink (Link) and Omise Network (OMG) captured the crypto market’s attention last week. While top altcoins such as Litecoin, and Ripple reversed from multi-month trading peaks.
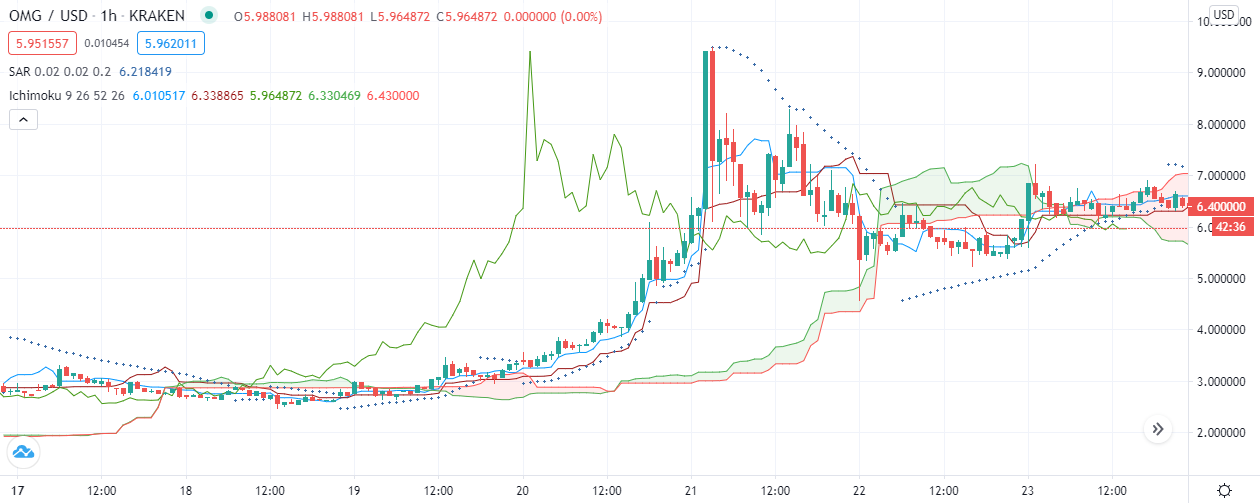
Source: Tradingview
The Week Ahead
Looking at the week ahead, Bitcoin may start to be influenced by external factors such as the U.S. dollar, gold, and central bank monetary policy.
This week’s Jackson Hole economic symposium could create some fireworks in traditional financial markets. Watch out for the FED to clearly outline its path on inflation and monetary policy easing.
Going back to the U.S. dollar currency, I think the chances that an interim top is in place until the election are now fairly high. However, markets rarely make one-way directional moves, so I would expect a fair amount of shaking out in both directions before the U.S. dollar index starts to flex its muscles back towards the 95.00 handle, and possibly higher.
Just for some reference, U.S. dollar short positioning fell from a nine-year peak last week, while the largest EUR/USD short position ever recorded also entered the market last week.
The euro currency makes up a substantial amount of the U.S. dollar index basket. Make of it what you, but a shift in the currency market may very well be underway as we enter into the U.S. election cycle, and this of course has implications for BTC.
I would not be surprised to see Bitcoin, and altcoins making a quick recovery if we do see a substantial decline in the crypto market over the coming sessions.
Speaking of altcoins, I will be charting Bitcoin, Swipe, Bitcoin SV, and Cardano during my upcoming webinar this Wednesday.
In the near-term, the Jackson Hole economic symposium really is the big event to watch on the United States economic calendar this week. Watch out for major volatility, and a spike in the VIX if the Federal Reserve in any way fails to deliver what the market is hoping for.
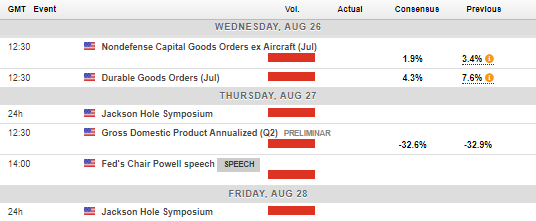
Economic Calendar
Source: Forexlive
The current technicals for Bitcoin show a clear bearish shift, despite the recent fight-back towards the $11,800 resistance level.
Last week’s bearish weekly reversal candle, and a break under the well-defined ascending triangle pattern are all hints that a move lower may be on the horizon.
Furthermore, the lower time frames are showing a bearish head and shoulders pattern with a target of around $10,500. Bulls would need to move price above the $12,500 level this week to invalidate the bearish pattern.
A break under the $11,000 support level would really get the bear party. As I have been mentioning for some weeks now, buying into dips towards the $10,400 to $10,000 area may provide a tremendous entry point, in expectation of a powerful counter-rally towards the $13,500 level.
If Bitcoin breaks the $10,000 level, the $9,550 level is the ultimate line-in-the-sand for bulls.
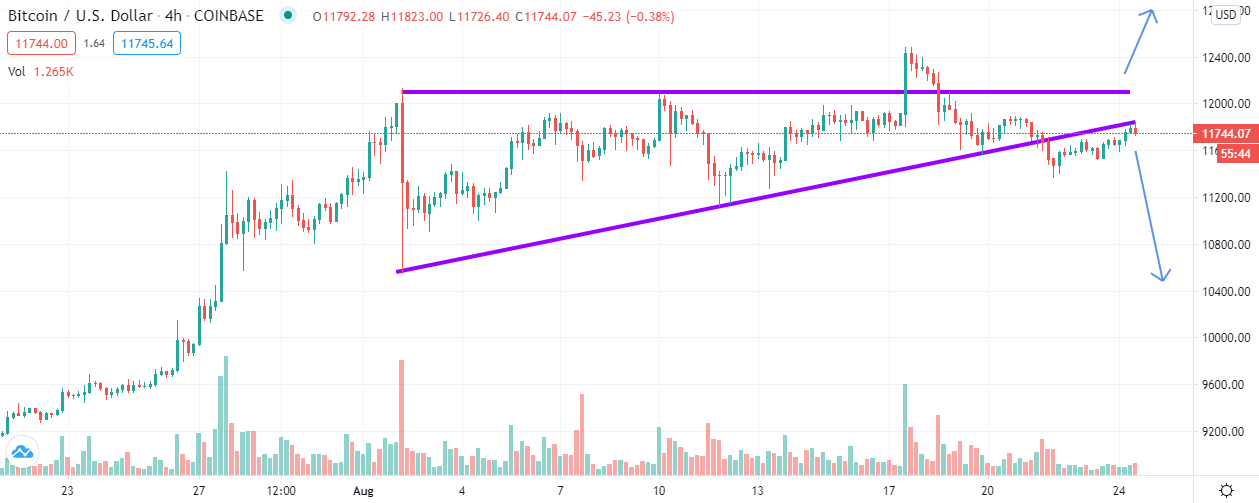
BTC/USD Daily Chart
Source: Tradingview
Ethereum (ETH) reversed sharply from the $440.00 area last week. I had been warning of bearish price divergences for the ETH/USD pair, and the possibility of coming reversal lower.
A bearish weekly reversal candle, and a weekly price close under the $395.00 level provide technical hints that more downside could be on the horizon.
However, dips are likely to be bought aggressively, and the main point of contention is how low can Ethereum realistically go, given all the bullish dynamics behind the coin.
I believe any moves towards the $300.00 to $275.00 area would provide a significant opportunity for traders to position themselves for a potential counter-rally back towards the $440.00 level, and possibly even the $500.00 area.
The short-term technicals show that a break under the $360.00 level should dramatically increase selling pressure, and would quickly place the $320.00 to $300.00 region in focus.
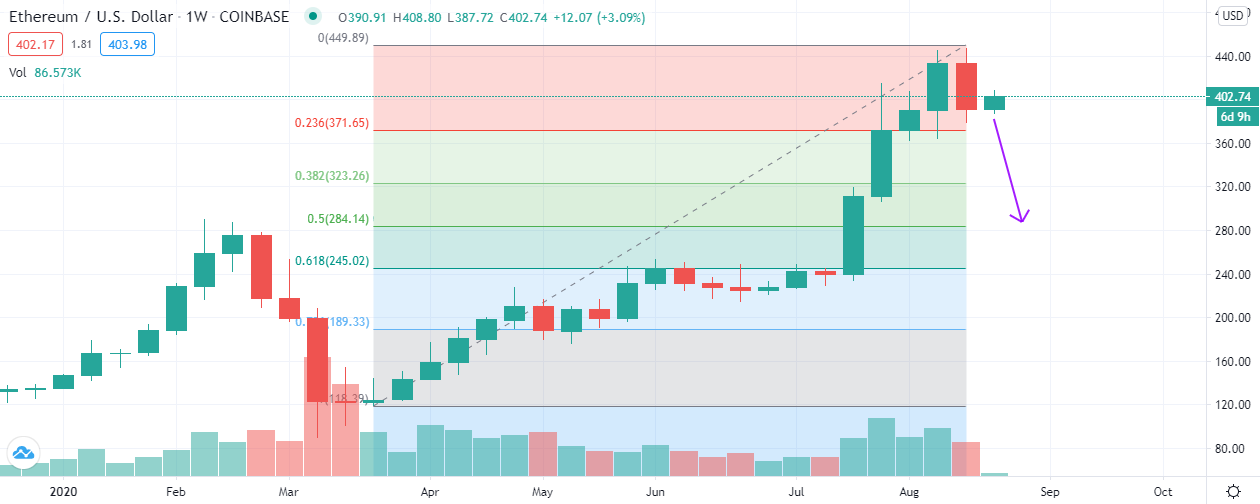
ETH/USD Daily Chart
Source: Tradingview
