August 3 Crypto Market Roundup

Bitcoin (BTC) rallied to its highest trading level in over twelve months last week, as the ongoing breakout in the number one cryptocurrency reached the $12,100 resistance level.
Technical buying interest ramped up dramatically, as the BTC/USD pair performed its highest monthly price since 2017, and also it’s second highest monthly price closed ever recorded.
Bitcoin futures open interest also hit a fresh all-time record trading high last week, as futures traders continued to expecte more upside for BTC’s spot price.
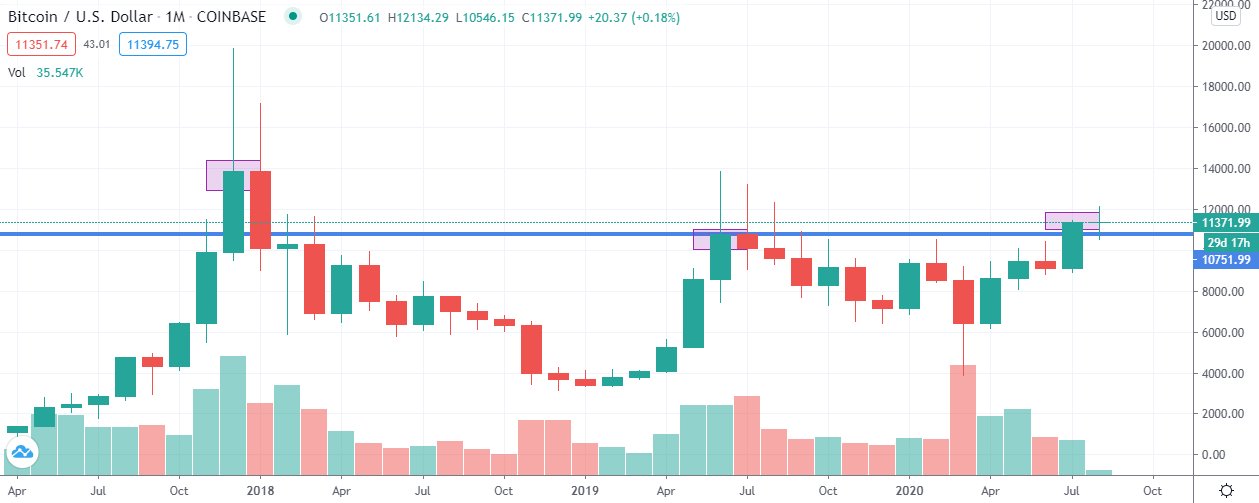
BTCUSD Monthly Chart
Source: Tradingview
Despite the positive monthly price close, Bitcoin incurred a massive technical pullback last week, as over $1billion BTC was liquidated over the weekend.
Some analysts warned that BTC had gone too high, too fast. While other analysts noted that the funding rates of Bitcoin and Ether were nearing levels that are not sustainable over a prolonged period.
Failure to breach the August 2019 swing-high, around the $12,300 level, may also have caused traders to book profits, and reduce short-term bullish bets towards BTC.
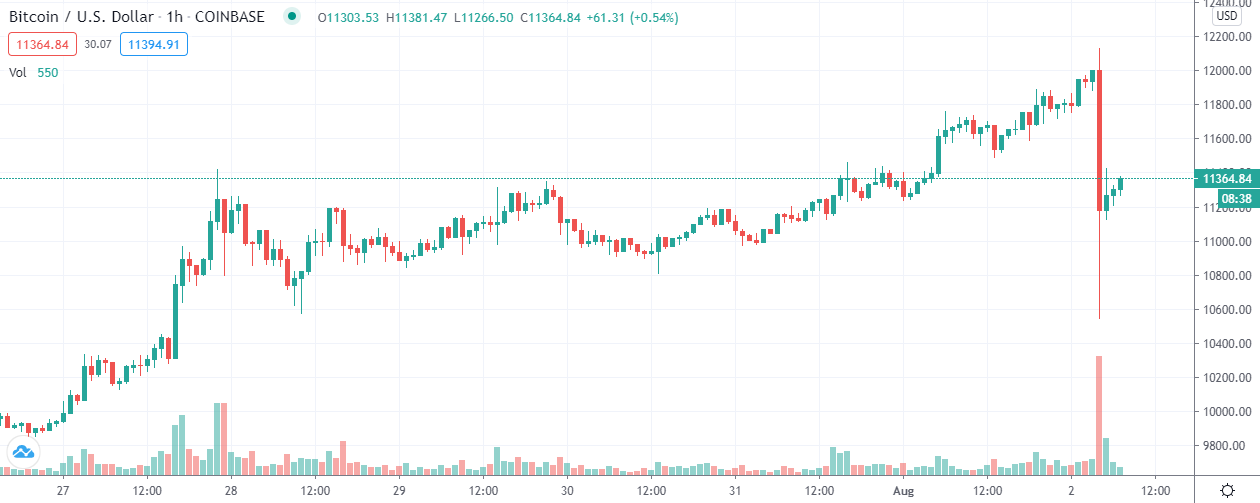
BTCUSD Daily Chart
Source: TradingView
According to the Crypto Fear and Greed Index, BTC traders had entered into a state of extreme greed. Infact, sentiment towards BTC had reached its highest since July 2019.
The number of BTC moving into exchanges reached its highest level in over 5 months, while Bitcoin’s hash rate remained close to its all-time record high.
The latest Bitcoin Commitment of Traders report, or CoT report, also showed that a massive bullish shift had taken place last week amongst non-reportable positions.
Bitcoin’s 1-year HODL wave also hit a new all-time high last week. Which indicated that traders are still accumulating BTC around current levels.
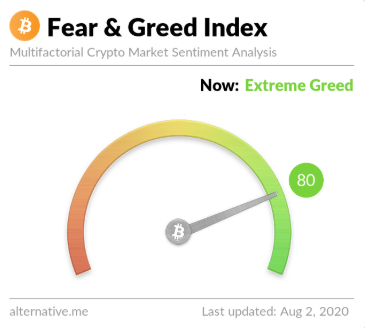
Source: Crypto Fear and Greed Index
The total market capitalization of the cryptocurrency market rallied towards the $360 billion level, marking its highest trading level since June 2019.
Bitcoin’s market dominance suffered a major setback, after reversing sharply from the 64.50 area over the weekend, following a false upside breakout.
Altcoins also posted some major gains last week, with Ethereum, Ripple, and Litecoin leading the charge amongst the better-known tokens.
Ampleforth, Zcash, HedgeTrade, and Theta all posted strong double-digit weekly gains, while Bitcoin forks Bitcoin Cash and Bitcoin SV suffered over the weekend due to the strong pullback in BTC.
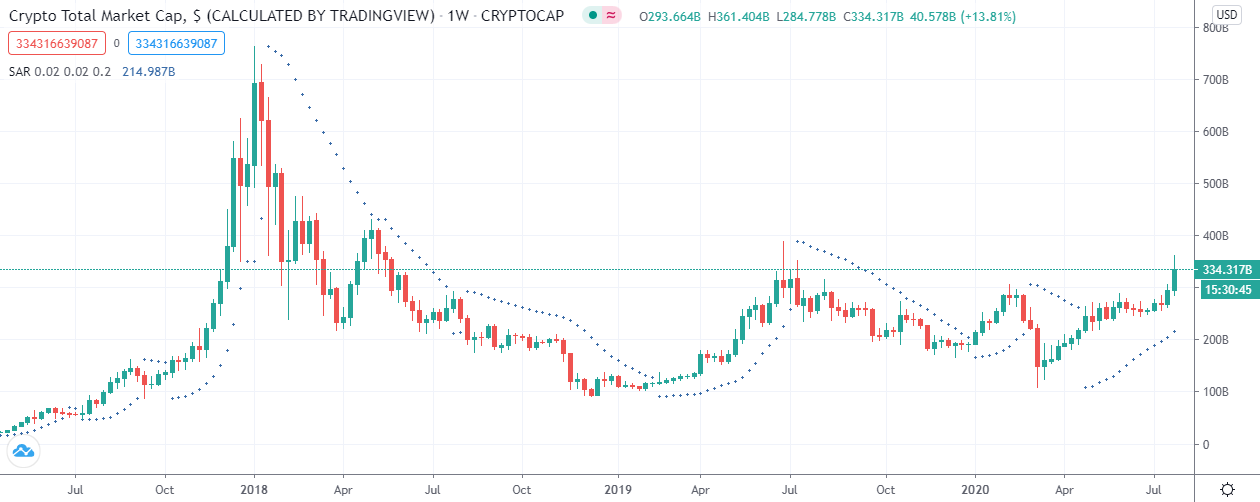
Source: Tradingview
The Week Ahead
Looking at the week ahead, BTC bulls need to break the $12,100 resistance level to encourage more technical buying interest, and a test of the 2019 trading high. A sustained breakout above the $12,300 level could easily encourage a major push higher towards the $13,500 level.
Failure to do so may result in a swift technical correction back towards the $10,000 to $9,700 area. The $10,550 to $10,300 area remains critical for the BTC bull case, and ongoing buy-the-dip mentality amongst short and medium-term bulls.
Traders attention will almost certainly be focused on the ongoing impasse in U.S. congress over the second coronavirus check this week, and the ongoing decline in the greenback.
Gold and silver are also trading at a critical juncture. Failure to rally to fresh 2020 highs this week, could start some minor profit taking, which potentially harm Bitcoin.
The $2,000 and $2,050 levels are the key resistance barriers to watch on gold. Looking at silver, a breakout above the $26.20 level opens the gate for $30.00.
The United States economic calendar is extremely busy this week, and jammed packed with top-tier economy data points. The ISM manufacturing survey, ADP private sector jobs report, and the July non-farm payrolls job report are amongst this week’s highlights.
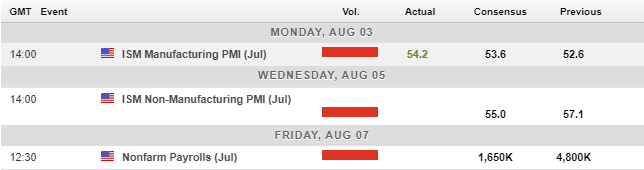
Economic Calendar
Source: Forexlive
The current technicals show that Bitcoin bulls remain in control while the daily candle closes above the $11,300 level. Daily price closes below this level could see BTC sold down towards the $10,400 to $10,300 area, at a minimum.
Looking slightly lower, bears need to move price below the $9,900, and finally the $9,670 level to close an important price gap on the Bitcoin CME futures chart. The $9,200 level comes in as the line-in-the-sand for dip-buyers this month.
To the upside, a breakout above the $12,300 level would cement the bullish view. This would certainly encourage the notion that bulls are preparing to attack towards the $13,500 level at some point this month.
It is still possible that a pullback and a subsequent rally in BTC may occur even if the $12,300 level is not broken. Overall, all eyes on the August 2019 high this week.
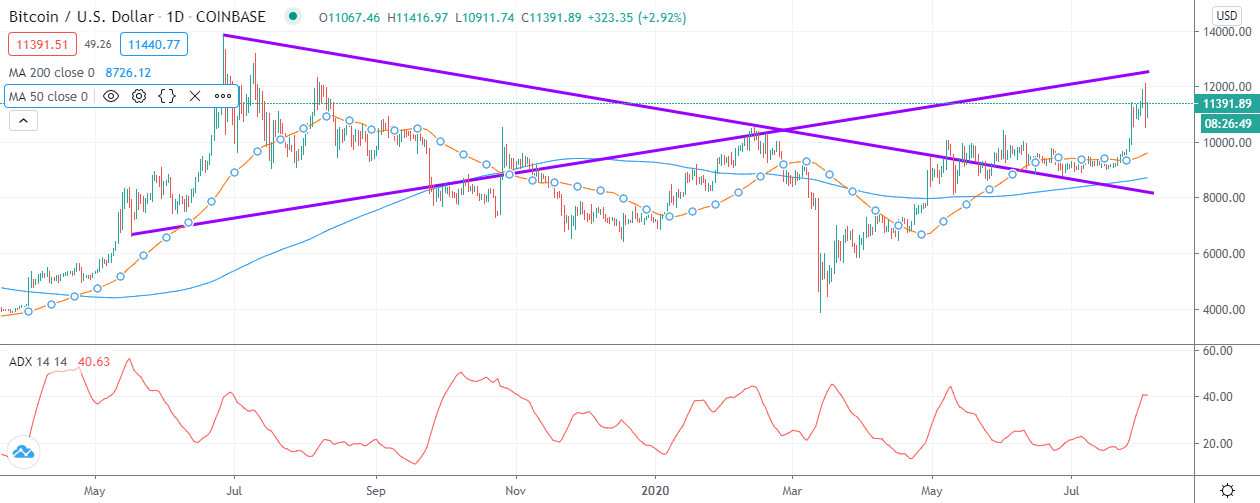
BTC/USD Daily Chart
Source: Tradingview
Ethereum (ETH) is intriguing on many levels at many. The price action surrounding the second-largest cryptocurrency appears even more bullish than Bitcoin at times, while ETH/USD technicals also equally match BTC/USD.
Bulls have taken the ETH/USD pair above the $400.00 level, albeit briefly. A deeper correction back towards the $300.00 level may present a solid-medium-term buying opportunity at some point.
Higher time frame analysis still shows that the $440.00 and $480.00 levels are major targets for bulls this month.
To the downside, dip-buying around the $320.00 and $300.00 area should be expected if another major pullback takes hold.
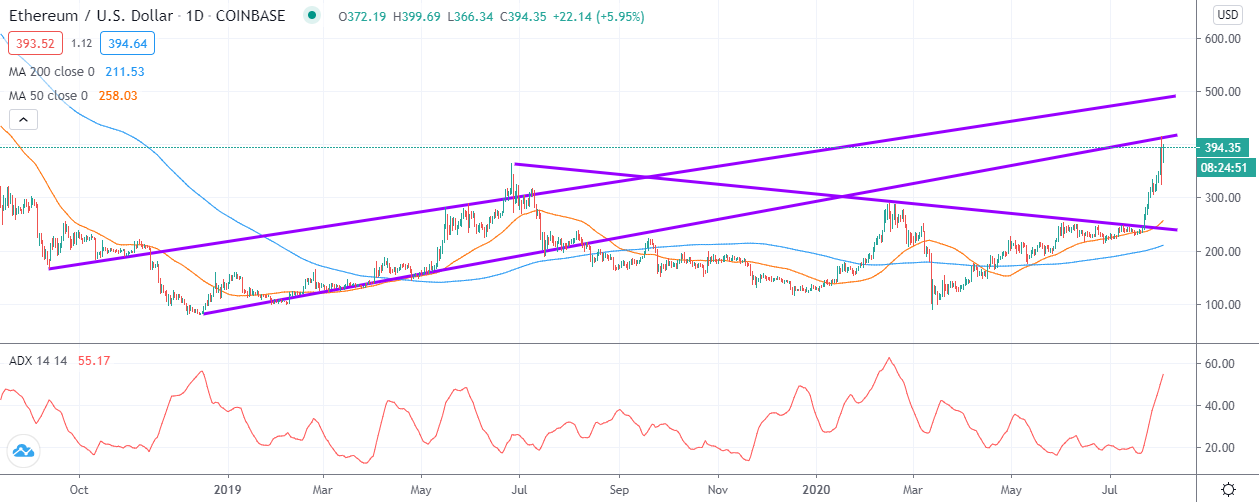
ETH/USD H4 Chart
Source: Tradingview
