Bitcoin’s Recovery Commences

Bitcoin briefly recovered back towards the $40,000 resistance level last week after finding strong dip-buying interest from just above the psychological $30,000 support level.
BTC initially headed towards the $36,600 level as the early-week recovery took hold, however, optimism over the proposed $1.9 trillion COVID-19 relief package from Joe Biden propelled the pioneer crypto back towards $40,000.
Market sentiment towards BTC also improved after Federal Reserve Chair Jerome Powell talked down the prospect of the central bank “tapering” QE any time soon.
Bitcoin was unable to hold the cryptocurrency above the $40,000 level and started to slide lower towards the end of the week. Rising COVID-19 infections and weaker U.S. retail sales and weekly jobs data also caused a broad-based sell-off in global stock markets.
On-chain analyst Willy Woo also had an interesting take on what caused last week’s sell-off. Woo suggests that Coinbase’s outage resulted in algos dragging BTC lower due to high funding rates.
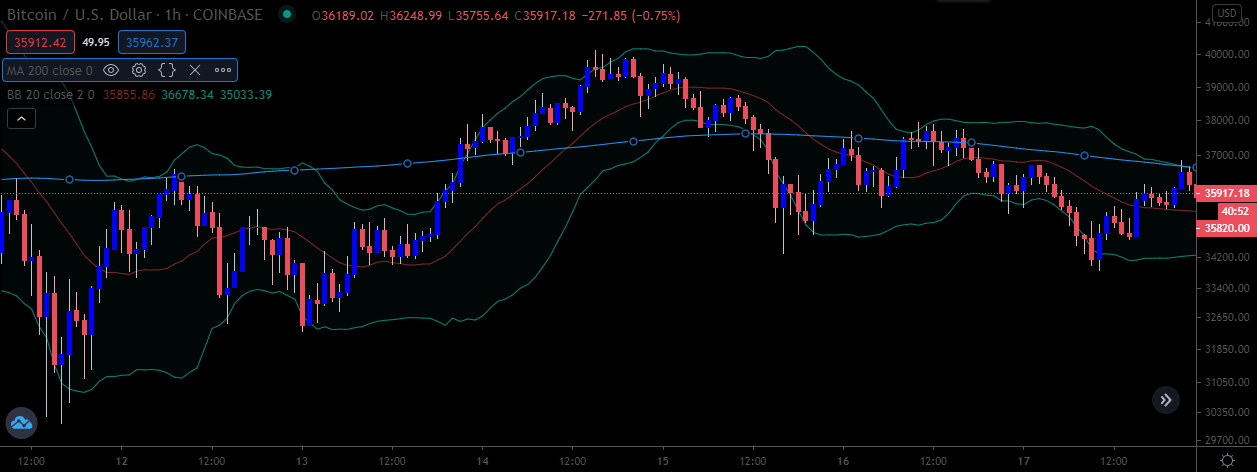
BTC/USD One-hour Chart
Source: Tradingview
Various exchanges showed that BTC trading volumes saw a major pick-up around the lows of last week, which was another positive sign for bulls that had bought the cryptocurrency around $30,000.
On-chain data from crypto behavioral platform Santiment also showed that a significant amount of whale activity took place around the $30,000 level, which suggested that institutions may have used last week’s pullback as another buying opportunity.
Weighted social sentiment on Twitter towards BTC turned negative last week, which also suggested that a recovery from the $30,000 level was about to take hold.
Data also showed that Grayscale Investment’s went on a major Bitcoin purchasing spree last week, following a notable absence from the crypto market during the pullback from $41,986.
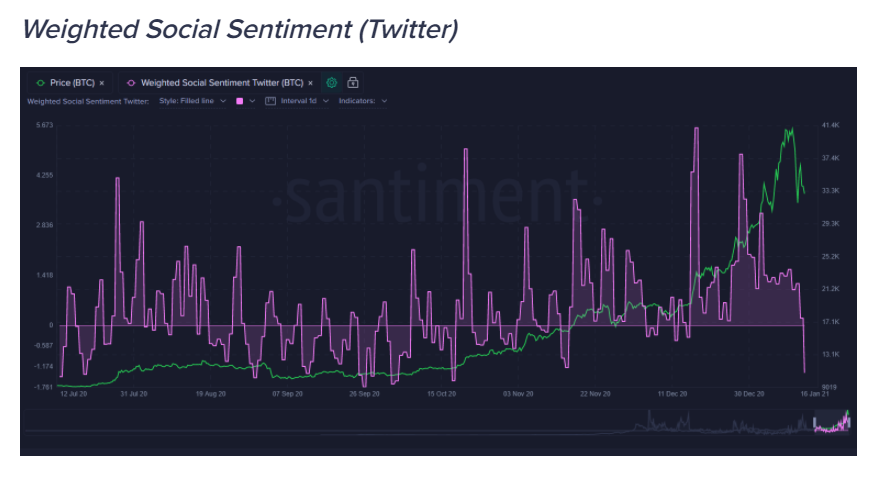
BTC Weighted Social Sentiment on Twitter
Source: Santiment
News that the OCC, an independent bureau within the US Treasury Department, granted conditional approval for Anchorage Trust Company to become Anchorage Digital Bank was also seen as bullish for BTC.
Bitcoin’s record high hash rate and ongoing supply shortage were other positive on-chain factors supporting the price rise back towards the $40,000 level.
The Crypto Fear and Greed Index pulled back from record high levels during the decline to $30,000, and moved back to levels not seen since November of last year.
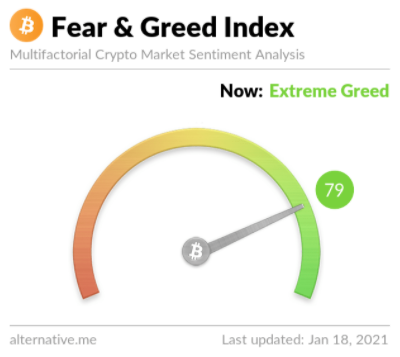
Crypto Fear and Greed Index
Source: Alternative.me
The crypto total market capitalization rallied back above the $1 billion benchmark level after finding strong buying interest from just above the $800 billion area last week.
Bitcoin’s market dominance also remained volatile and continued to look vulnerable as it struggled above the 70 percent resistance area on numerous occasions.
Polkadot dominated the trading action amongst the top altcoins as the DOT/USD pair surged to a new all-time high after finding strong buying interest around the $7.20 area.
During my upcoming webinar I will be discussing how to incorporate the Crypto Fear and Greed Index into your trading, and I will also be charting Bitcoin (BTC), NEO (NEO), Monero (XRM), and RUNE (RUNE).
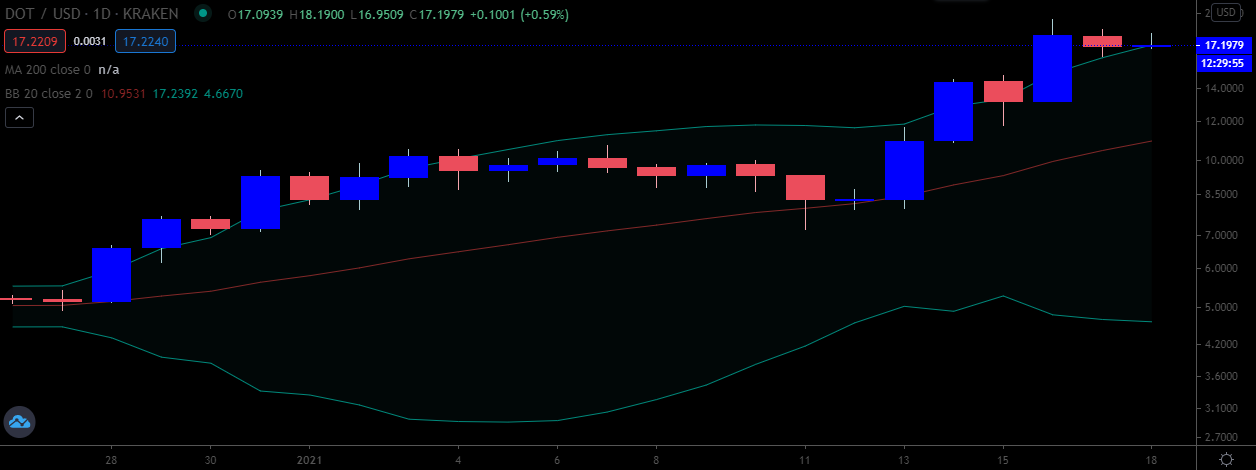
Source: Tradingview
The Week Ahead
Bitcoin is set for another important week ahead, and I will stick with my statement from last week that “BTC is set to trade in this much-higher new trading range between the $30,000 to $40,000 area until a new bullish or bearish bearish market catalyst comes along”.
The fact that whales and institutions continue to support dips and the ongoing supply crisis remains with us cannot be overstated. Additionally, new players continue to enter the market, and this should also support BTC on pullbacks.
Last week we also learned that the U.S. consumer spending and jobs situation is still deteriorating, which could increase the prospect of further monetary support from the Federal Reserve.
Federal Reserve Chair Powell also clearly stated last week that the United States central bank does not believe that the current recovery is sufficient, and the U.S.economy still remains weak.
The weakening U.S. data also raises the prospect of the U.S. Congress approving the Democrats proposed $1.9 trillion relief bill sooner-than-expected to stave off the ongoing downturn. However, markets are still skeptical that all of the $1.9 trillion package will be passed through the U.S. Congress.
All these factors support the case for Bitcoin to trade higher. We should also consider that other countries around the world are also facing their own problems, making Bitcoin a superior investment vehicle and storage of wealth while other currencies depreciate.
On-chain data continues to show growth in whale address activity. Some on-chain indicators are also in the process of correcting, such as the SOPR ratio, which is healthy before the expected up move towards $50,000 commences.
The economic calendar is dominated by central bank decisions this week. In the United States weekly jobs data, PMI manufacturing, and Joe Biden’s inauguration are likely to be top of the list for traders.
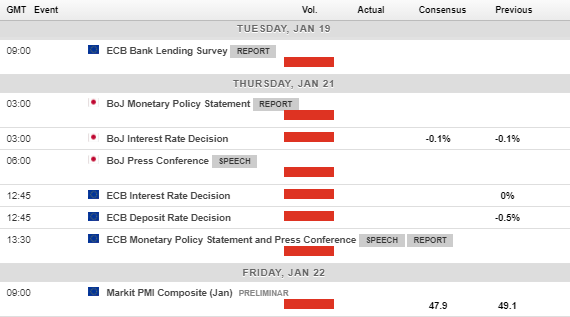
Source: Forexlive
The technicals surrounding Bitcoin (BTC) are dominated by an extremely large symmetrical triangle pattern, and a potential bullish reversal pattern.
Starting with the triangle pattern. According to this neutral price pattern, the expected range for BTC this week is likely to be within the $33,000 to $38,000 area before we see a breakout.
This either hints of more extended price consolidation this week or a breakout move either side of the triangle. One thing is for sure, we should expect a big directional move when this breakout finally occurs.
The potential bullish reversal pattern, or inverted head and shoulders pattern, will form if BTC reaches the $41,986 level. The pattern has huge upside potential, and is basically eluding to an eventual move towards $52,000. Although, I suspect we could see BTC closer to $55,000.
Looking at both sides of the trade. If BTC starts to falter this week below $33,000 then $30,000 becomes the natural downside target for bears. Under $30,000 and the downside could really accelerate for BTC.
Key support below $30,000 is found at $27,600, $24,400, and $20,000. They are worth mentioning, even though they seem unlikely targets at this stage.
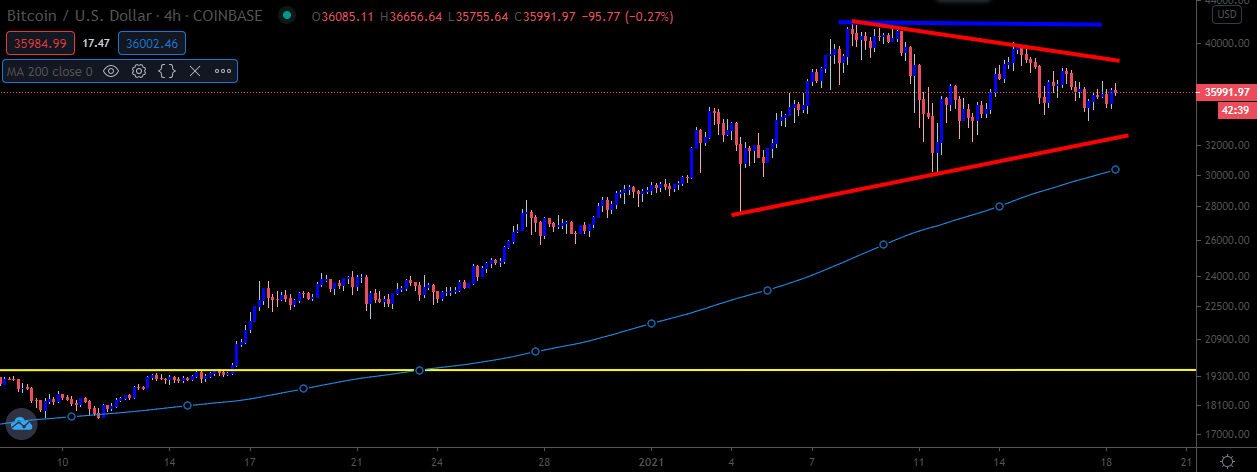
Source: Tradingview
Ethereum (ETH) is probably the most exciting top crypto at the moment for my money. A huge amount of positive on-chain activity is currently taking place, plus the technicals are fantastic.
Price action surrounding ETH is also very good, even after this weekend’s disappointing fade from $1,300. I am going to stick my head on the line here and say that ETH/USD could head towards $2,800 if we see the $1,400 resistance level overcome this week.
This may seem far-fetched, but there is without a doubt some huge technical clues on the charts that highlight that a massive move could take place if Ethereum crosses that magic $1,400 level.
As long as ETH/USD can hold above the $1,070 this week then bulls really do have a fantastic opportunity to position themselves for a big upside move. Once again, the bull case for ETH really does look good.
I am naturally cautious so I will stick in a caveat here. A sustained break below $1,000, then bears may try their luck and push ETH towards $860.00 one last time. It’s worth mentioning this scenario in case dip-buyers are looking for a solid pullback spot to enter into the prevailing bullish trend.
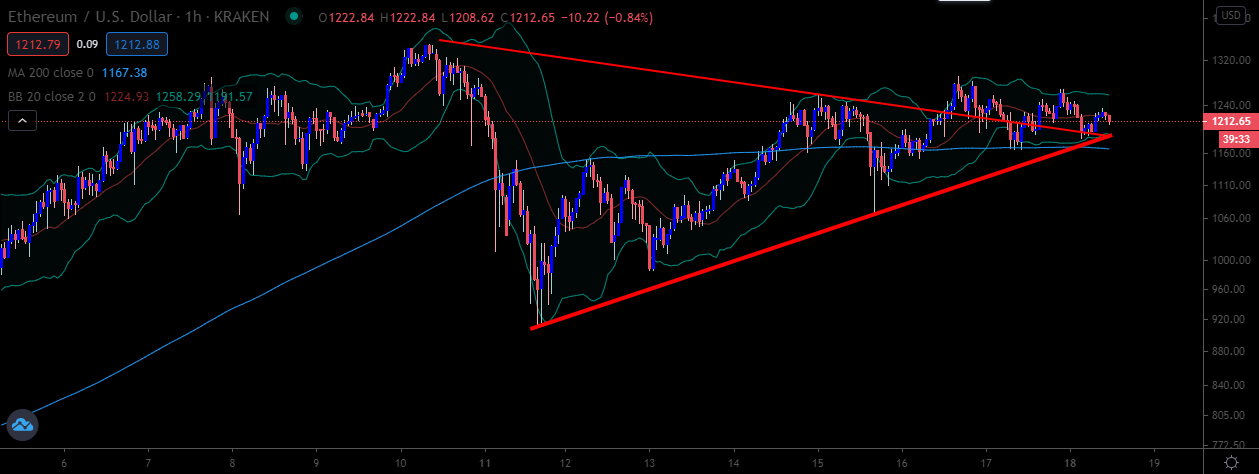
ETH/USD Weekly Chart
Source: Tradingview
