Rinse and repeat

Bitcoin buyers failed to build on upside traction last week, falling marginally short at the resistance around $20,000. The market fluctuated between risk-on and risk-off sentiments due to massive foreign exchange and bond volatility.
This week, risk-off trading sentiment appears to have prevailed in anticipation of a rate hike from the Fed. The Fed’s Funds Rate showed a 95 percent certainty that the U.S. The Federal Reserve would enact a 75 basis point rate hike at the upcoming policy and rate decision in early November.
There was some hope that the Chinese Communist Party would ease restrictions. However, Guangzhou, the southern Chinese manufacturing hub home to about 19 million people, reported 69 new infections for Sunday, pushing back hope that China is turning a corner. Goldman Sachs predicts that a gradual relaxation of Covid Zero is expected to start in the second quarter of 2023.
Additionally, even positive earnings from top U.S. companies such as Tesla and Netflix failed to ignite a bid in U.S. stocks. So far, the performance of 20% of companies in the S&P 500 index that reported their Q3 earnings has been below par. The Nasdaq-100 and the S&P 500 indices remained entrenched in a bear market.
Rising bond yields on the expectation of aggressive Fed action also hurt risk-on plays. The 10-year yields went above 4.25%, reaching their highest levels since 2008. Moreover, last week’s political events in the United Kingdom didn’t help with broader market sentiment.
This week, the bond market faces the threat of another sell-off due to instability in the Japanese yen. The economic calendar is also quite busy with third-quarter U.S. economic reports and the release of companies’ earnings.
Lastly, while the technicals have remained uneventful, some notable on-chain movements suggest that the market should find volatility shortly.
Canary In The Coal Mine
On Wednesday, the bond market yields moved to levels not seen since the 2008 financial crisis. The 10-year yield was staggering above 4.1% as the bond market looked braced for more aggressive Fed rate action.
One trader once told me that we need to pay attention to the bond market to understand what is really happening. He advised ignoring the foreign exchange market as it is more speculative and can be prone to exaggerated moves that don’t reflect the proper fundamentals of a country and its respective currency pairing.
For example, one could say that the USD/JPY pair is massively overvalued at the 150.00 level. Such one-sided moves have a nasty habit of eventually reversing sharply in FX. The Japanese government allegedly stepped in to support the falling Japanese by selling U.S. Treasuries for yen.
Since Japan is one of the biggest holders of U.S. Treasury bonds, a massive sell-off could create a lot of turbulence for risk-on assets. Lower bond prices lead to higher yields which start competing with equities and other risk assets like Bitcoin concerning expected returns.
This morning’s drop in yields suggests investors are flocking toward U.S. bonds as a potential hedge against an economic slowdown or deflation. For several reasons, bonds can help protect investors against an economic slowdown. The falling prices of gold this morning further confirm that risk-off sentiments may be ending.
However, much will depend on the Fed’s forward-looking statement about future interest rate hikes. If Fed members show an inclination towards a 50-basis point hike in December, equities and the crypto market will likely rise. But the threat of an acceleration in U.S. bond sell-off in Japan looms over the market as a prominent short-term risk.
Economic Calendar for the Week
Growth data is topping the economic calendar in the penultimate week before the November Federal Reserve meeting. The U.S. gross domestic product report from Q3 will be the big market mover this week. Remember that given the Fed meeting is not far, the “good news is bad news” trend should prevail with the GDP output.
The preliminary purchaser’s manufacturing index (PMI) data from the United States economy also arrives this week. I expect to hear the word recession being touted heavily this week if the manufacturing and service sector contracts again this month. On the bright side, failing industry demands may force the Fed to slow down on quantitative tightening.
The third-quarter earnings report of top U.S. companies like Meta, Apple, and Amazon are lined up for the week. However, so far, the earnings reports of American firms have failed to muster positive sentiments.
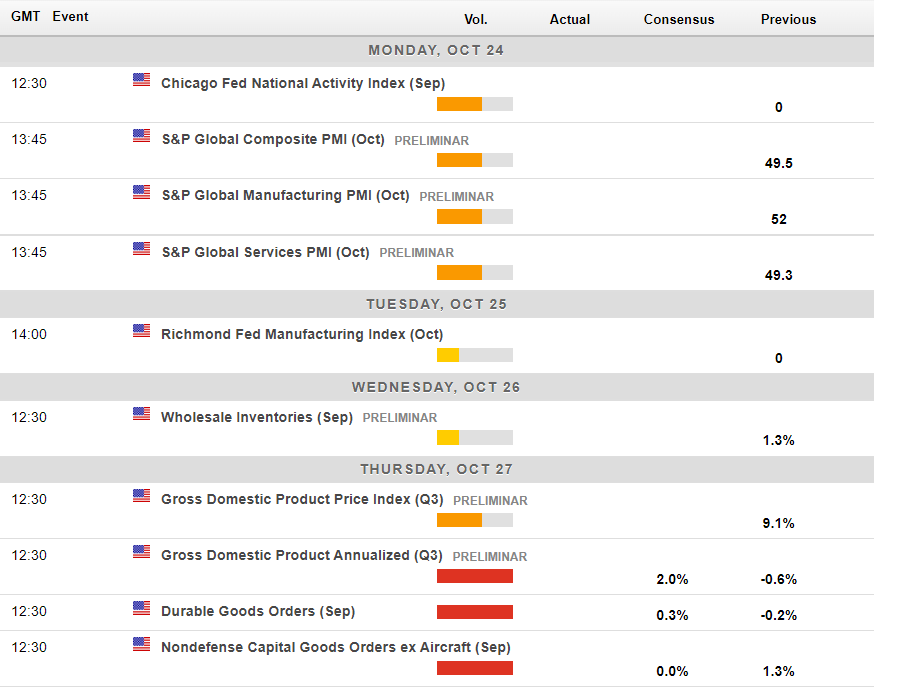
Economic calendar for this week (Source: Forexlive).
Notable On-chain Moves
Last week, there were notable on-chain movements which indicate that a short to medium term rally could be underway. However, buyers still need to build support above a crucial level to confirm this theory.
Bitcoin’s Coin Days Destroyed (CDD) metric marks the movement of long-term whales relative to the network’s transaction volume. The metric gives more weightage to coins that have been sitting idle for a long time.
CDD is the sum of all transactions’ individual CDD, which is calculated by taking the number of coins in a transaction and multiplying it by the number of days since those coins were last spent.
The CDD usually remains high (in blue) during positive trends as old coins move to book profits. At the same time, isolated spikes in the metric during bear markets have also signaled bottom formation in some previous instances (in purple).
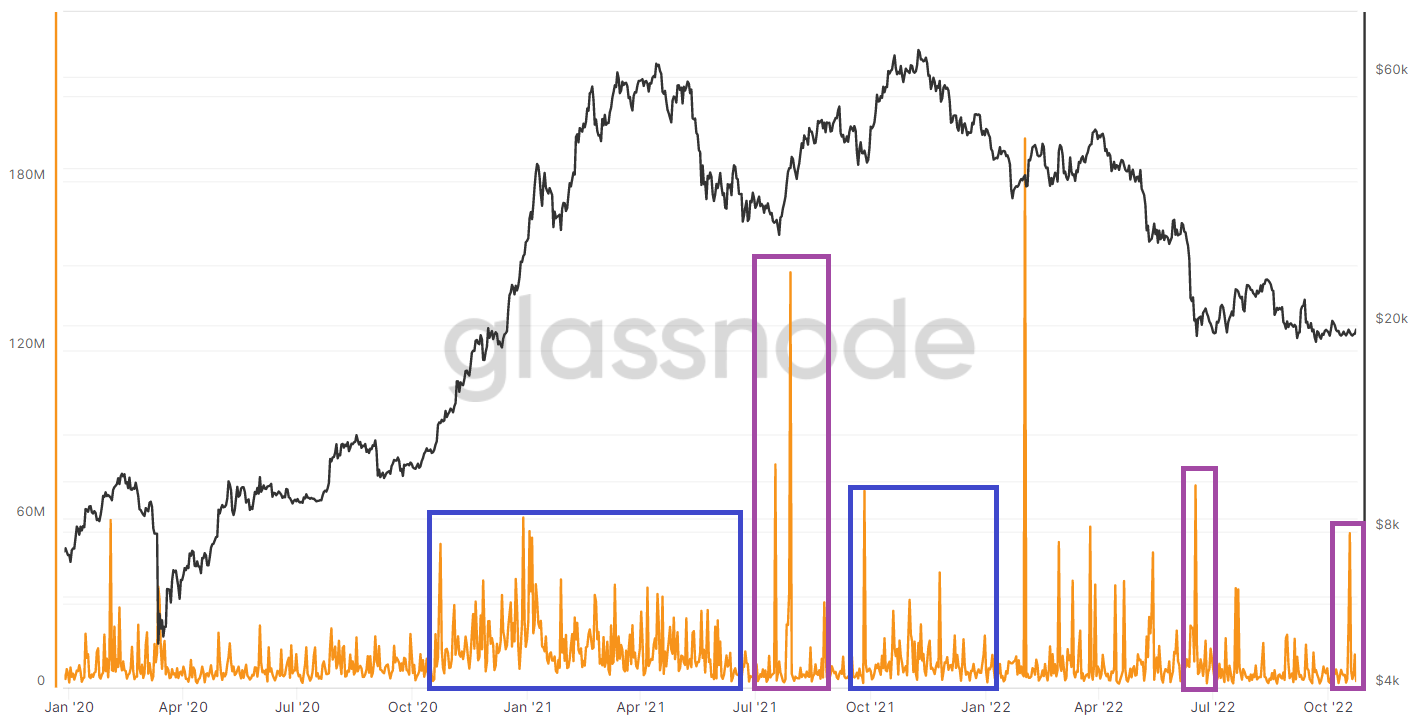
Bitcoin’s Coin Days Destroyed metric shows active movements of old, large wallets during bull markets, while isolated spikes (in purple) allude to a shift in momentum of large wallets (Source: Glassnode).
Considering the recent BTC price action, the metric alludes to possible local bottom formation. The theory of a short to medium-term rally is more plausible when you look at the exchange flow data. On the same day as the CDD spike, the BTC Netflow metric from exchanges recorded a four-month low, suggesting that investors withdrew BTC to self-custody wallets from exchanges.
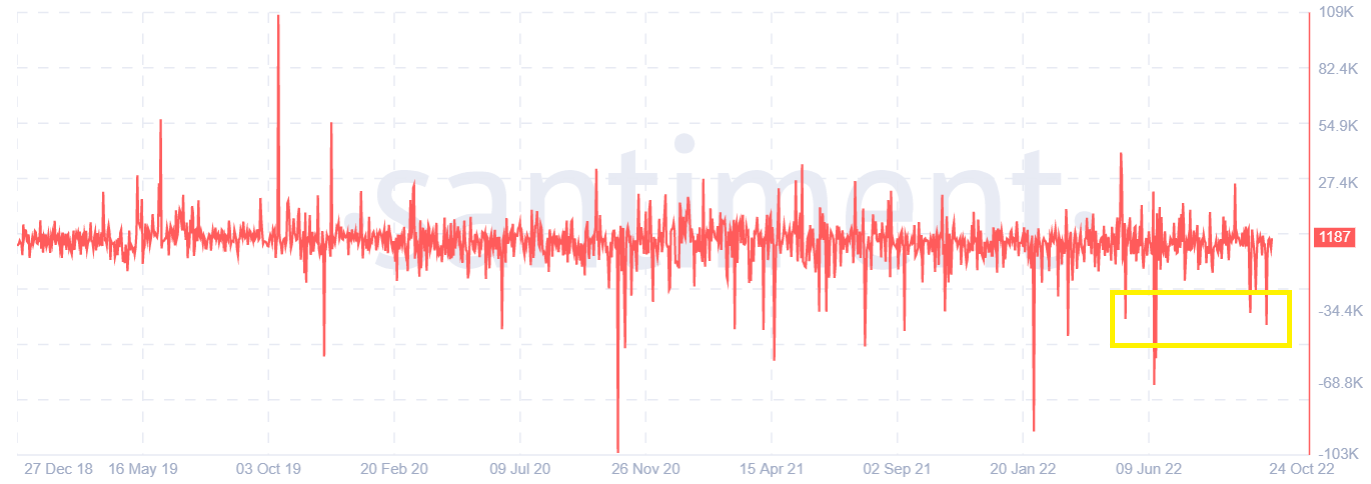
Bitcoin exchange flow balance indicator (Source: Santiment).
However, its confirmation will come from how the price moves around the $19,300 level, where the spike occurred. The event will likely be bearish if Bitcoin’s price stays below this level.
BTC/USD Head Scratching Price Action
Last week the volatility in the Nasdaq US100 and the S&P500 overtook Bitcoin’s, underscoring the lackluster trading range and head-scratching price action that we see in BTC and other cryptocurrencies.
Sadly, this week could be more of the same. In terms of meaningful trading action, trading will likely remain mute until we see the $18,000 to $20,400 price range broken.
This week’s pivot point for BTC/USD is around the $19,000 level. On the upside, buyers’ resistances at $19,900 and $20,400 remain crucial. I expect a test of $21,700 if a bullish breakout occurs.
Conversely, I expect a significant drop towards at least $16,400 if the $18,000 level is broken. The most prominent support levels below are $18,600 and $18,000.
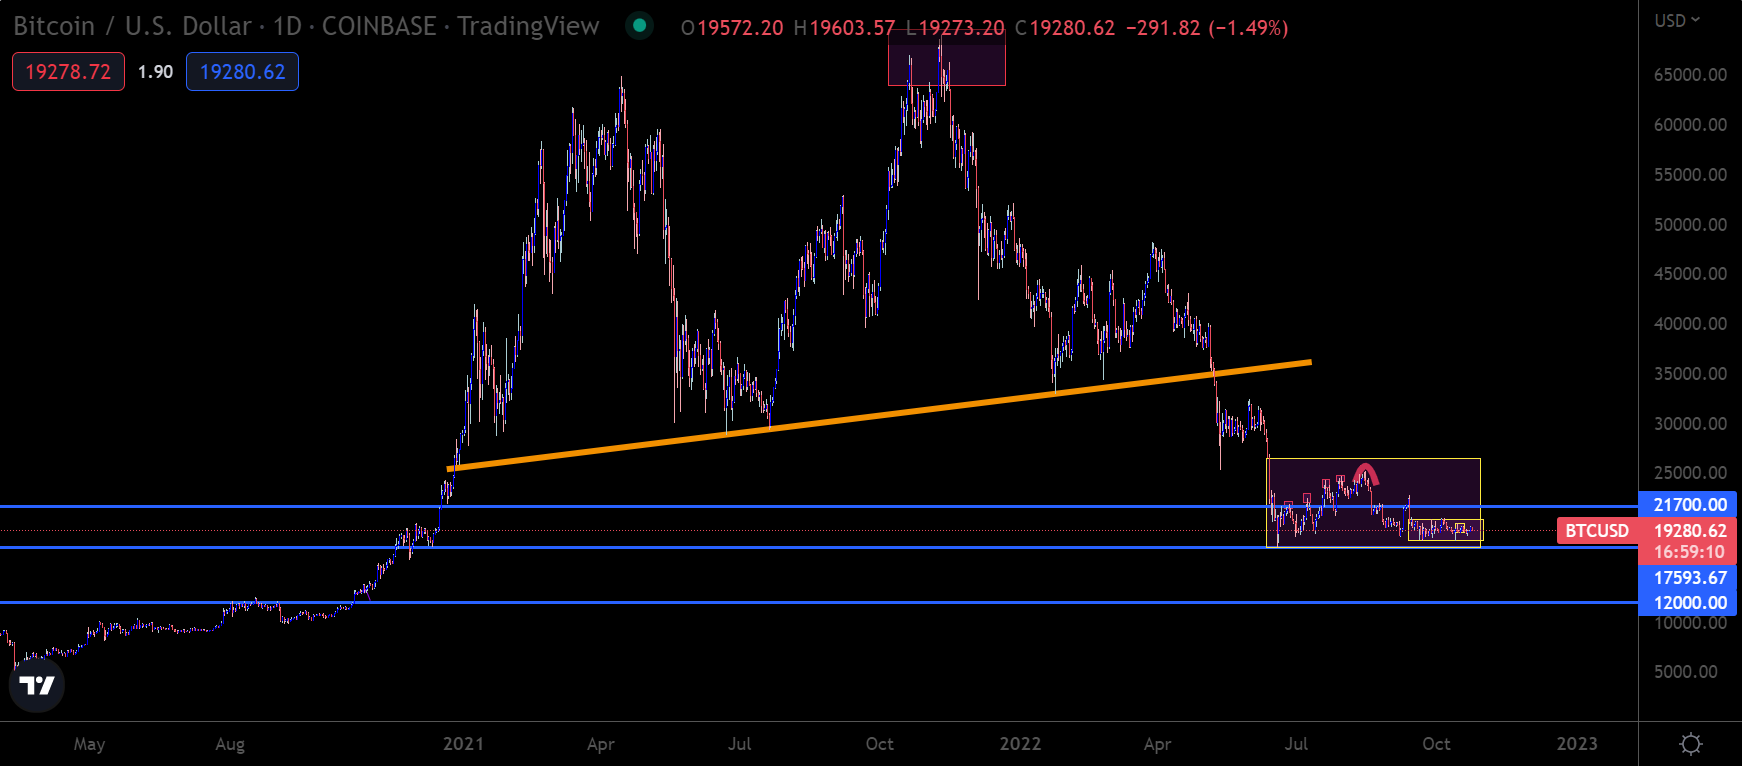
BTC/USD Daily chart (Source: TradingView).
ETH/USD Breakout Pending
Very little to report on the price action for Ethereum at the moment. I am afraid I must repeat myself in reiterating ETH’s weakening bull case while the price is capped under $1,420.
If we could define the range break to watch in the short term, I would suggest keeping a close watch on a deviation of the $1,190 to $1,420 level.
Should we see a bullish breakout above the $1,420 level, I would be inclined to consider the $1,550 to $1,580 price zone as an initial target. To the downside, I like $1,000 or even $900 is possible if the $1,190 level is breached.
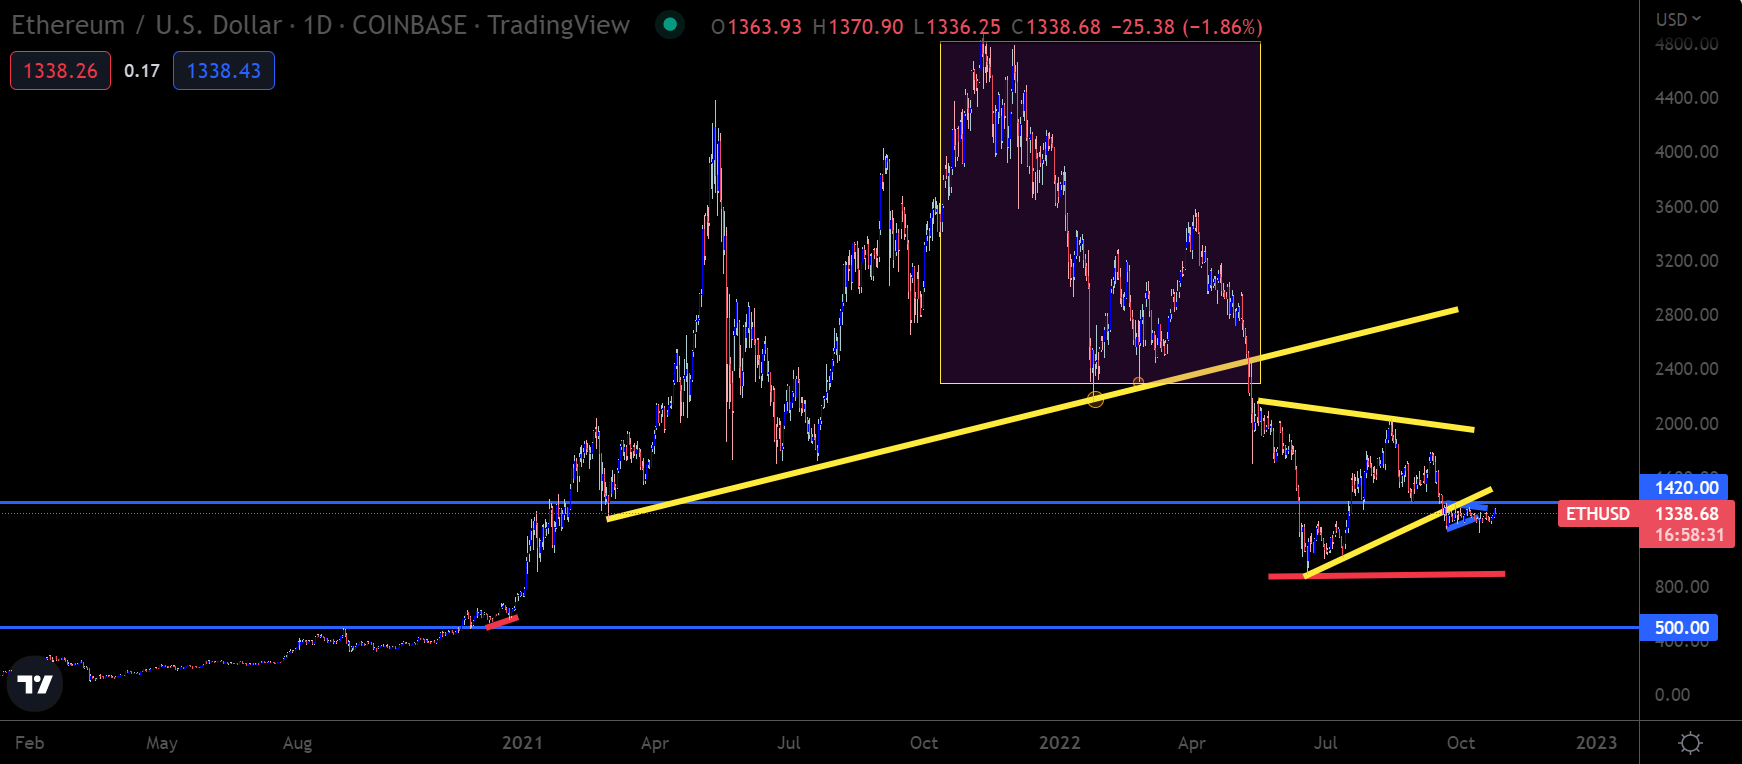
ETH/USD Daily chart (Source: TradingView).
Possible Upside in XRP/USD
Ripple could be a strong candidate for further upside if the broader cryptocurrency market increases over the next few weeks.
Should we see a resumption of XRP/USD buying over the next few weeks, then I like the idea that a challenge and eventual breakout of the October high at 0.548 could cause a final rally toward the $0.590 or $0.600 levels.
On the flip side, if we don’t see the crypto market rallying and a price top is already in, I feel that Ripple could be doomed for a pending price drop toward the $0.3300 area.
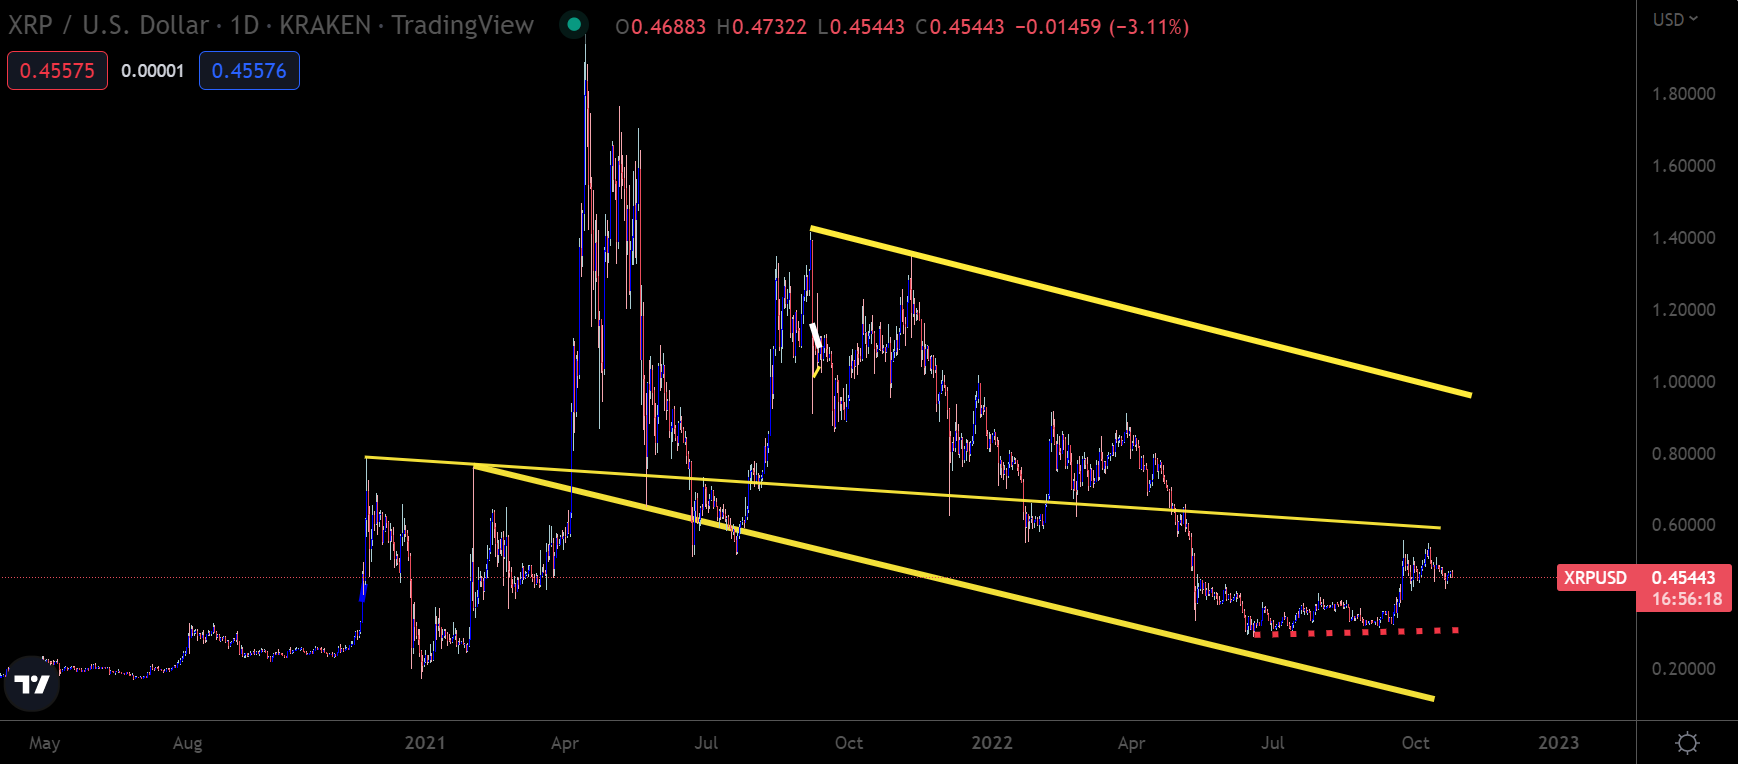
XRP/USD Daily chart (Source: TradingView).
Challenging Environment
The on-chain movements suggest that volatility may arrive soon, and price action will likely be positive in the short term. On the other hand, the macroeconomic climate will probably remain unclear until next week’s Fed meeting. The threat of U.S. Treasury bonds sell-off looms in Japan, which could cause a sell-off in risk-on assets like cryptocurrencies.
Many traders I have spoken to have switched to trading the foreign exchange and stock markets over recent months because the volatility has dried up dramatically in crypto land.
Time and time again, we have seen examples of crypto consolidating for months. When the break happens, we get a cycle of explosive volatility that is usually very tradable. However, until then, expect more of the same dull price action.
