Fed warnings

Bitcoin fell toward the $18,000 level last week after the Federal Reserve hiked interest rates by 75 basis points. Fed Chair Jerome Powell laid out hawkish rhetoric, projecting future interest rates and reiterating that his “main message has not changed since Jackson Hole.”
The market expects two 50-basis point hikes in November and December followed by smaller hikes in 2023. Powell has also raised expectations of a higher unemployment rate, adding to the fears of a looming recession. The stock market looked sluggish last week, with the Nasdaq and S&P index tagging yearly lows around the 11,000 and 3,650 levels.
Additionally, a U.S. judge ordered Tether to provide proof of assets backing USDT and accused the company of artificially pumping Bitcoin’s price. Tether has fought the U.S. authorities in the past. A new finding or decision against Tether could potentially rock the crypto market.
Elsewhere, Russia was seen undertaking a partial military mobilization against Ukraine. During his announcement of the mobilization, Russian President Vladimir Putin issued renewed threats of a possible nuclear attack.
The fears of continued war have overshadowed a positive development for crypto. Russian officials reportedly allowed cross-border cryptocurrency payments, possibly because of international sanctions. While still not a legal tender, with domestic payments still prohibited, the move should provide legitimacy to cryptocurrency trading outlets and increase awareness among Russian citizens.
This week began with considerable volatility in the traditional market. A new high in the U.S. dollar index against other currencies and a bond market crash point to further deterioration of the global economy. It will likely translate to weak stocks and cryptocurrencies.
On the positive side, Bitcoin has begun bottom formation based on investor holdings over time. However, consolidation during bear markets takes considerable time, and there’s still room for downside based on previous bottoms.
The Fed’s directive is the primary price driver for risk assets. While the crypto market held against sellers surprisingly well last week, bearish pressures are far from done.
Inflation & Unemployment
The unemployment rate has a massive impact on the Fed’s position with rates. After all, the White House has recently pointed to the strong U.S. job market to deject claims of a recession in the U.S. economy.
The American unemployment rate rose to 3.7% last month, marking the highest level since February. It also came in above market expectations of 3.5%. In the most recent Fed meeting, officials projected the unemployment rate rising to 4.4% next year. For the record, during the financial crisis of 2008, the U.S. employment rate hit 10%.
At the same time, the number of unemployed people increased by 344,000 to 6.014 million. The labor force participation rate increased to a five-month high of 62.4% in August, up from 62.1% in July.
Taking the above into mind, the job market still paints a positive picture. Thus, we can assume that the Fed will keep its foot on the rate hike pedal until unemployment sees a dramatic rise. In theory, that should mean U.S. rates are headed even higher. Given the current positive correlation between Bitcoin and risk assets, the short-to-medium term picture for Bitcoin looks grim. The only hope is that the price action shows signs of decoupling with the stock market.
GDP Watch
The week’s economic calendar is focused on the U.S. The final reading of the country’s Q2 gross domestic product results will drop on Friday. In July, a negative year-to-year growth of 0.6% in Q2 sparked recessionary fears.
However, the government argued against the recession rumor, citing a strong labor market and consumer sentiment. If the GDP improves, based on the Fed’s hawkish stance, the path of least resistance for stocks seems to be the downside.
On the other hand, it is hard to know which way the market will break if we see these numbers taking a dive. Recession fears could sink risk-on assets like Bitcoin and stocks. Alternatively, markets could pump on hopes of the Fed putting the brakes on rate hikes.
The dollar index against other currencies, DXY, is close to tagging initial bullish targets of 115 points. There is a possibility of a short-term correction; speeches from central bank leaders of Japan and the European Union will likely act as a negative catalyst for DXY this week.
DXY’s long-term target remains at 120, with a slight chance that 115 may be the top. The crypto market is expected to react in the opposite direction to the dollar.
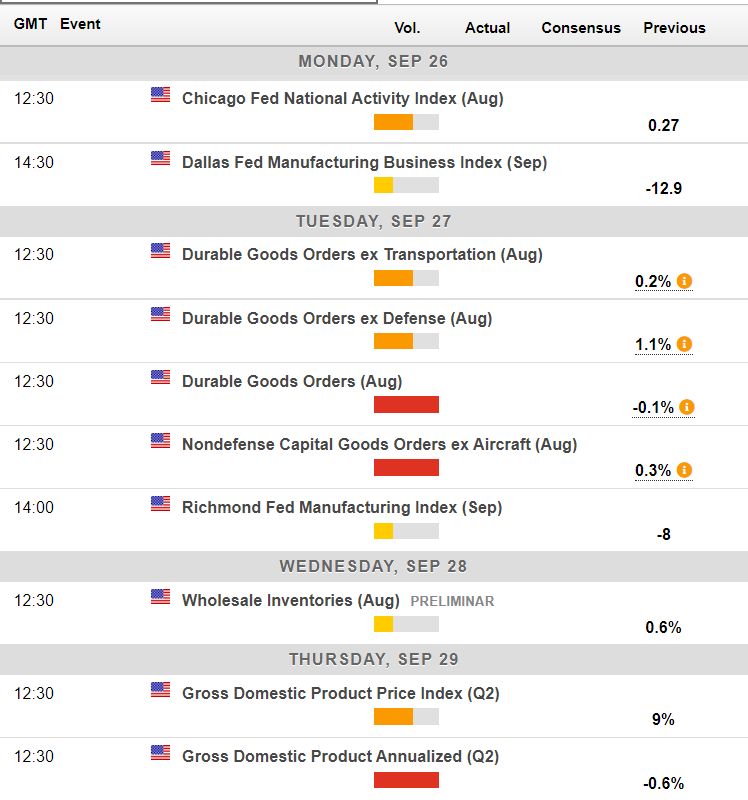
Economic calendar for this week (Source: Forexlive)
So Close, Yet So Far
The Realized Cap HOLD waves metric from Glassnode is alluding to the beginning of a bottom formation in Bitcoin. However, some pain could still lie ahead due to macroeconomic pressures and lack of positive catalysts.
The Realized Cap HODL waves represent the USD value created by holders over specific time periods based on the real USD value moving across the network. For example, a “1y-2y” age bracket with a value of 5% indicates that 5% of the Realized Cap USD value is derived from coins aged between one and two years old.
During bull markets, most of the value is derived from short-term holders. When the activity among short-term holders slows down, it usually signals the start of a bottom formation.
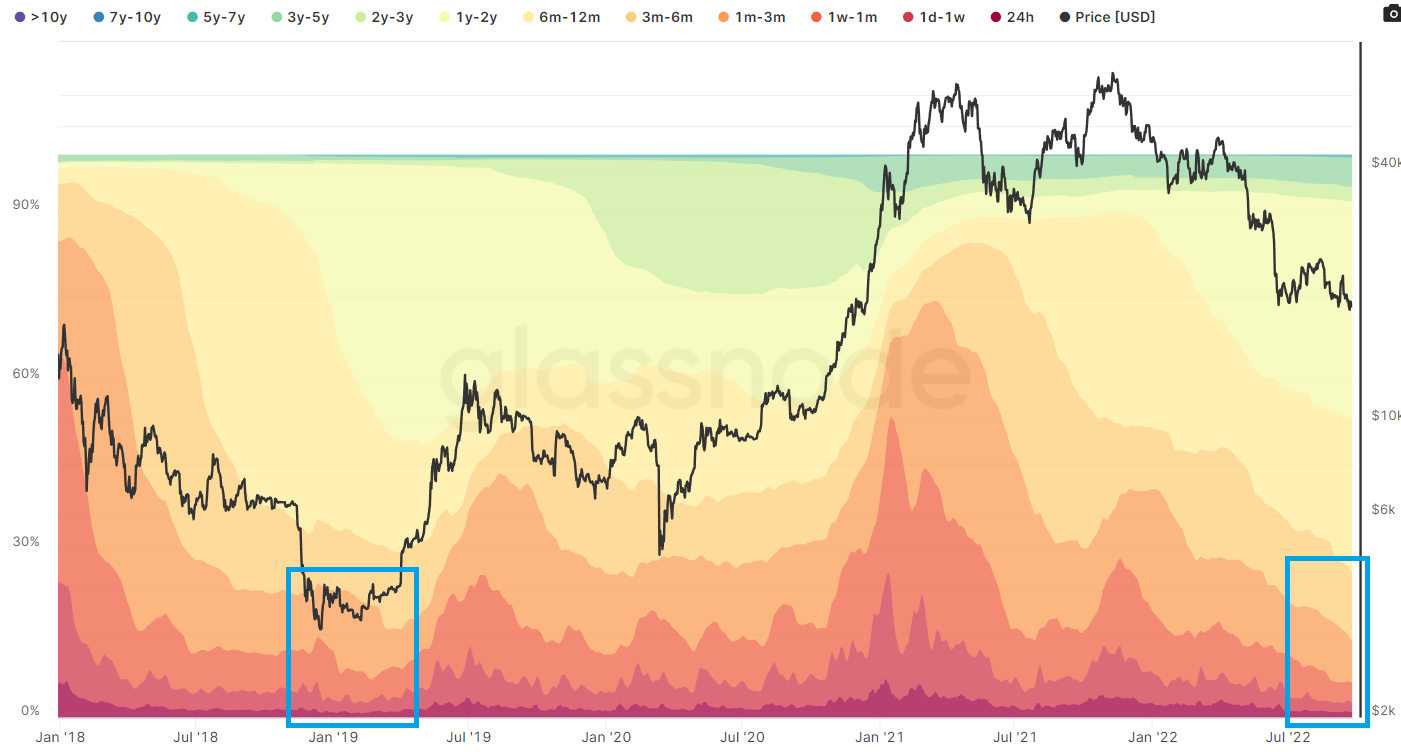
Bitcoin’s Realized Cap HODL waves (Source: Glassnode)
The Realized HODL Cap of holders in the zero to the three-month region is currently near all-time lows of around 14%. That validates the thesis that the June 2022 low of $17,600 could be the generational bottom for Bitcoin. However, we’re not out of the water yet. The accumulation near the bottom can go on for weeks with a lot of uncertainty.
Besides, the “6m-1y” holder group features strong hands, with 26% of Realized Cap versus 2019’s bottom 20%. This data point suggests that more pain or sideways action could be needed to flush out last year’s top buyers.
Additionally, due to the macroeconomic weakness, many investors have moved their Bitcoin to exchanges, as seen by the rise of exchange balances since the start of September. It increases the risk of a Bitcoin sell-off from holders that deposited to exchanges in the short term.
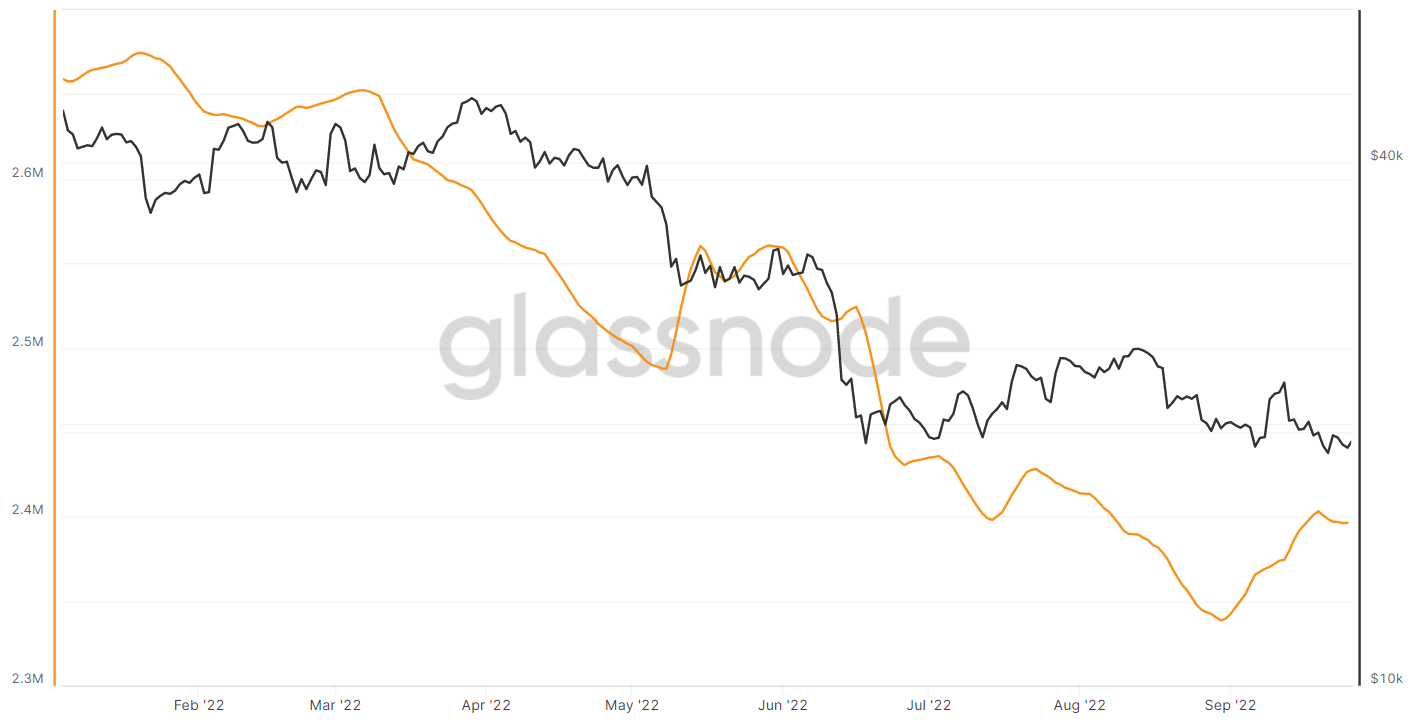
Bitcoin exchange balance (orange) and price (black) (Source: Glassnode)
Based on on-chain chain movements, Bitcoin has entered long-term bottom formation levels. However, this period could last for an extended period, with sellers attempting to push the price lower towards the $12,000 level in the interim. Investors should expect a last leg lower or more sideways action below over the next few weeks.
Bitcoin’s Decision Time
Over the last week, buyers have helped Bitcoin’s price hold above $18,000. This gives the top crypto a chance to decouple from the mainstream trend and find its independent price path.
I suspect Bitcoin will eventually turn lower and make new yearly lows if the macroeconomic situation remains unchanged. However, the chance certainly exists for a temporary rebound toward the $21,000 resistance zone.
This week’s key to a directional breakout will be a breakout from the $18,000 to $20,400 price range. Once we see a confirmed break of that range, its price should stage a $1,000 to $1,500 move.
Should sellers break below the $18,000 level, I will be looking for a test of the $16,000 level, with an eventual expectation that Bitcoin may fall toward the $12,000 area.
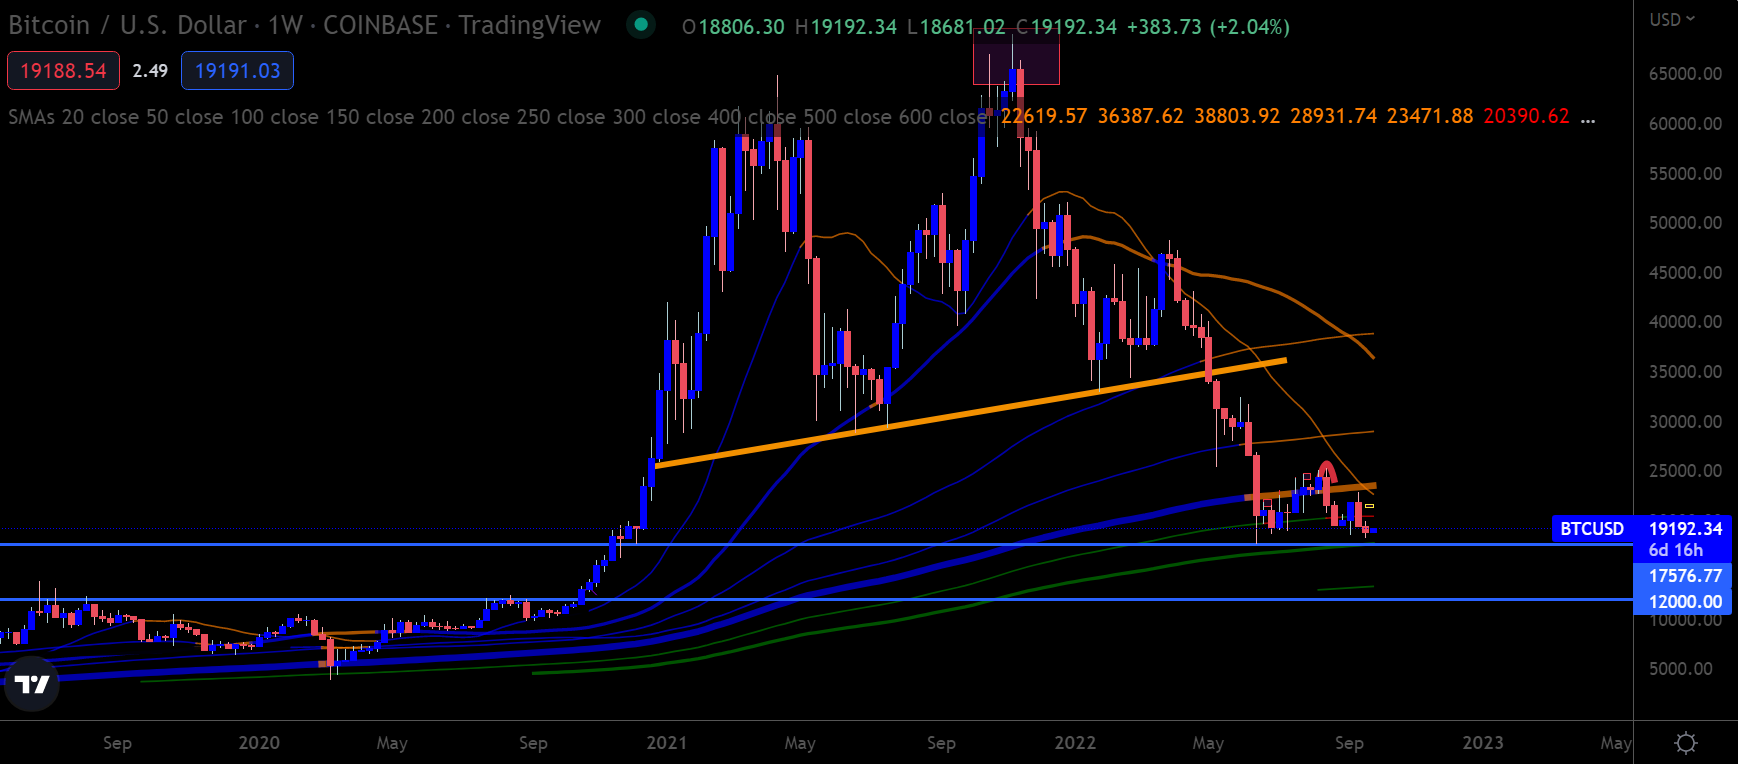
BTC/USD Weekly chart (Source: Trading View)
Ethereum Buyers in Danger
The technicals for Ethereum look bearish while the price continues to trade under the 2017 trading high at around $1,420. I have highlighted this critical technical price zone many times over recent weeks.
Now that two consecutive weekly closes are below the $1,420 level, it suggests lower prices ahead. The expectation is that the ETH/USD pair will test the $1,000 level before reaching $2,000.
If we see a price rebound in cryptos this week, I would be surprised to see ETH/USD pair trading much above $1,580 resistance before the next major leg lower begins.
I remain bearish on ETH and expect a test back toward the $800 support. Controversially enough, I would look at a further 30% decline in ETH/USD if this level were to break.
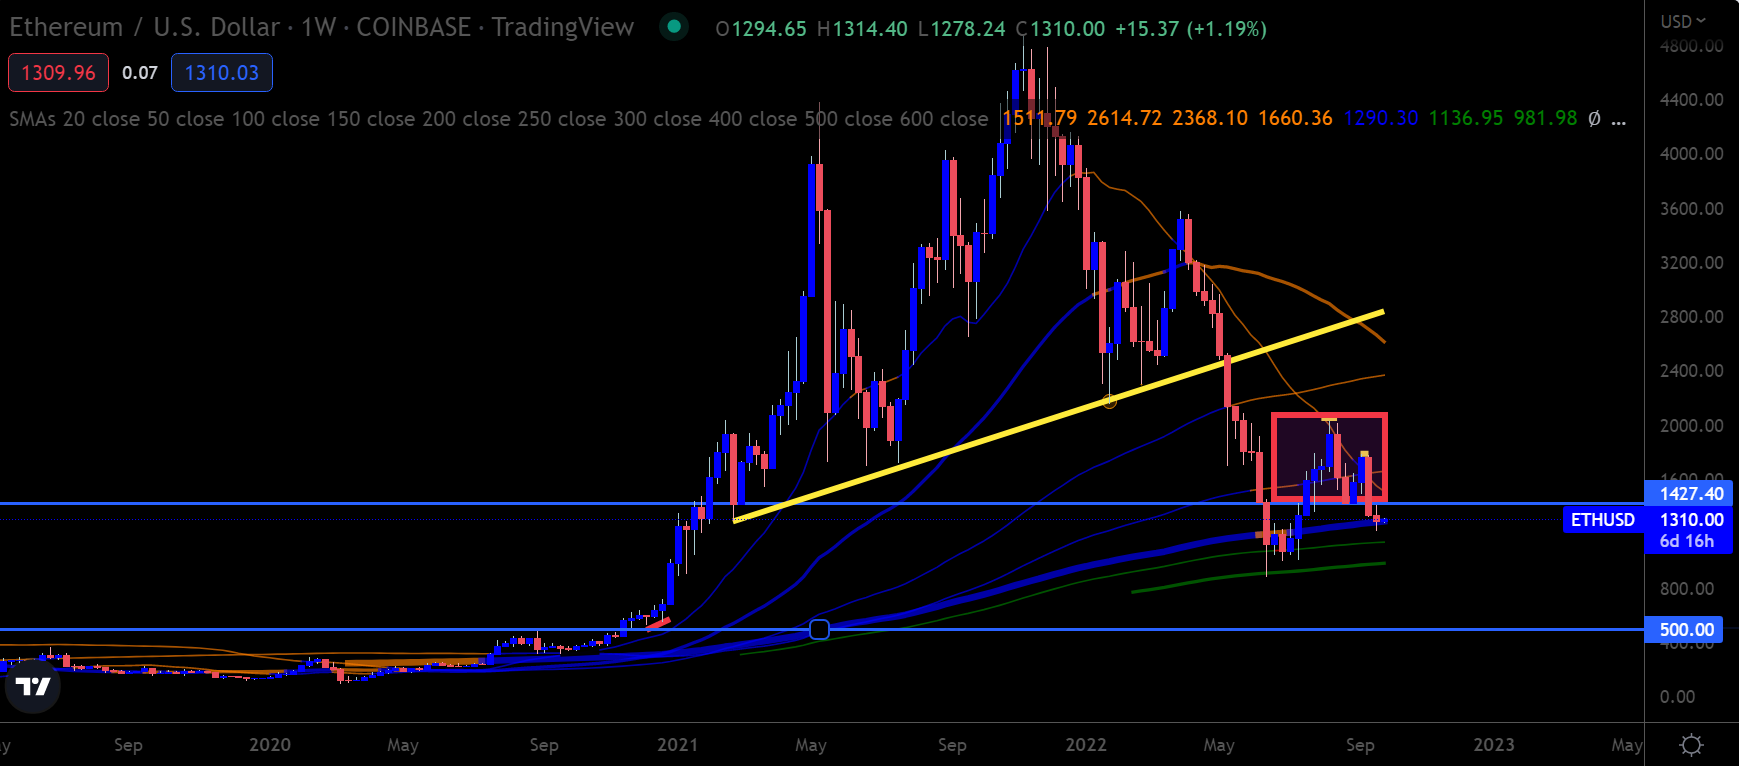
ETH/USD Weekly chart (Source: TradingView)
The XRP Wild Card
Ripple staged a solid breakout last week. The price action probably surprised many traders who were expecting lower prices based on the broad market trend and got caught on the wrong side of the trade due to the positive news from Ripple’s ongoing legal battle.
If we look at the tepid buying volumes behind the price surge, and the fact that the entire crypto market is engulfed in a bear trend, I would not be surprised if sellers erase the entire upward move.
On the flip side, if XRP/USD breaks above the $0.5500 level, XRP could potentially inch toward the $0.5900 to $0.6000 resistance zone before the expected reversal commences.
A break under the $0.3900 support level will probably confirm a bearish breakout, paving the way for new 2022 lows.
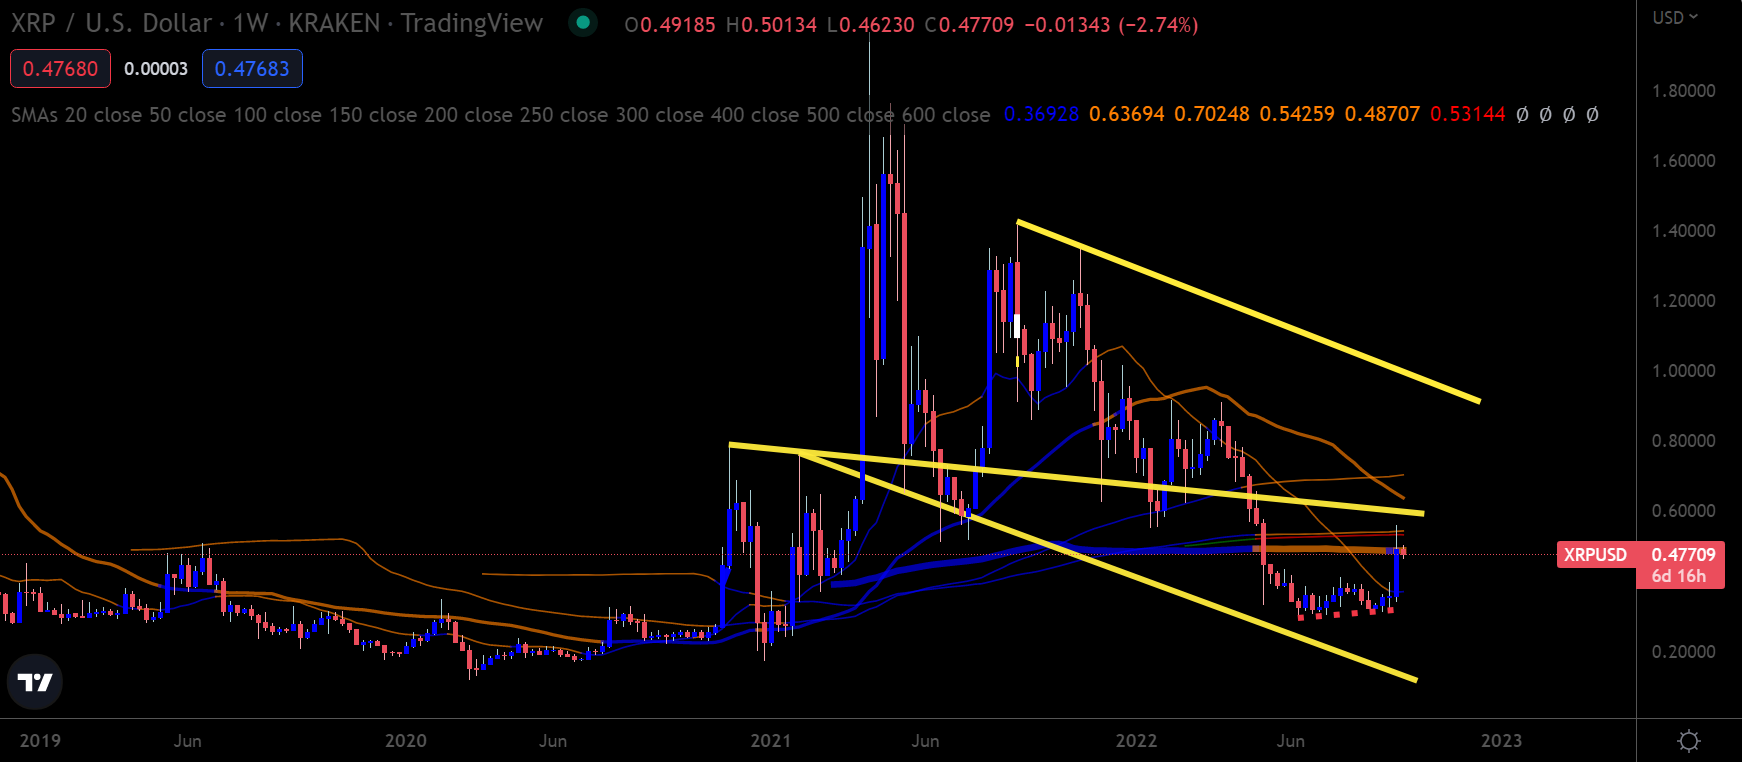
XRP/USD Weekly chart (Source: TradingView)
Chaos Theory
“Utter chaos” is probably a good word to describe what is currently happening in traditional markets. Wild swings in foreign exchange markets, bond prices, and stocks paint a grim image of the economy.
Honestly, I am astonished at the low volatility environment in the cryptocurrency market given what is happening around the globe, both fundamentally and geopolitically. This week, I expect a breakout from Bitcoin’s parallel range.
If the breakout is to the upside, I will remain skeptical of a meaningful rally and expect eventual reversal. That’s because I see little reason to believe that the Fed will reverse its hawkish stance anytime soon.
