Bulls return

Bitcoin buyers staged a strong recovery from the $19,000 support level last week, as both equities and crypto traders looked past the red hot June Consumer Price Index (CPI) print from the U.S. economy. To fill the macroeconomic void in the market, the Ethereum merge narrative took center stage after the announcement of a tentative date.
On Wednesday, BTC came under pressure after the June monthly CPI number came in at 1.3% higher month-to-month, while annual CPI headline number hit 9.1%—0.3% higher than expected value. This was yet another 40-year high in the United States Consumer Price Index.
However, both the equities and crypto market faded the news as the week based on the assumption that this was likely the peak. Large accumulation of short orders over the last couple of weeks is also a contributing factor to the surge.
News that Celsius Network filed for bankruptcy protection added some clarity in the market. While the move by the centralized lender is bad for its customers, the filing revealed that Celsius only has $167 million in cash, alleviating fears of a sell-off.
Things really started to take off during the weekend after a lead Ethereum contributor announced Sept. 19 as the target date for the merge to Proof of Stake (PoS) on the mainnet. With two months to deadline, this event is likely to lead market sentiments and induce volatility as well.
Forward-Looking Tendency
Before we discuss the bullish factors, let’s revisit the macroeconomic situation to understand why the market is acting against the trend of falling prices with higher inflation. A higher CPI print implies that on July 27, the U.S. Federal Reserve may impose a 75 (or possibly 100) basis point hike in benchmark interest rates, which is bad for stocks and crypto.
However, last month’s developments, such as lower oil prices and a steep decline in consumer confidence, hinted that inflation may have peaked. The Fed has already brought interest rates between 2.25% to 2.5%; an additional 0.75% would be detrimental to global trade. But remember that the markets are forward-looking. The investors expect the Fed to slow down the hikes in the coming months to avoid the risk of throwing the economy into a recession. Thus, buyers are likely to arrive in anticipation of that.
Last but not least, the accumulation of short order over the last couple of weeks in anticipation of higher inflation is creating an opportunity for buyers to leverage it with a short-squeeze.
Currently, the stock market is riding the wave of higher earnings from crucial firms in the S&P 500 index. While the economic situation remains dire, higher earnings and a slowing in inflation create a potential bottom signal from which traders might be looking to leverage. The uptrend in stocks has supported crypto buyers as well.
The economic docket is relatively quiet this week. The release of manufacturing and jobs data from the United States economy will be significant given the FED’s constant watch over important domestic macro data.
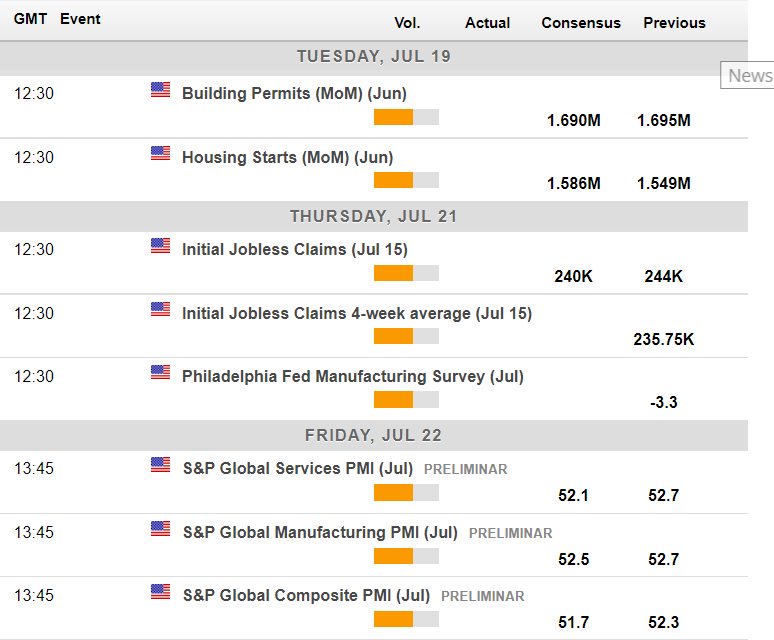
Economic calendar for this week. Source: Forexlive
A Local Bottom
The previous two bear markets, i.e., the fall from peak to the bottom, lasted for 408 days and 364, respectively, in 2014 and 2018. This time around, the BTC price hit its potential bottom of $17,600 in 223 days since reaching an all-time high of $69,000.
Given that the 2018 bear market was comparatively shorter than the first one, there will likely be fewer days until the bottom. However, four months faster seems like a bit of a stretch. Plus, the longer the bear market, the stronger the accumulation and the consequent uptrend.
The above raises suspicion about the chances of a full-fledged bull run. Remember how many times Bitcoin jumped above support from $6,000 in 2018? This brings us to one of my favorite on-chain bottom indicators: Percent Supply in Profit.
The reason behind my likeness to this indicator is simple. It marks the level of maximum pain in the markets. Let’s start with Bitcoin. The indicator hit a 22-month low of 52%, with Bitcoin’s decline below $20,000. Notably, it’s still above previous lows when the percentage of supply in profit reached 40% (2020) and 41% (2018).
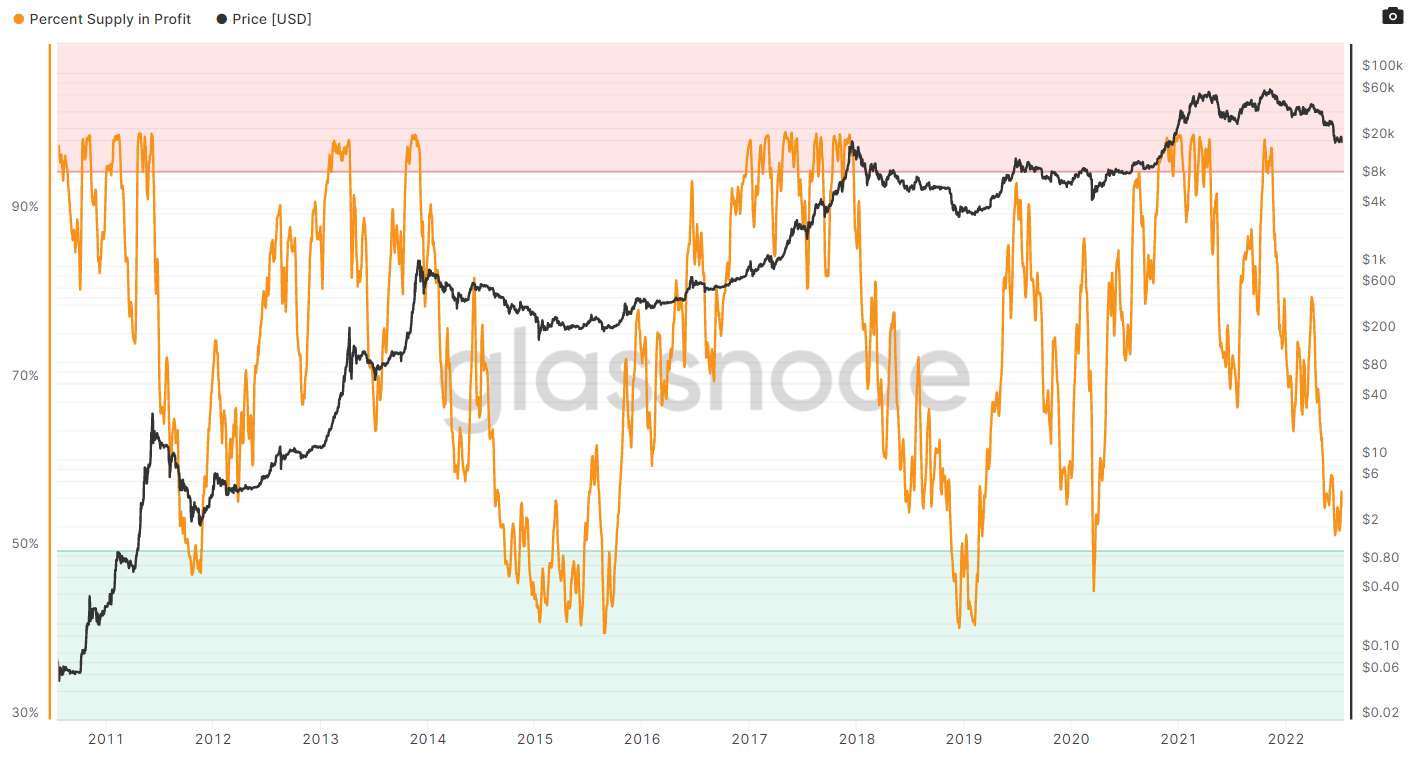
7-day Moving Average of Percent Supply in Profit. Source: Glassnode.
The downside potential for Ethereum is even more. Currently, 45% of the supply is in profit, whereas, previously, it reached lows of 27% (2020) and 23% (2018). There is a strong chance that the market will inflict similar pain levels during this bear cycle. Thus, it might pay to exercise caution at current levels.
In the short term, ETH is likely to take out the liquidity levels at $1,700. However, to think it can reach peak levels above $4,000 again will be pretty immature at such an early stage.
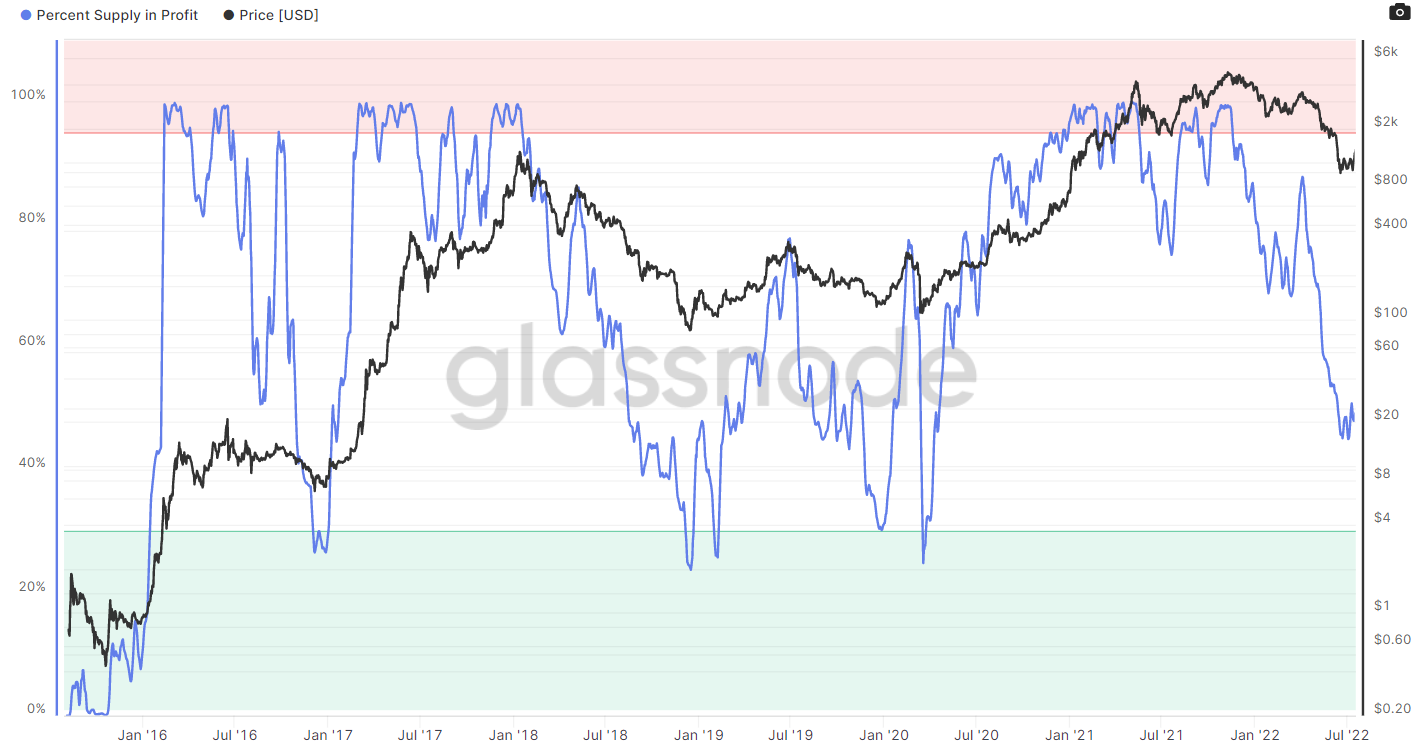
Percent Supply in Profit. Source: Glassnode
With the Proof of Stake (PoS) merge narrative taking precedence, Ethereum has entered a volatile phase. Until Sept. 19—the proposed merge date and the absence of bullish catalysts for Bitcoin, Ethereum will likely lead the price action. It might be helpful to follow the ETH/USD and ETH/BTC price action to better understand the short-term moves in the market.
BTC Looks Bullish
Technically, one of the more exciting developments for Bitcoin was the emergence of a new buy signal from the PI Cycle Bottom indicator. The PI Cycle Bottom indicator has been one of the most accurate in Bitcoin’s history.
PI cycle indicators are developed by tracking arbitrary moving averages that have proven successful over the past. The bottom indicator comprises a 471-day simple moving average (SMA) multiplied by 0.745 and a 150-period exponential moving average (EMA). The crossover of the 150-period EMA above the larger period SMA signals a buy.
Previously, the market bottomed within three days of the crossover event. The July 13 buy signal was the first in the last four years, raising the possibility of a potential bottom and buyer sentiments.
It should be a critical week ahead for Bitcoin if the price starts to advance, as it will validate the signal’s accuracy. However, if Bitcoin continues its downtrend, the PI Cycle bottom indicator becomes another metric that failed to work in 2022, like the 200-week moving average.
In the short term, though, Bitcoin is looking bullish from a technical standpoint this week as sellers failed to make a new low last week below $19,000. Bears have had their chance, and despite their best efforts, it’s now time for bulls to try to take charge.
For the short-term bull case to come to life, we need to see an upside break of the $19,000 to $22,500 price range. Should we see a successful attempt to break the range, I think Bitcoin could surprise the market.
How high could Bitcoin surge? I think the BTC/USD pair could make a quick run towards the $24,000 level, possibly $25,250. Notably, the above targets are only possible if Bitcoin breaks above the 200-week MA, currently at $22,700.
If the upside case fails, it is probably a simple case of a back-to-the-range low of $19,000. A move under this level could be a disaster for the bulls, and $16,500 becomes achievable.
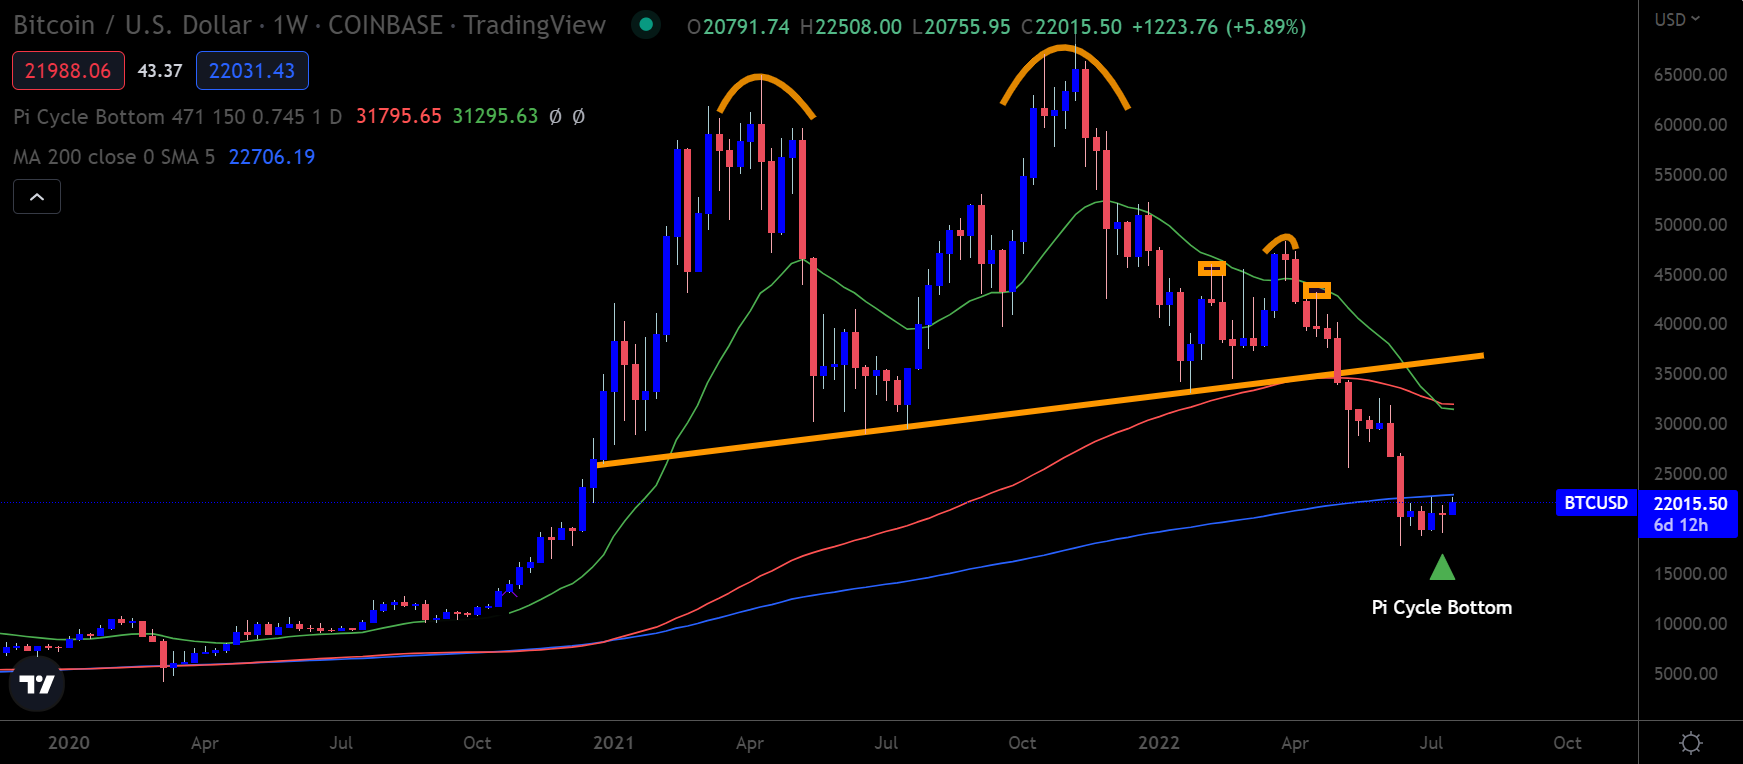
BTC/USD Weekly chart. Source: Trading View
ETH Merge and Rally
The news surrounding the upcoming Ethereum merge caused the ETH/USD pair to react positively. Last week’s run higher was a good indication of how traders are potentially positioning themselves for it.
With this bullish catalyst in the background and the fact that Bitcoin could be about to break out of its range above $22,500, it is possible that Ether will be a leading gainer over the coming weeks.
This week, ETH/USD needs to break above the $1,500 level for the uptrend to play out. If that were to happen sustainably, not just momentarily, my short-term upside targets for ETH/USD will be $1,650 and $1,800.
You always have to chart the downside in trading to know your exit points. My exit point for the ETH/USD pair would be the $1,000 level. Weakness under here and another significant leg down is possible.
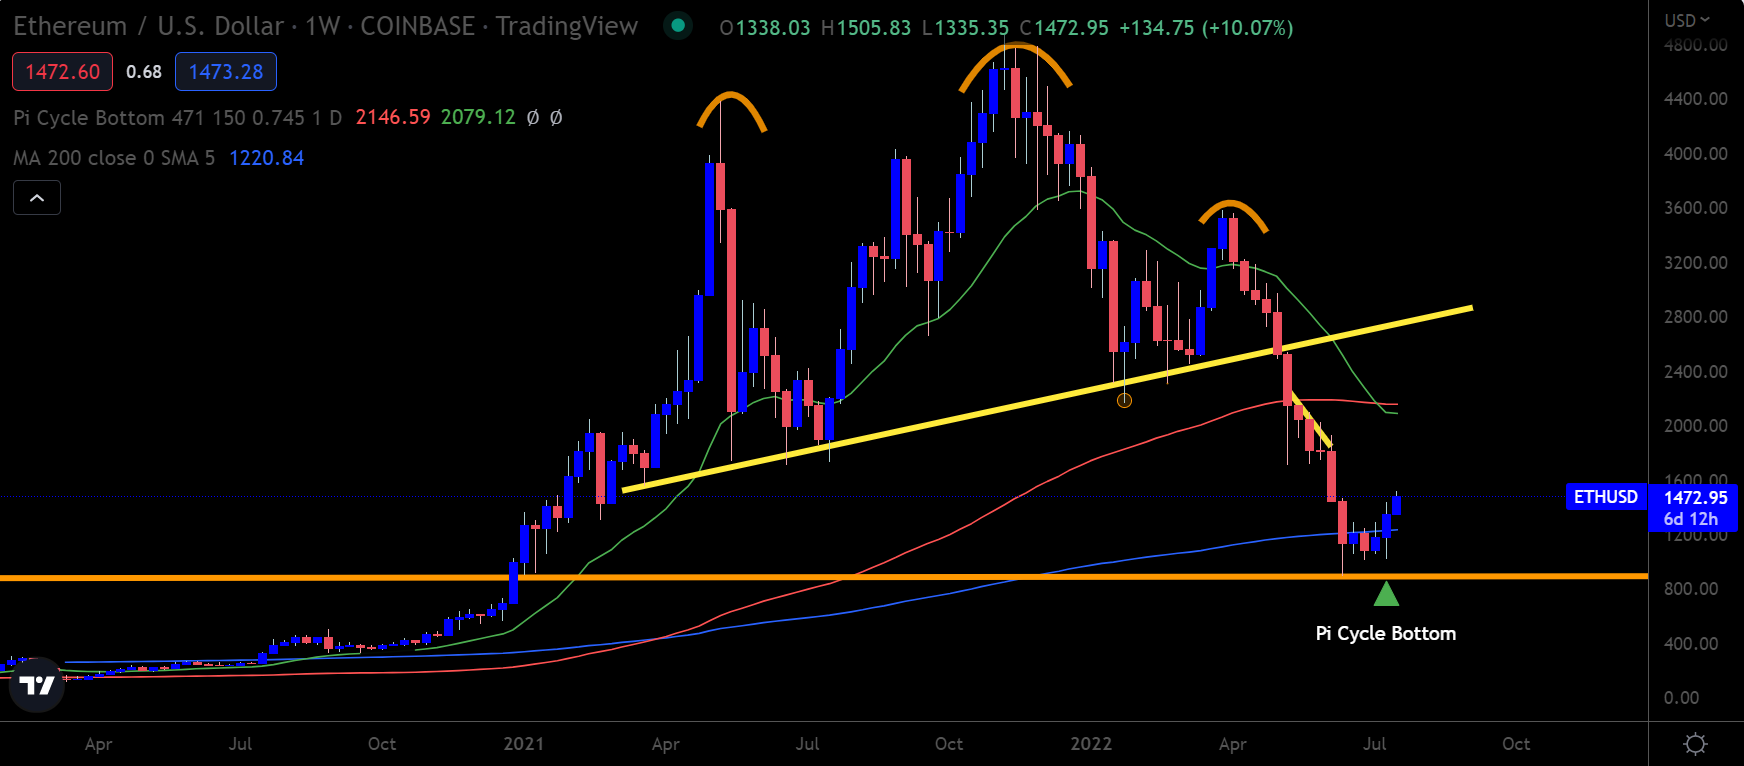
ETH/USD Weekly chart. Source: Trading View
XRP Breakout
Ripple is starting to exhibit some signs of life after losing considerable market value this year. The price action surrounding XRP/USD suggests that lift-off could be about to commence.
The XRP/USD pair generated a buy signal from the PI Cycle Bottom indicator a month ago on June 11; it was well before Bitcoin. Based on the low that followed the event, the local bottom for XRP was $0.287.
If the XRP/USD pair can stay above the $0.3300 support level this week, we could see a lift-off towards the $0.4000 level. The surge could be much higher if the rest of the market is bullish.
Lastly, I want to note that XRP/USD is trading considerably lower than its 200-week moving average, currently at $0.5. It provides much room for XRP to advance before it reaches a significant resistance level.
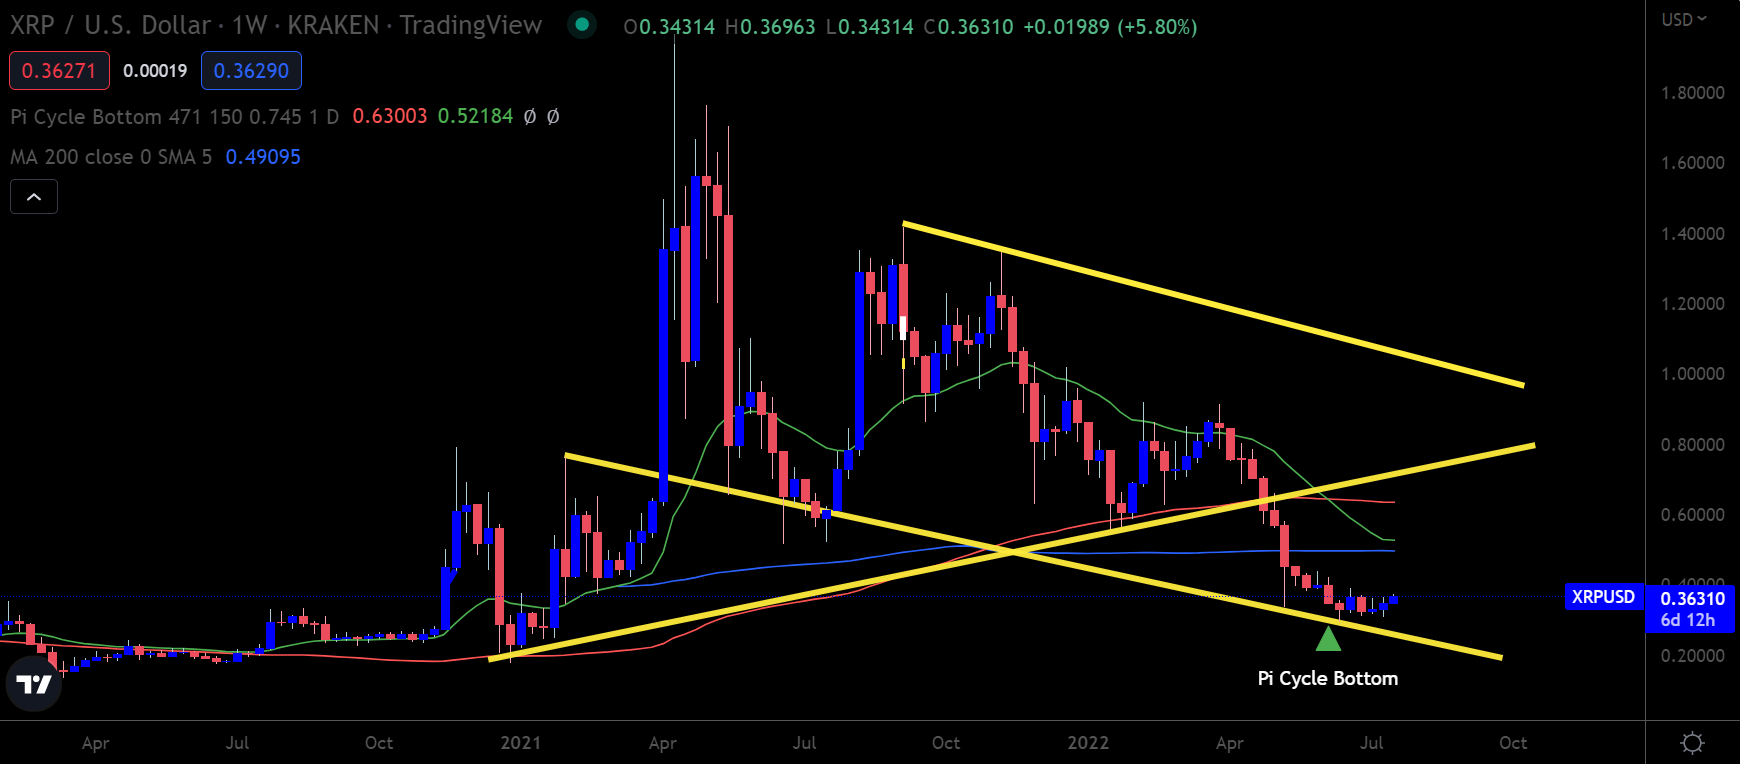
XRP/USD Weekly chart. Source: Trading View
Room For Optimism
Based on last week’s bounce back in risk-on assets, there is certainly ample room for optimism this week. I think cautiously bullish is a perfect way to summarize my feelings to date.
Due to the protracted downtrend in the crypto market this year, it would take a fearless person to say with all certainty that the crypto market will reverse its trend and head higher. However, I do prefer that the possibility exists now for more gains.
I want to finish by saying that this year has been challenging for traders who were not on the short side. Many traders have also been confused by the market and the price action this year. As most traders become comfortable with the bear trend, the chances of massive spikes led by short-squeeze and disbelief are common. I have my fingers crossed that we might see a rewarding period for buyers, shortly.
