Bear market rally

The crypto market started last week on a grim note as the U.S. Treasury Department sanctioned Ethereum mixer Tornado Cash for allegedly supporting money laundering worth $7 billion. The Bitcoin price dropped briefly below the $23,000 level.
However, the price rallied sharply after July’s U.S. Consumer Price Index print came in at a year-over-year increase of 8.5%, lower than the previous month’s peak of 9.1%. The Producer Price Index or wholesale purchasing index in July also turned negative for the first time since early in the pandemic.
These numbers strengthened the “peaking inflation” theory, which would, in turn, put pressure on the U.S. Federal Reserve to slow monetary tightening. Adding to that, the recessionary fears amplified with an increase in jobless claims. The simultaneous rise in the Nasdaq-100 index confirmed the bullish sentiments towards risk assets from a macroeconomic perspective.
The coming Ethereum Merge in mid-September is the leading narrative within the crypto space. The optimism about a pump on a successful merge and the additional ETHW “airdrop” is keeping the buyer pressure intact. However, the market’s positioning reveals that a “sell-the-news” type of event is likely after the merge .
Crypto Regulations and Global Macro
Let’s weigh the implications of last week’s significant events, namely Tornado Cash sanctions, and U.S. inflation print.
The Tornado Cash sanctions matter to the markets because it could possibly blacklist thousands of ETH wallets that ever received funds from an account associated with Tornado Cash. A number of DeFi applications like Uniswap, Oasis and Balancer have also agreed to adhere to Fed’s guidelines and share user address details with them.
Moreover, it raises the question of how far the authorities can go to curb these activities. We cannot rule out the possibility of a crackdown on other DeFi applications, and custodied stablecoins like USDC and USDT. Rune Christensen, the founder of popular DeFi outlet MarkerDAO, recently pushed for conversion of $3.5 billion USDC collateral to ETH to protect against regulatory and centralization risks.
With the uptrend in prices, the markets seem to have forgotten about Tornado Cash for now. However, another arbitrary action by the Treasury Department can revive the ghosts of centralization anytime.
Secondly, the “peaking inflation” theory is carrying risk assets higher on the optimism that the Fed would ease quantitative tightening.
This period of bullish optimism should continue up to the Fed’s Jackson Hole meeting on August 25-27, where the central bank would chalk out its rate policy for September and Q4 2022. Uncertainty around the Fed’s refusal to slow down monetary tightening may induce some risk towards month end.
Energy prices also need to do their part and remain low to help the “peak inflation” narrative hold any weight over the coming weeks and months. I have noticed that Bitcoin and the US Nasdaq-100 start to back off when energy prices rise.
After a minor deviation at the start of the month, Bitcoin appears to be strengthening its correlation with the stock market and global trends again. The technical chart of Nasdaq-100 projects a 1,000-point upside this month, which should create upward pressure on Bitcoin.
This week, the economic calendar is relatively quiet, with the U.S. Retail Sales headlining the docket. Retail Sales are notoriously volatile, so any market reaction could quickly fade. But knowing the timing of the release could be particularly helpful for scalp trading.
Besides the retail numbers, the minutes from the Federal Open Market Committee meeting in July will release On Wednesday. Should the minutes reveal the inclinations on the size of the next rate hike from Fed members, it could act as a strong market mover for the markets.
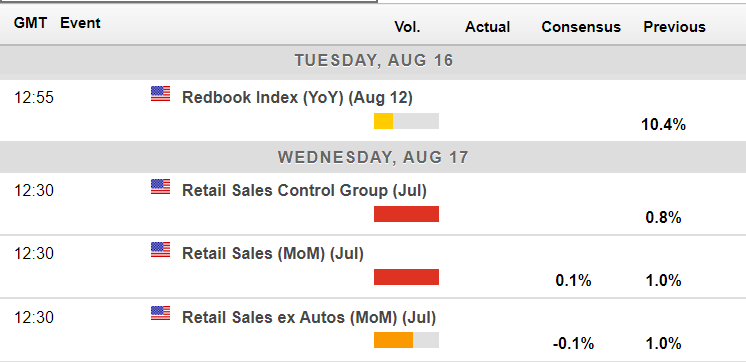
Economic calendar for this week. Source: Forexlive
The Ethereum Merge Trade
The options market is bullish on Ethereum and neutral to slightly bullish on Bitcoin.
The Ethereum Merge narrative is seeing an increase in the derivatives trading volume for ETH over BTC. The ETH options open interest volume surpassed BTC for the first time last week.
The positioning of the ETH options market leading up to the Merge shows extensive call options with strike prices ranging above $2,000 to $5,000. The put/call ratio for August is 0.78, while that of September is 0.29, indicating a higher demand for September call options.
The maximum pain price for September expiration, where most options contracts would expire out-of-the-money, is $1,400. The overcrowding may see market makers and option sellers trying to push the price down.
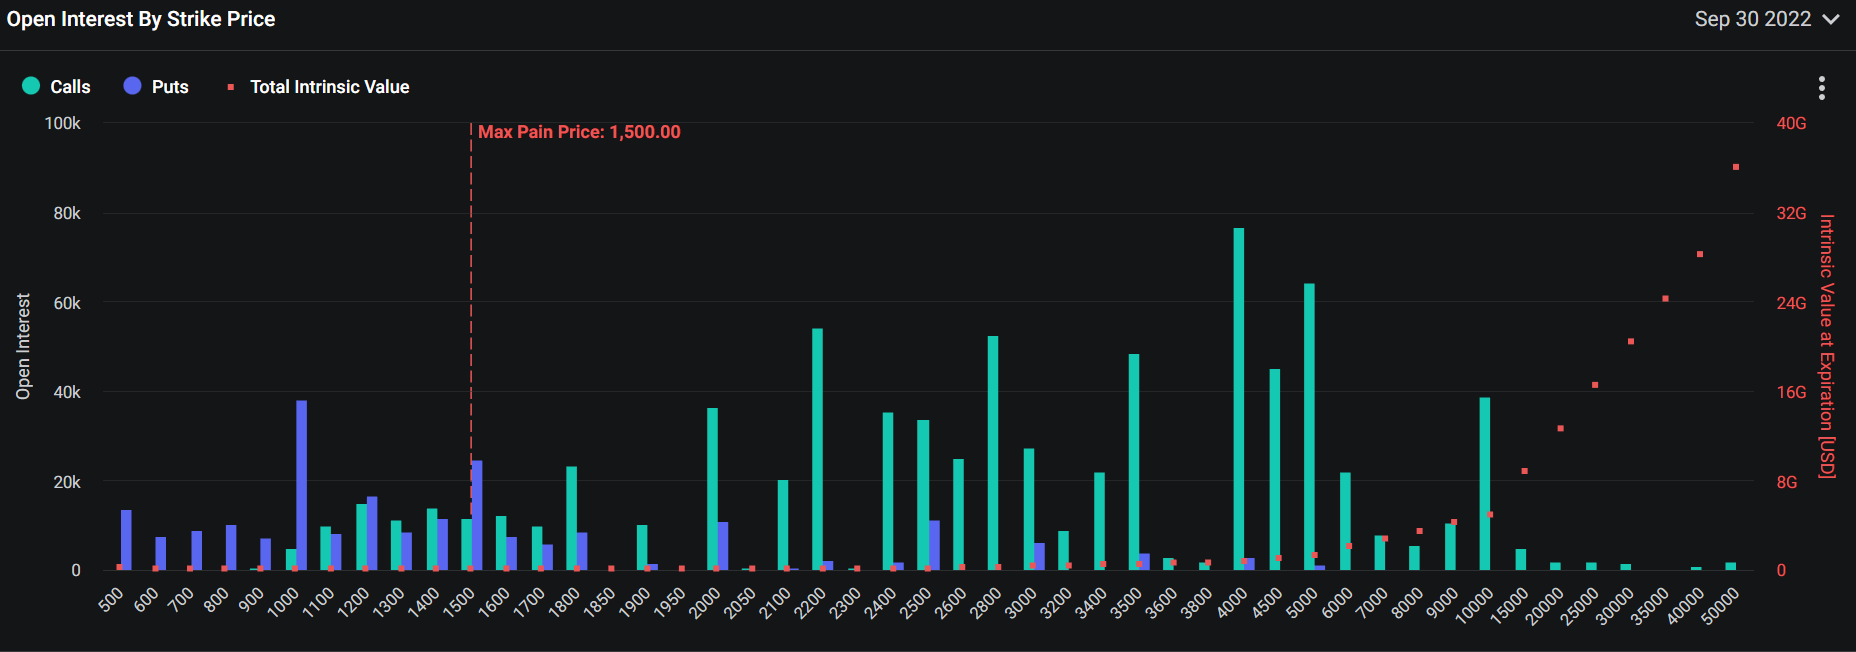
Ethereum options expiration for September. Source: Deribit.
On the other hand, Bitcoin’s put-to-call ratio for September is more balanced than Ethereum, around 0.55. Given Ethereum’s near 100% surge since July driven by the Merge hype and crowded call options volume, a long position in BTC sounds less risky than ETH at the moment.
The on-chain supply distribution data for Ethereum reveals buying positive addition in whale addresses, which is a positive sign for buyers. Holders with a balance between 10,000 to 100,000 ETH and 100,000 to 1 million ETH aggressively added to their position at the start of this month. This can be attributed to the Merge narrative and the possibility of an ETHW airdrop due to a fork.
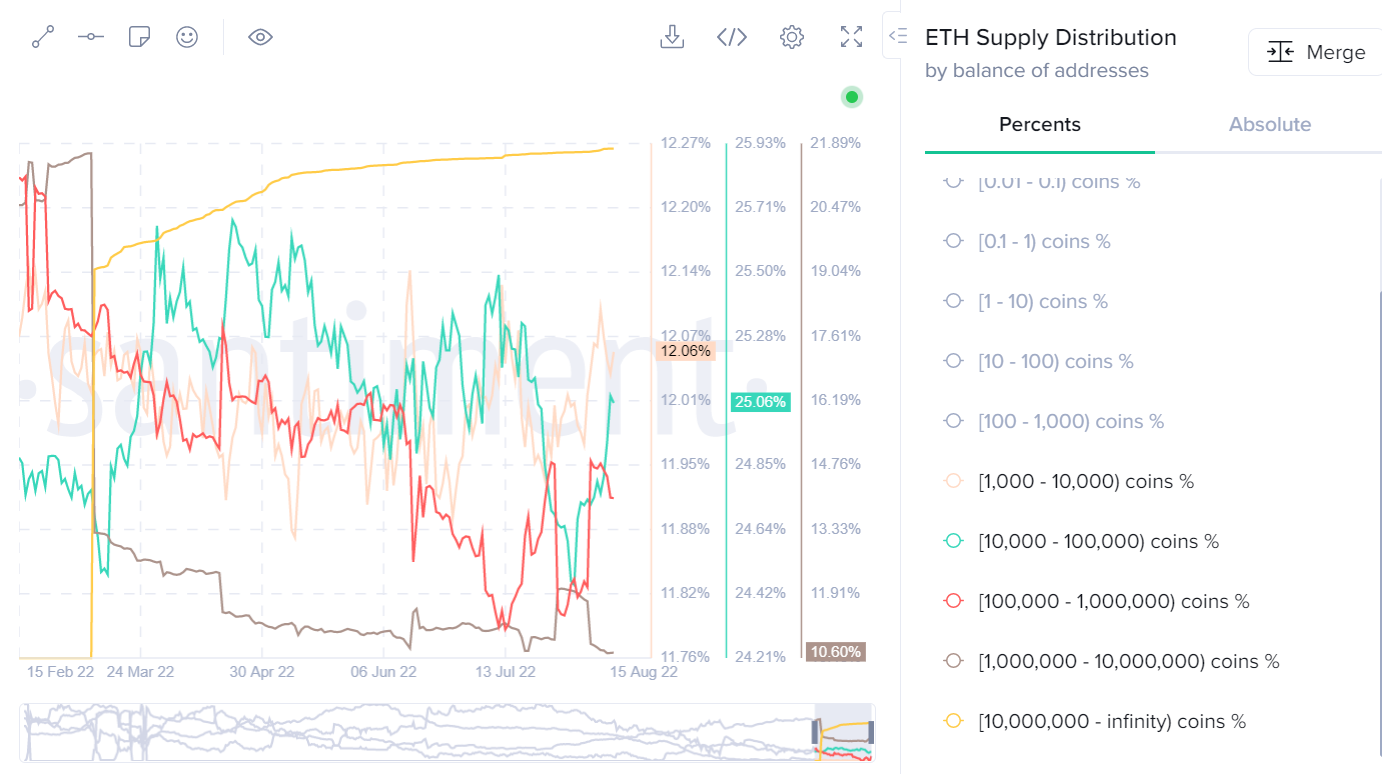
ETH Supply Distribution. Source: Santiment.
The spot buying activity is currently motivated by the additional balance of ETHW tokens on the Proof-of-Work chain, and options traders are betting on the Merge hype. This may fade after the event. The market’s positioning suggests a “sell the news” price action is likely.
BTC: All About $25,000
Subscribers to SIMETRI and my PRO BTC Trader newsletter will know that I have been looking for Bitcoin to rally to $26,500 for some time. The final hurdle this week appears to be the $25,000 level.
Technically, Bitcoin has been doing everything perfectly, despite the lackluster nature of the move higher over recent weeks and its constant struggle with the benchmark $24,500-$25,000 resistance zone.
My chart currently suggests that the path of least resistance is still higher. I expect to see the next leg higher in BTC if daily prices close above $25,000 for a few consecutive periods.
This is the point where I believe longs will add to positions. Trading breakout momentum has not been working so well lately, so technical traders do need to see confirmation before entering new buy positions. If this happens, then I believe we will finally see $26,500 plus achieved.
Charting the downside is also necessary. Ideally, buyers would want the $23,500 support to hold. Further weakness below $22,800 support would be a bearish sign this week. I prefer to see some strengthening above $25,000 by Tuesday to secure the bull side for BTC.
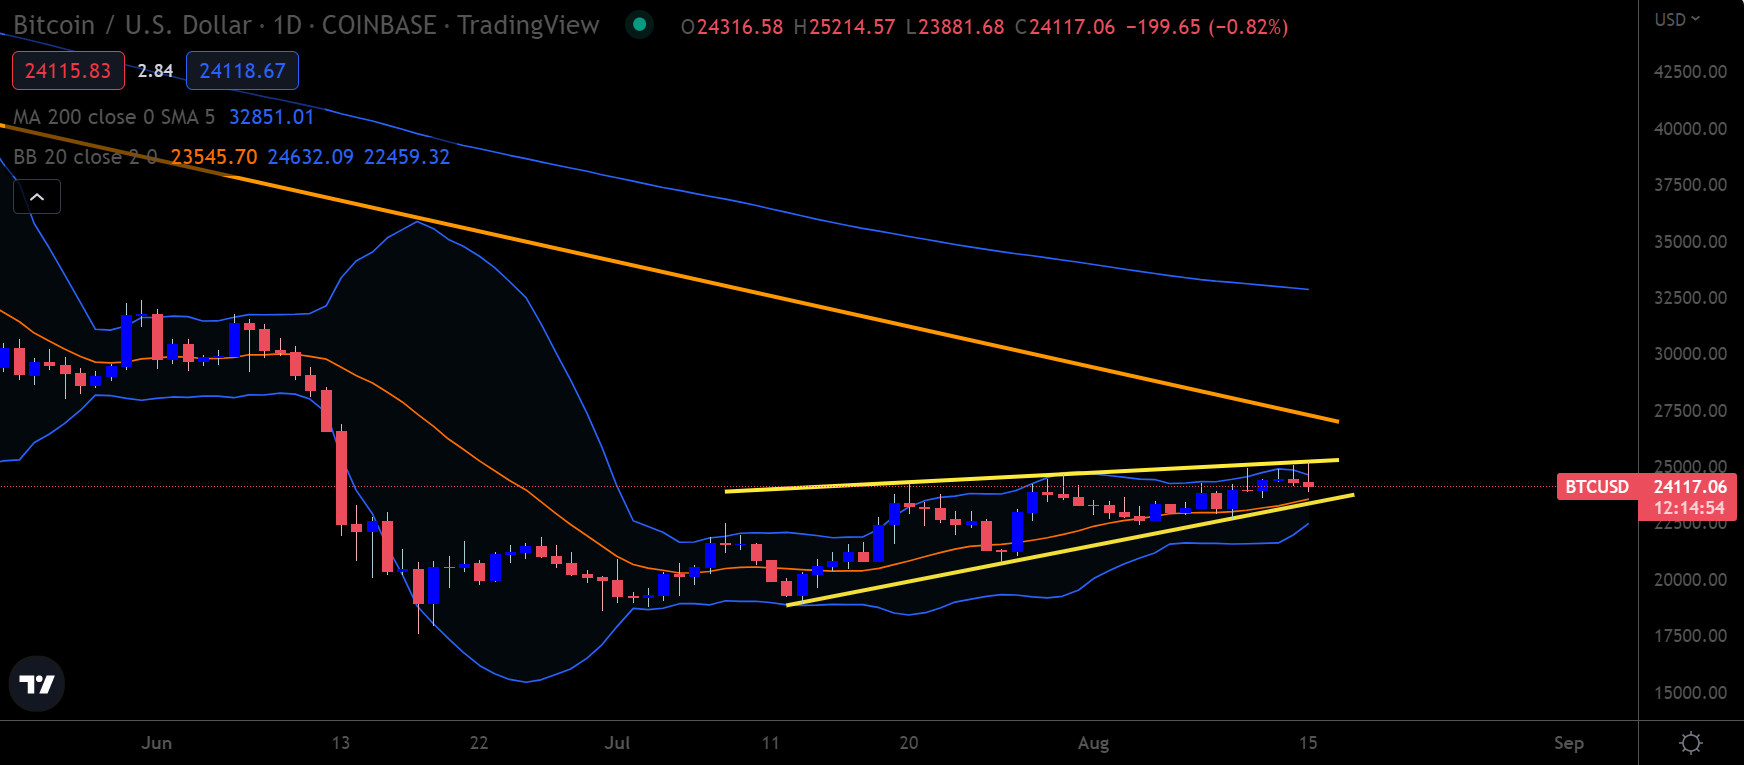
BTC/USD Daily chart. Source: Trading View
ETH Train Probably Left the Station
Ethereum is well placed to ride the bull train this week as the second-largest crypto continues to enjoy strong demand on price dips. Almost all pullbacks have been met with new highs, highlighting the bullish near-term technicals.
I have believed for some time that Ethereum could be headed towards the $2,200 to $2,400 area over August. I am not comfortable giving any higher price targets than that right now.
Should we see Bitcoin moving towards the $26,500 to $27,500 area, I firmly believe that it could correlate well with Ethereum trading around the $2,200 to $2,400 area around that time.
Anyone who has missed the recent dips runs the risk of missing the bull train altogether. The recent pullbacks under $1,600 and $1,400 were probably the best chances to position safely for the expected ramp higher. It means that adding long positions now would come with a higher risk.
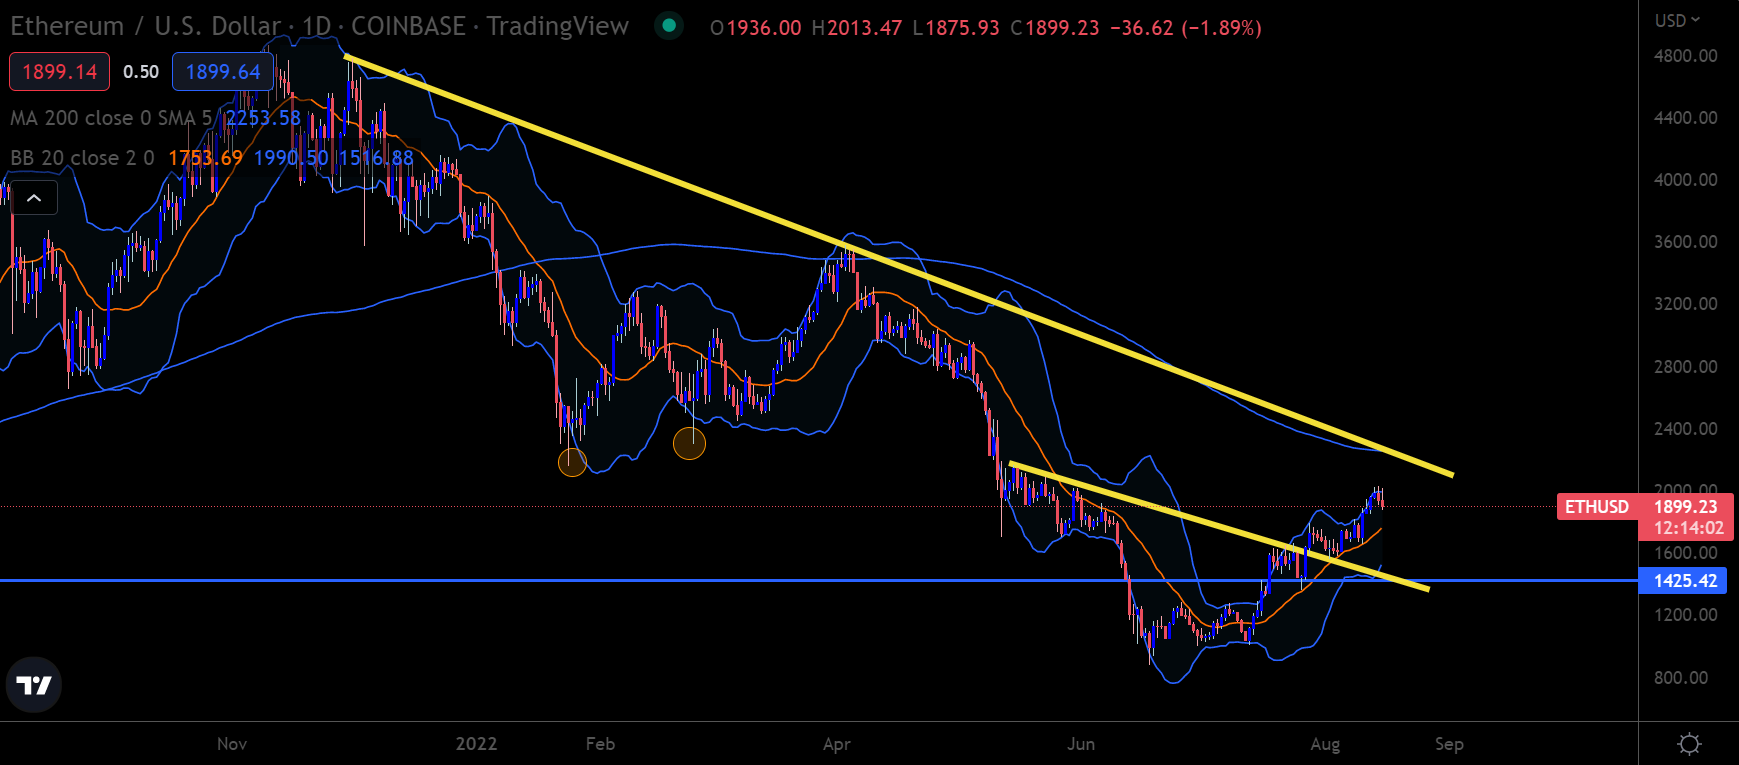
ETH/USD Daily chart. Source: Trading View
Altcoin Trading Plan
Today, I will share an update of my ongoing short-term buy signal for SIMETRI’s Coins On The Move. I issued a long XRP signal on July 5, with a target of $0.44. While it was very tempting to take a profit last month when XRP moved towards $0.4100, I resisted. I’ll explain why.
I felt the market still had room to run. I plan to close the current signal if the total crypto market capitalization reaches the $1.3 to $1.4 trillion mark. It can serve as a potential sell signal for other altcoins as well.
Regarding price targets, I like anywhere between $0.4400 or $0.4800. This is the type of area I would be comfortable taking profits, marking a 30-plus percent gain from my original entry point. Fingers crossed for the Crypto Total Market Cap tagging $1.3 to $1.4 trillion during August.
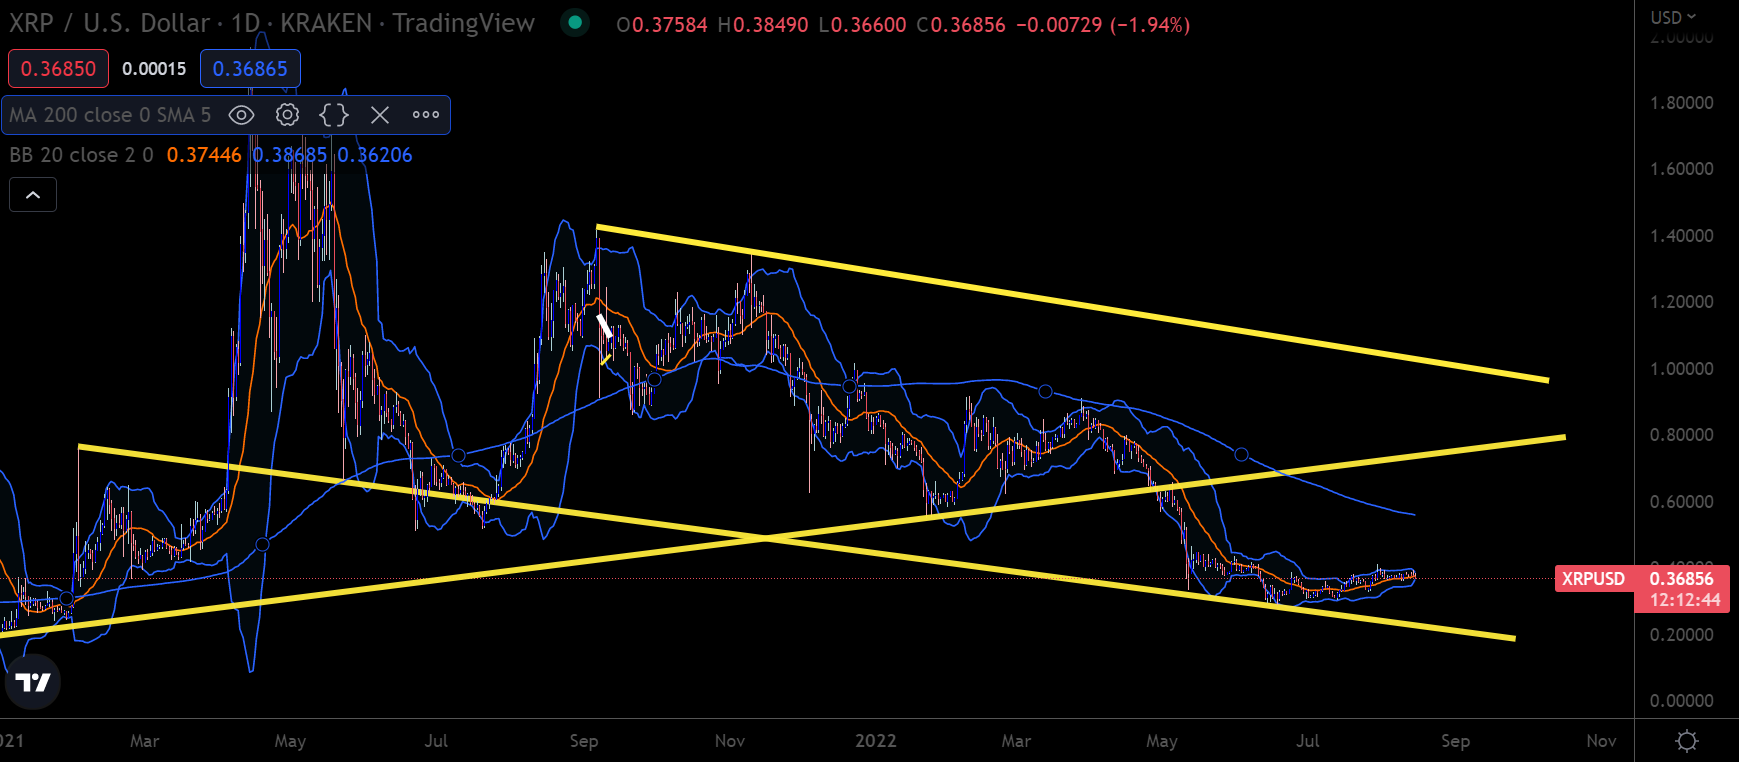
XRP/USD Daily chart. Source: Trading View
The Last Stretch
In short, Bitcoin and Ethereum have been behaving almost perfectly from a technical standpoint on price dips and further rewarding those brave enough who have bought into those price dips. However, the $25,000 level for BTC and $2,000 for ETH have become central sticking points.
If buyers can stage a breakout above these levels, it should trigger the next leg higher for Bitcoin and the broader crypto market. As I have been predicting for some time in my Live War Room webinar and daily Pro BTC Trader emails, I believe that $1.4 trillion could correlate with the conclusion of this bear market rally in Bitcoin.
