A faint pump

Bitcoin broke above the $17,000 level last week after U.S. Federal Reserve Chair Jerome Powell stated the central bank could begin smaller interest rate hikes as soon as December.
Speaking at an event last Wednesday, Powell said he expected the central bank to be in a position to reduce the size of rate hikes this month, effectively making the “Fed pivot” the most popular narrative until the next meeting in mid-December. However, he warned that monetary policy would likely stay restrictive until the emergence of convincing signs that inflation has dropped.
Bitcoin started the previous week under pressure following widespread COVID-19 protests across China, which severely dented broader market sentiment. Since then, the government has taken steps to appease the protestors and roll back on some lockdown rules. Being the world’s second-largest economy, such events in China strongly affect global finance.
The FTX regulatory hearings from last week turned out to be a dud event. Rostin Behnam, the chairman of the Commodity Futures Trading Commission, called for “comprehensive” rules to avoid another situation similar to FTX, but the following steps regarding regulation remain unclear.
Regarding on-chain movements, the bottom formation process has begun as the retail crowd starts to capitulate. However, institutional holder accumulation and the Bitcoin mining industry still show some yellow flags.
The recent price action and market sentiments suggest that the current rally may have some steam left. However, I expect the uptrend to last only a short time.
Fed Pivots But Inflation Might Stay
Last week, observant traders may have noticed that the crypto market had a feeble reaction to the comments from Powell on slower rate hikes. On the other hand, the stock market rallied sharply, and the U.S. dollar index suffered a steep drop. Bitcoin’s mild reaction to a long-awaited Fed pivot is a testament to the damage inflicted by the FTX incident over recent weeks.
Moreover, the bond market also has some clues that raise doubts about the sustainability of the dollar’s weakness. The 10-year and 2-year U.S. treasury bond yields are still above 3.5% and 4.2%, respectively. Higher yields create demand for the dollar as it is common for institutional investors to conduct a carry trade by borrowing from a lower interest-paying central bank like Japan’s.
I also don’t buy into the theory that inflation has peaked, mainly because of the growing geopolitical tension between Russia and Europe, and the possible reopening of China’s economy—if its government ends lockdowns. The European Union implemented a price cap on oil imports, which might see a backlash from Russia, ultimately hurting oil exports and raising prices.
A more plausible scenario is that inflation will likely remain high, and the Fed will trickle out a steady stream of 50 basis point hikes, adding to the existing economic pressures. Eventually, the Fed will taper down to 25 basis points in the second quarter of 2023. The global energy market may improve by then, creating ambient conditions for a risk-on rally.
Economic Calendar Watch
This week’s focus will likely remain on the Institute for Supply Management’s (ISM) service industry data of the United States economy. The ISM services report measures employment, prices, and inventory levels, providing an overview of the supply and demand in the service sector.
The service sector has been unusually strong over recent months as the Purchasing Managers Index (PMI) number has stayed above 50, signaling expansion. Since the Federal Reserve pays close attention to this metric, we will likely see more emphasis on 50 basis point hikes as long as this remains the case.
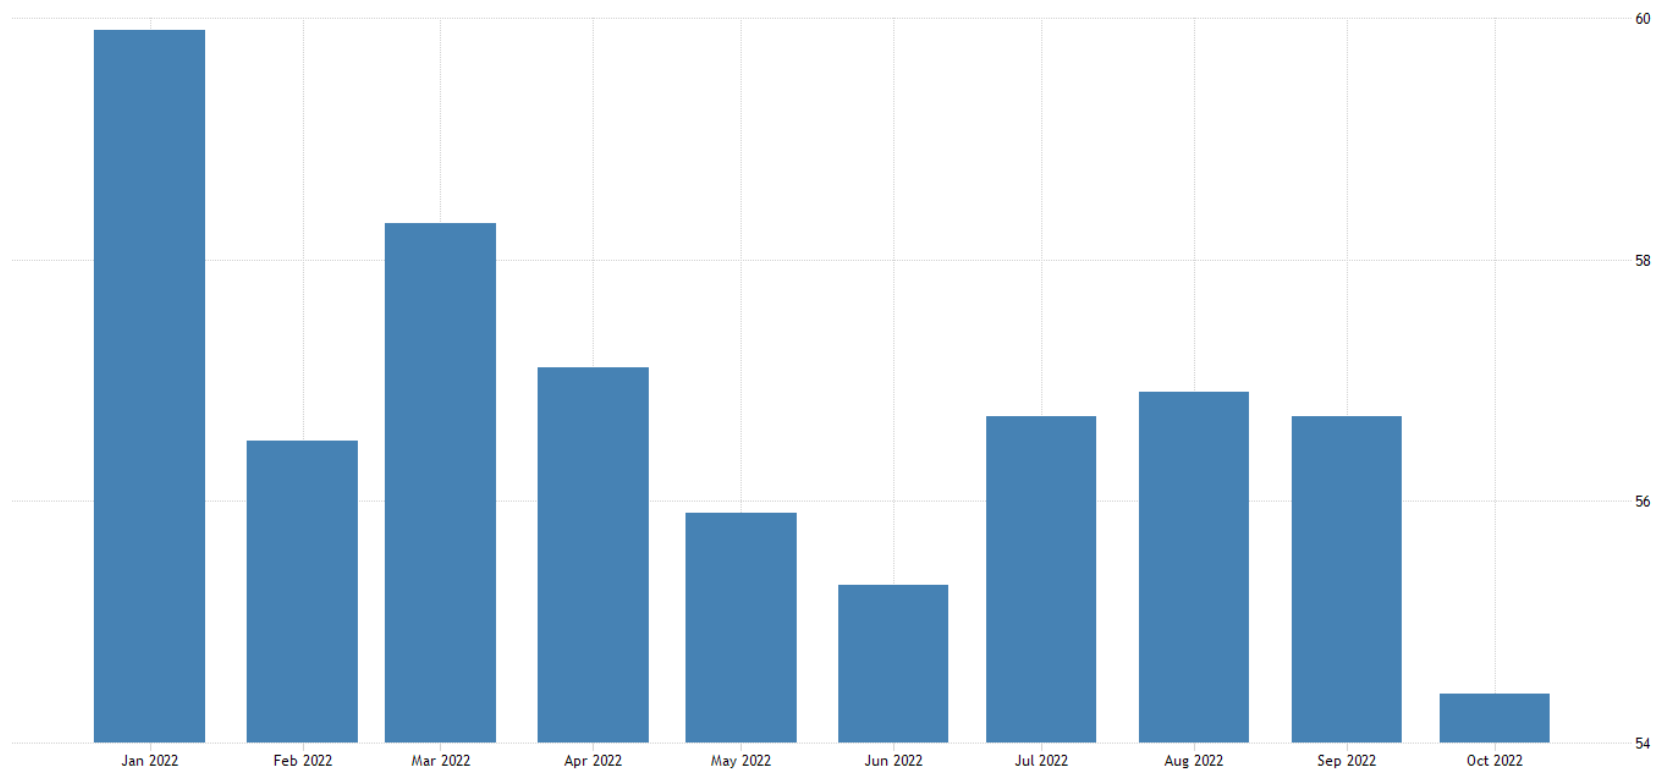
United States non-manufacturing PMI data (Source: Trading Economics)
China will also be closely watched this week on the political front and COVID-19 restrictions. Several Chinese provinces eased COVID restrictions after country-wide protests put the government in a tense situation. Further easing of restrictions could help lift sentiment. However, if the government decides to take draconian steps leading to a deterioration of the civil situation in the country, risk-on assets would fall drastically.
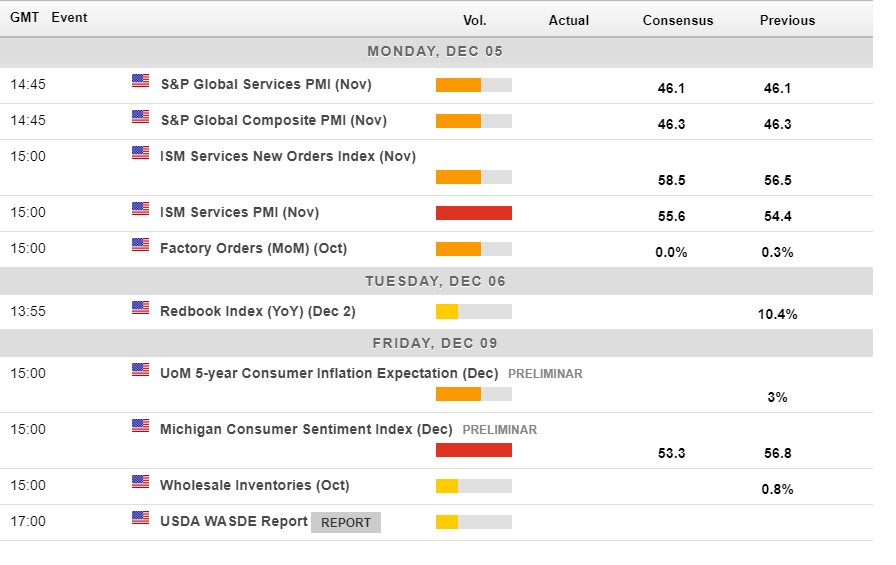
The economic calendar for this week (Source: Forexlive)
On-chain Watch
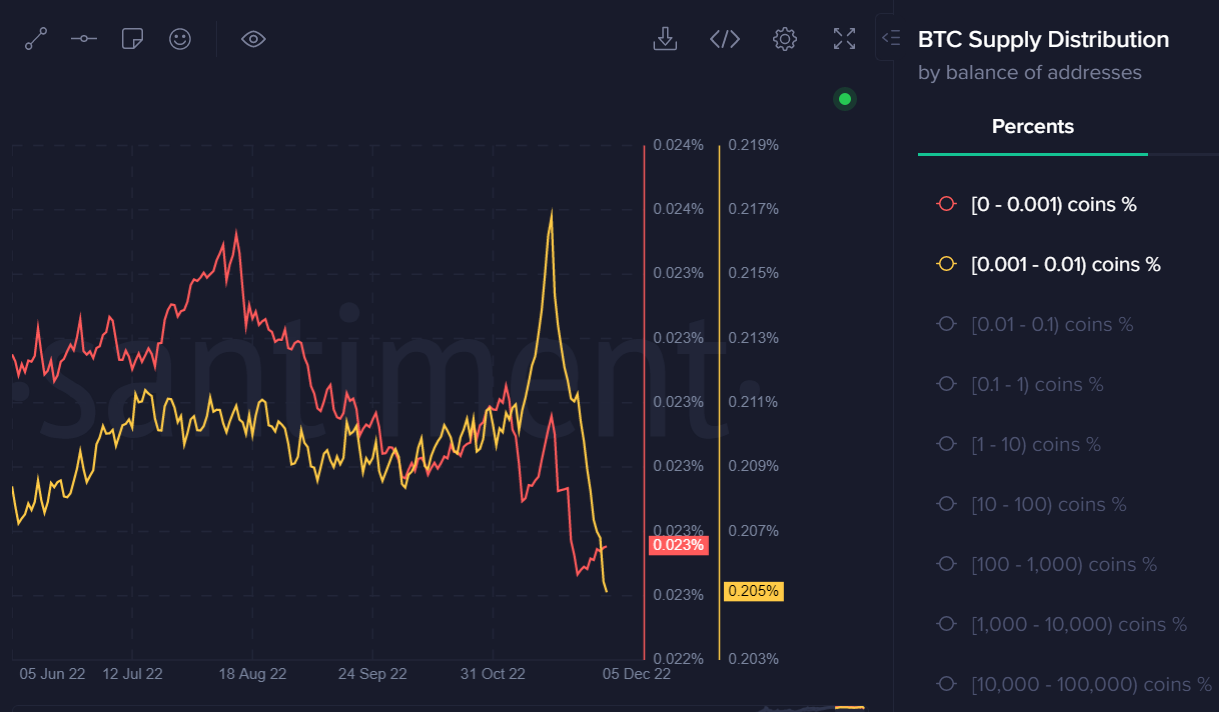
Pro BTC Trader subscribers will know I am a huge fan of Supply Distribution data. I pay special attention to addresses holding 1,000 to 10,000 BTC (which I call “mid-tier whales”), and to addresses holding less than 0.01 BTC (“minions,” if you will).
Mid-tier is the crème de la crème of BTC holders. You need to pay close attention to what they are doing because they have a good track record in buying low and selling high. On the other hand, minions have terribly poor timing.
With this in mind, I’d like to compare the recent behavior of mid-tier whales and minions. A brief look at the attached chart below will tell you instantly that staying on the sell side in May and October, along with mid-tier whales, would have fared well for you as a trader.
Thus, we need to keep a close watch on mid-tier whales. These guys have been selling aggressively since October. This has been a constant “poker tell” that incoming rallies are likely to be reversed, especially if mid-tier whales continue to sell.
Holdings of BTC addresses with a balance between 1,000 to 10,000 BTC (Source: Santiment)
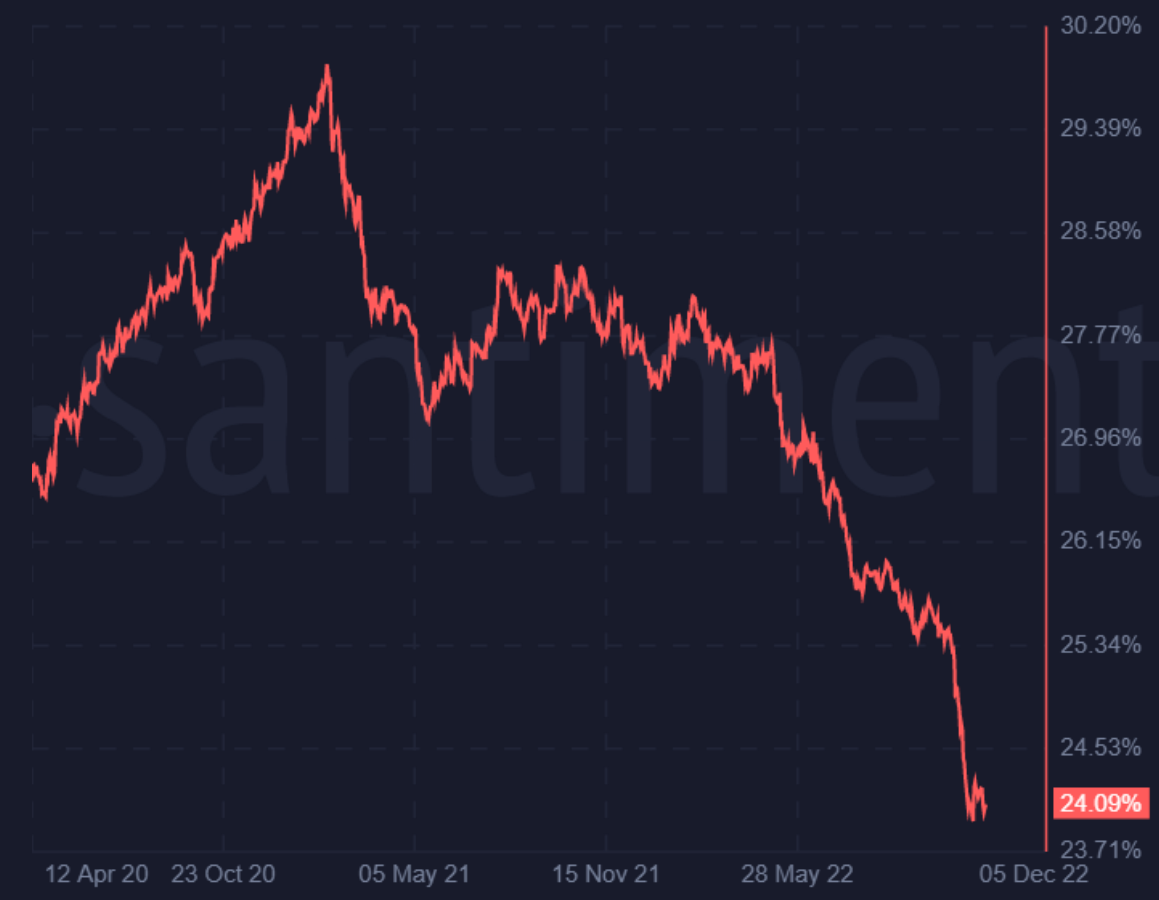
Next, we come to the minions. These guys were buying aggressively above $40,000 last year and even before the FTX crash. Now, they have started to dump their holdings heavily. A move that was not unexpected if you read my daily commentary. As they capitulate over the coming months, we are likely to see a market bottom forming.
Holdings of BTC addresses with a balance of <0.01 BTC (Source: Santiment)
Last but not least, the other important category of Bitcoin sellers is miners. A number of miners went offline towards the end of November as their operations were unprofitable. During this period, we saw a positive accumulation in BTC miner holdings.
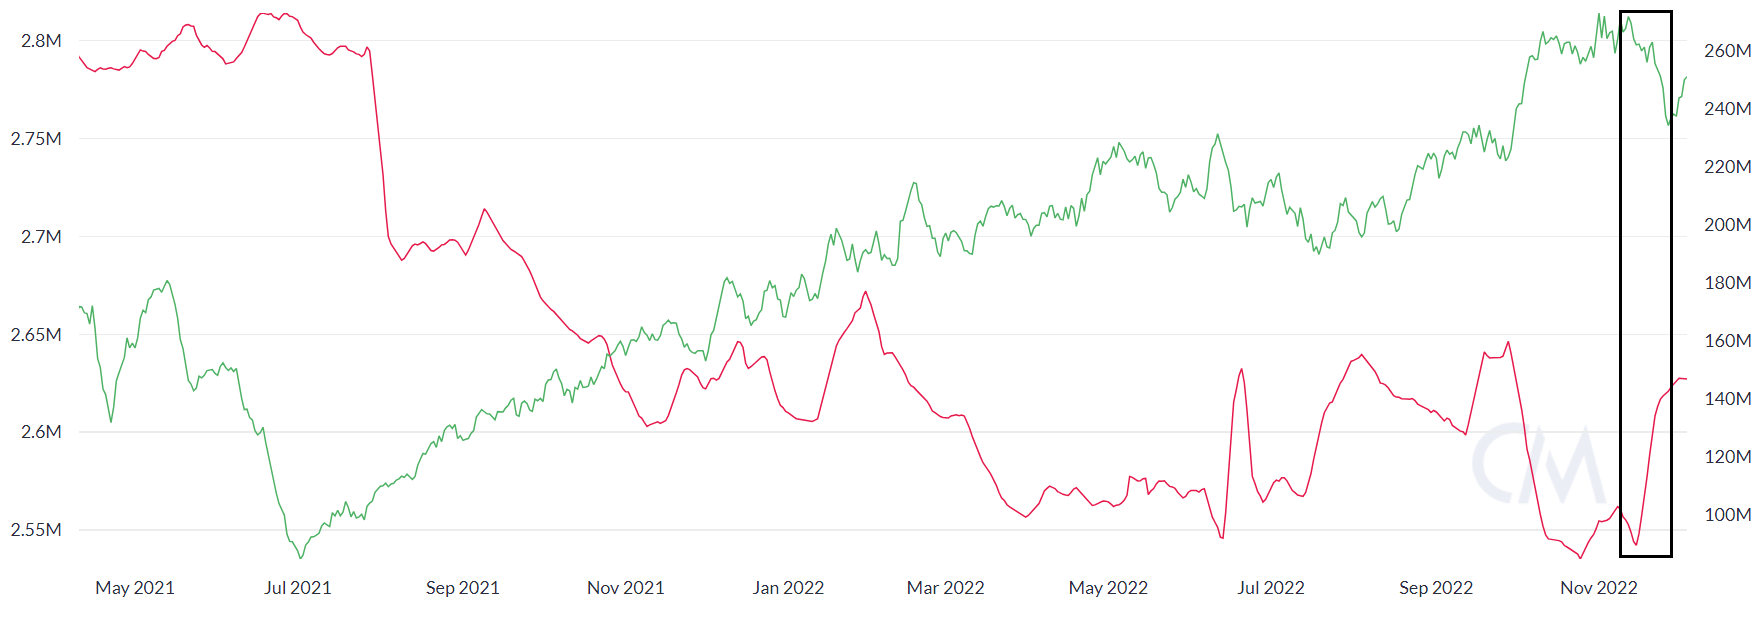
Bitcoin miner supply (in red) and the network’s total hashrate (in green) (Source: Coinmetrics).
However, the risk of capitulation is still there as long as BTC stays below $28,000. Additionally, the mining hash rate has started to pick up again, which will increase the selling pressure. With this in mind, we are likely to see the resemblance of the next bull market when retail and miners totally capitulate and mid-tier whales start to fill their bags, in my humble opinion.
BTC/USD Projections
While I strongly believe the medium to long-term outlook for Bitcoin is pointing lower, BTC appears on course to test the $18,000 level.
Last week’s slow recovery above $17,000 hints that the market is neither getting excited about selling nor that BTC appears undervalued, which is why we haven’t seen explosive price action yet.
A more interesting proposition is for a move above the $18,000 level, whereby Bitcoin probably would look overbought in the short-term, providing the catalyst for new lows in Bitcoin’s price.
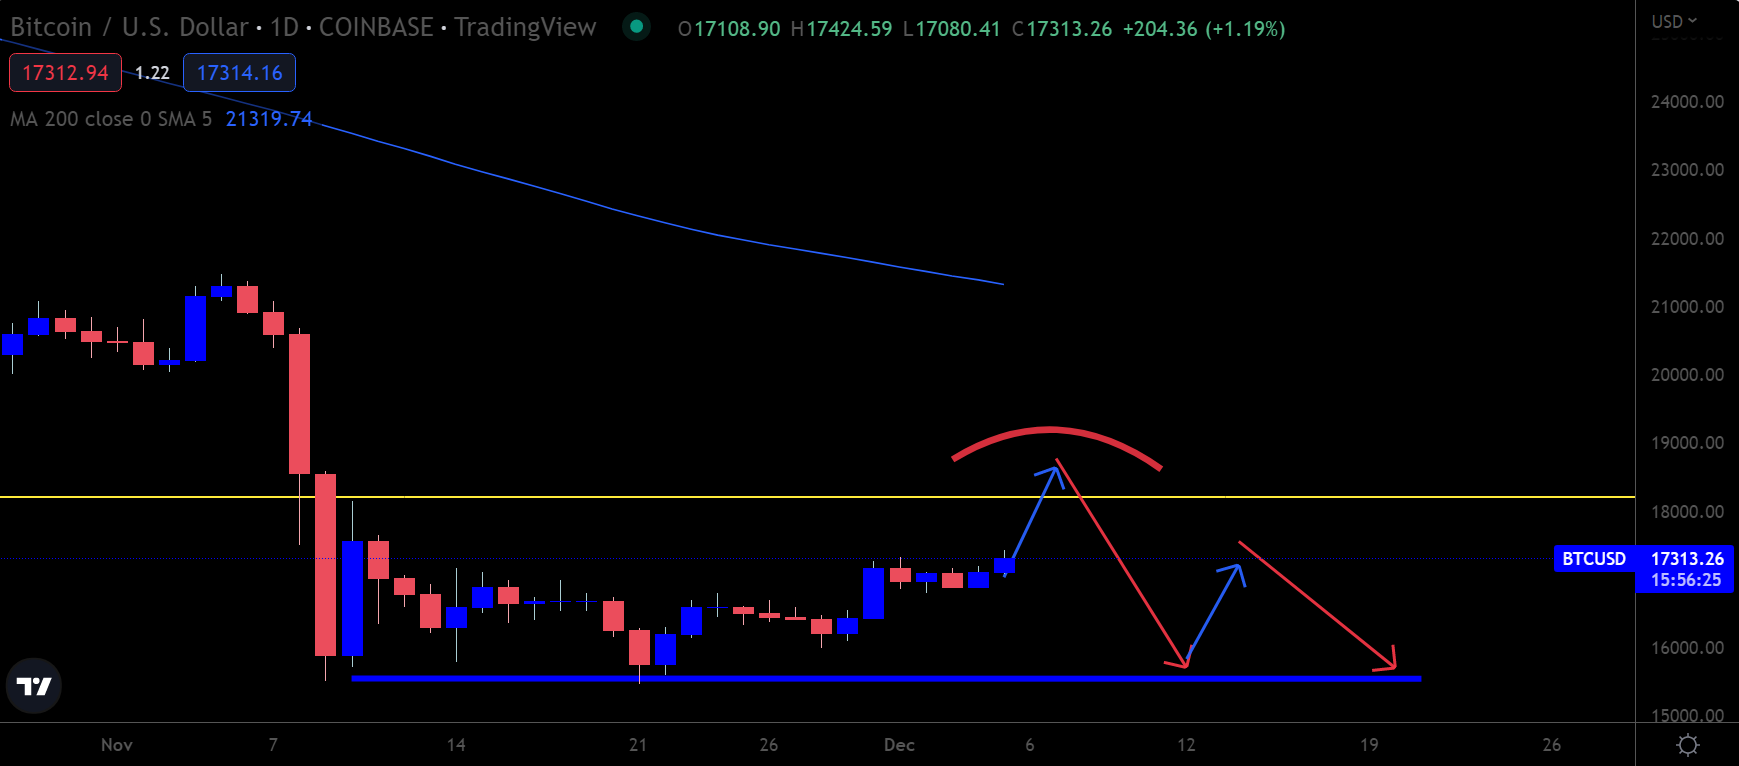
BTC/USD four-hour chart (Source: TradingView)
ETH/USD Watch
Ethereum looks set to test the $1,350 to $1,400 area. I stated in last week’s newsletter that price moves above $1,200 should cement buying interest, which is what we saw.
ETH/USD looks to be carving out an inverted head and shoulders pattern. However, even if this pattern is activated, it probably will not fully play out because of its poor formation in a short period of time.
A far more likely scenario is for some failure or bull trap and then for the inverted head and shoulders pattern to be quickly converted into a head and shoulders pattern towards the year’s end.
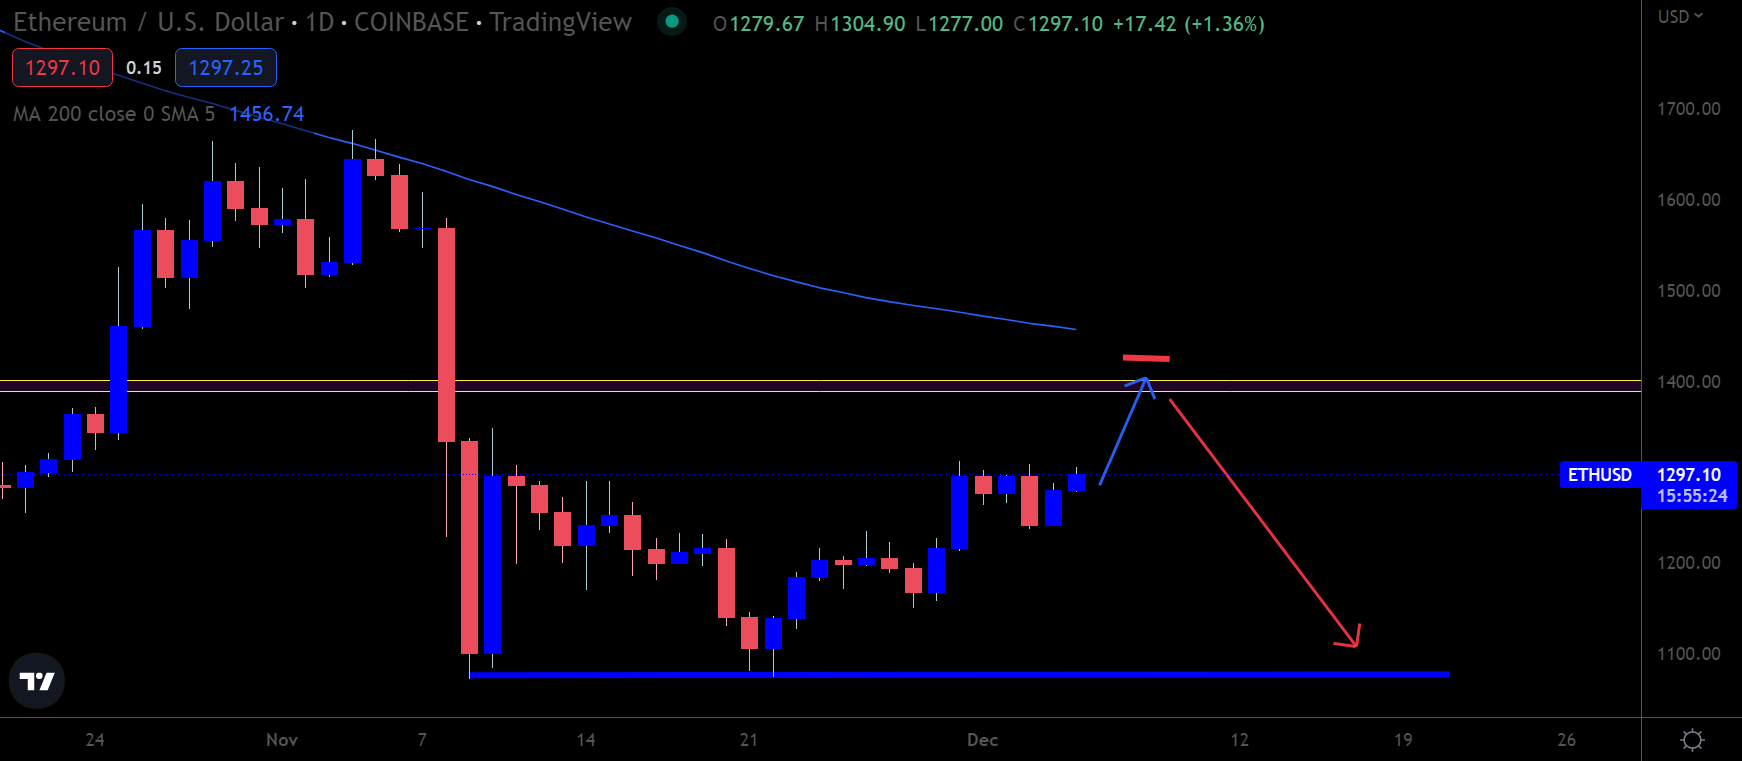
ETH/USD four-hour chart (Source: TradingView)
LTC/USD Opportunity
Litecoin’s recent pump has turned a lot of eyes toward the coin. However, with inferior on-chain fundamentals and no new partnerships, LTC looks overbought.
I think an opportunity to sell LTC could emerge over the coming days, provided some of my other conditions for the trade line up during the week. I will issue a signal for Pro BTC subscribers targeting a 30% gain.
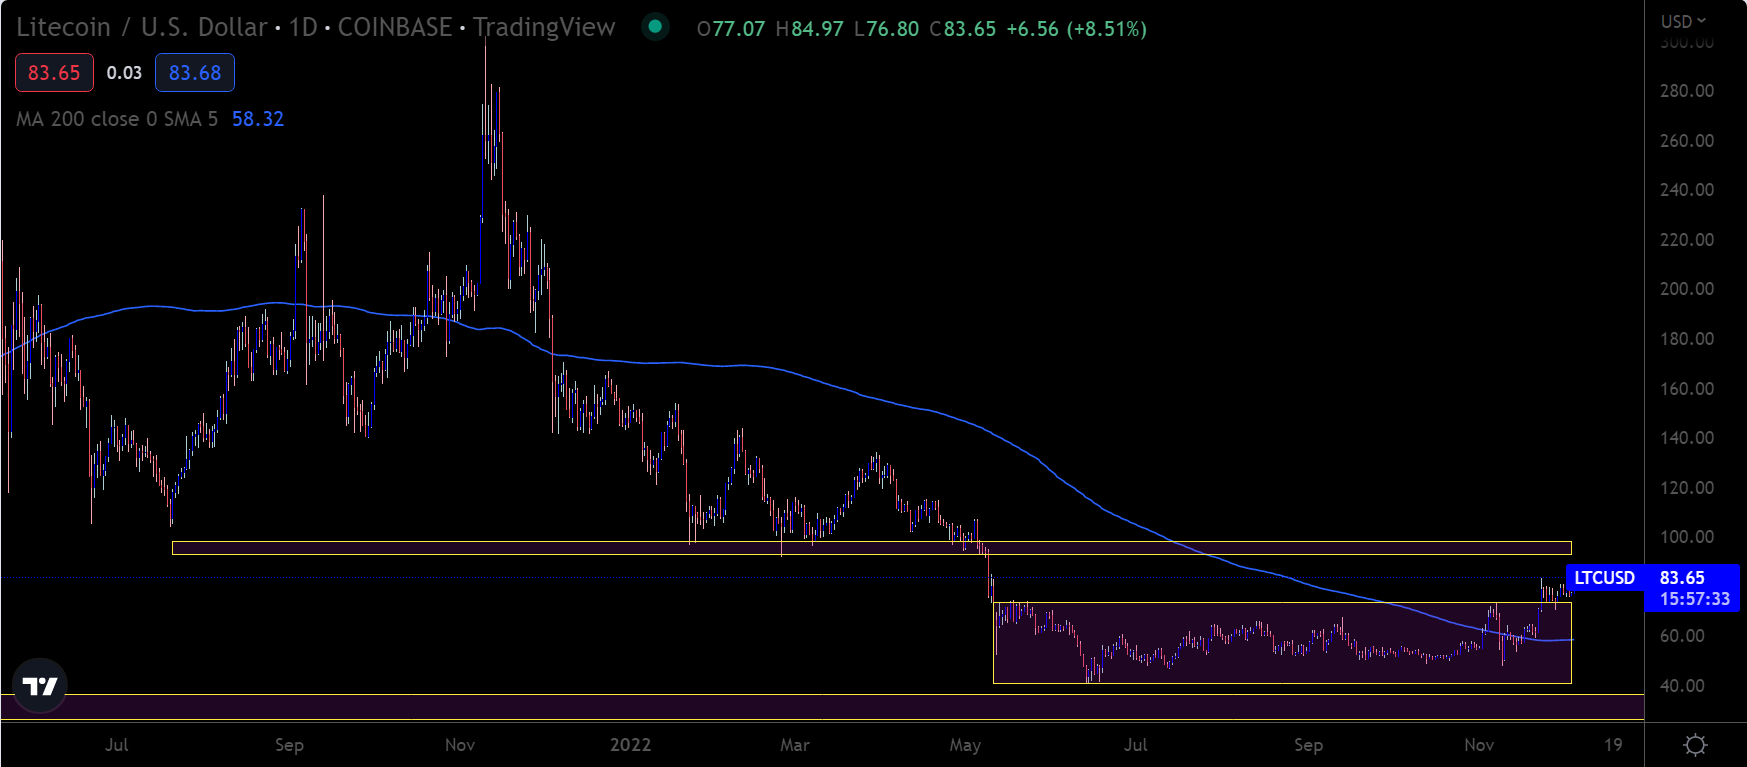
LTC/USD four-hour chart (Source: TradingView)
Better Times
To conclude, I still don’t think the bottom is in based on the macroeconomic uncertainty and weak whale buying. However, a rally is underway right now and will likely push prices higher in the short term.
A move toward the $18,000 level and a final leg lower is the main scenario I am looking for over the coming weeks if the chart pattern and price action are to be believed.
I also think an outstanding buying opportunity lies ahead in the first quarter of 2023. But more on that later. Let’s first see if those bargain basement levels are reached.
