June 22 Crypto Market Roundup

Bitcoin (BTC) broke below its key 50-day moving average for the first-time since early-April last week, as bulls failed to build traction above the technically important $9,600 level.
After consolidating around the $9,400 level, the BTC/USD pair found strong weekly technical support just above the $9,150 level.
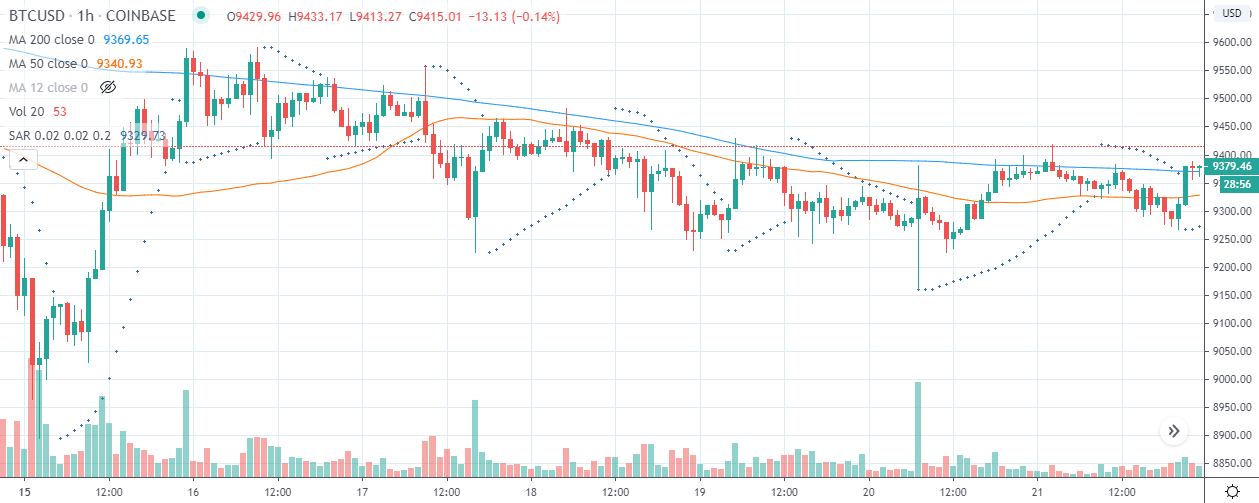
BTCUSD H1 Chart
Source: Tradingview
Bitcoin had initially started to rally on the announcement that the United States Federal Reserve is to begin buying a broad range of corporate bonds.
A strong decline in global equity markets coincided with a strong price pullback in Bitcoin towards the $9,150 area, as fears of a second wave of COVID-19 caused markets to move into risk-off mode.
Cryptocurrency sentiment also hit a new monthly low last week. The Crypto Fear and Greed Index dropped to a 37, which mark the index’s lowest official reading since late-April.
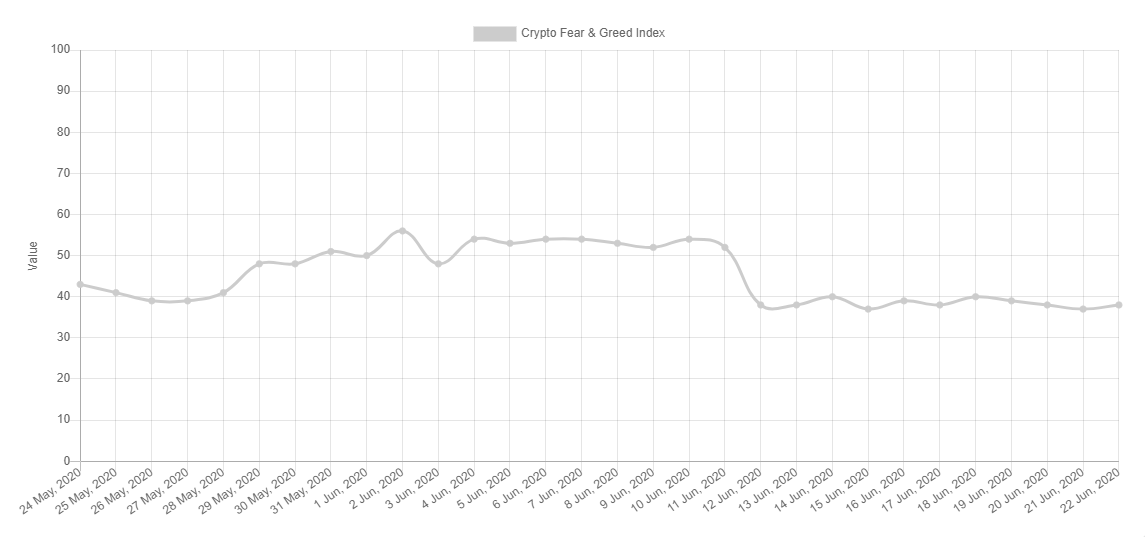
Crypto Fear & Greed Index
Source: https://alternative.me/crypto/
Data last week showed mining difficulty for Bitcoin had reached its highest level in over two years. The increase in mining difficulty was the largest since the 2017 bull market run.
On-chain data from cryptocurrency behavioural analytics firm, Santiment, also showed a sizable spike in BTC Token Age Consumed.
Historically, large increases in BTC Token Age Consumed have been a precursor for large directional moves.
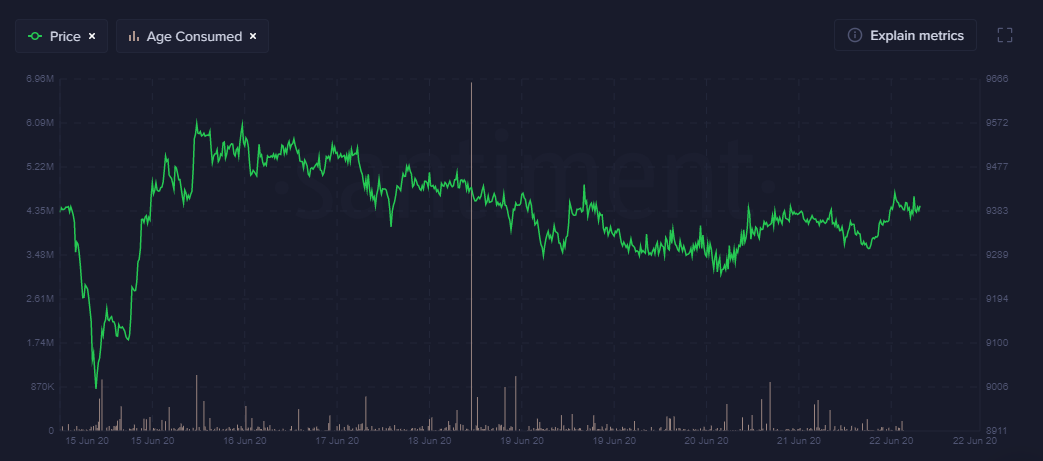
A Bitcoin whale transaction of $2.2 billion was recorded last weekend, further hinting at a large directional move on the horizon.
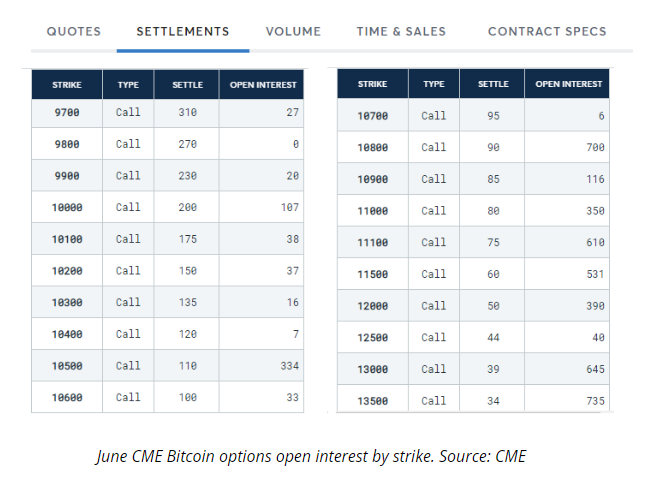
Bitcoin traders also remained cautious due a massive amount of options expiries taking place towards the end of the month.
The Commitment of Traders report, or CoT report, showed that futures traders were turning increasingly bearish towards Bitcoin last week.
The total market capitalization of the cryptocurrency market fell towards the $255 billion mark, as the top-10 altcoins drifted lower alongside Bitcoin.
However, the recent multi-month bullish trendline breakout remained in play on the daily, weekly and monthly total market capitalization of the cryptocurrency charts.
Ripple gained traders’ attention last week, after the former Chairman of CFTC said that XRP ‘“is not a security”. XRP/USD gradually eased lower after the comments, and ended the week by over 5 percent in the red.
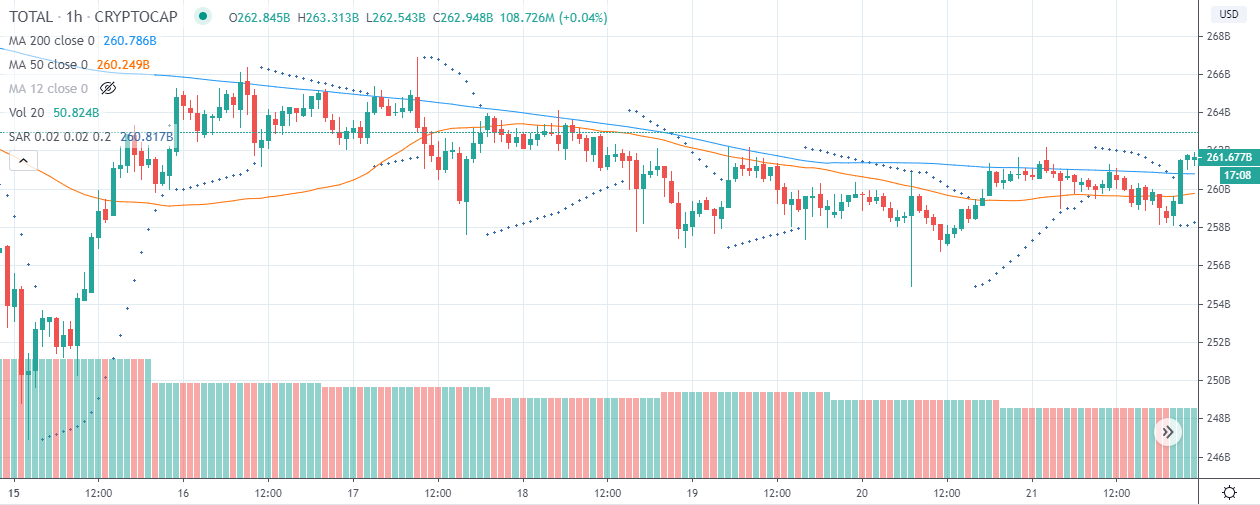
Crypto Total Market Cap
Source: Tradingview
The Week Ahead
Looking at the week ahead, the upside potential for Bitcoin increases all the while price trades above the $9,225 level, which is the BTC/USD monthly pivot point.
A sustained break under the $8,700 level would likely cause medium-term traders to turn bearish.Bulls ideally need to anchor price back above Bitcoin’s 50-day moving average, to encourage a technical test back to last week’s trading high. A break above $9,600 exposes further upside towards the $9,885 and possibly the $10,100 levels.
The United States economic calendar will be focused on US GDP and Non-defense Goods Order data this week. Traders will also be acutely aware that any data showing a rise in global COVID-19 infections could cause risk-sentiment to dip at any moment.
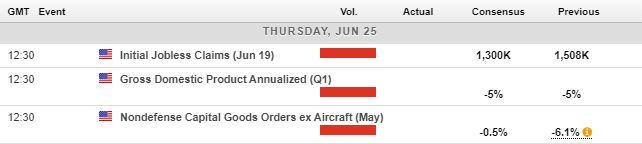
Economic Calendar
Source: Forexlive
The short-term technicals continue to show an ascending wedge pattern, which points to an eventual rally towards the $11,600 area for the BTC/USD pair.
Bitcoin (BTC) may enter into a new bullish cycle if the $10,500 level is broken. However, bulls still have a lot of work to do to surpass this important technical barrier.
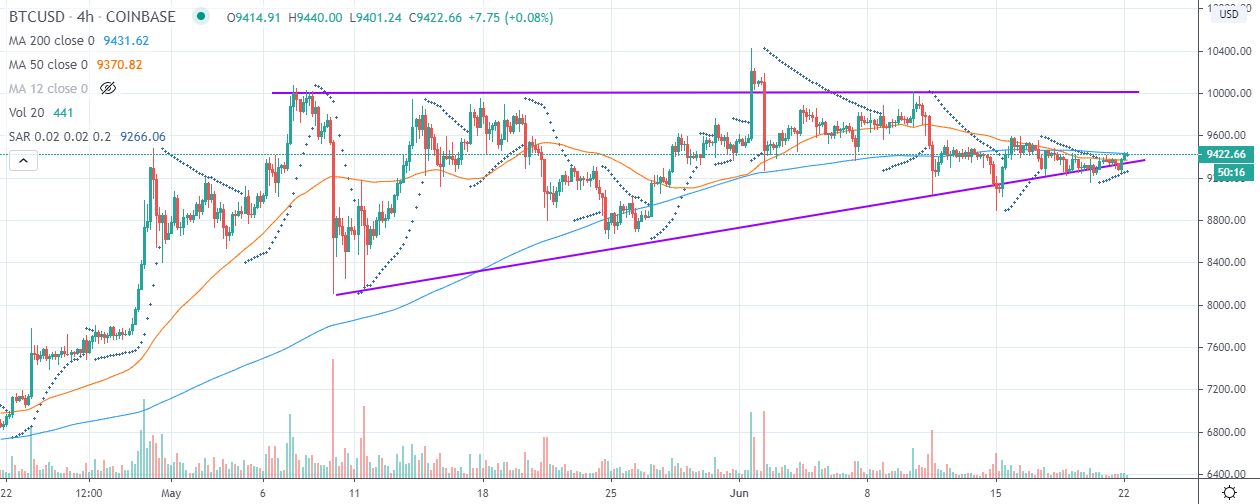
BTC/USD H4 Chart
Source: Tradingview
Ethereum (ETH) is starting to look more bullish, after a failed downside attempt at critical support, around the $220.00 level, last week. The recent bounce from this area certainly suggests another technical test of the $250.00 level may be on the horizon.
A breakout above the $250.00 level could force a major upside push towards the $300.00 resistance level, and possibly even higher.
Without confirmation of a new “alt season” being in play yet, a strong push higher in BTC may be required to encourage a breakout above the $250.00 level.
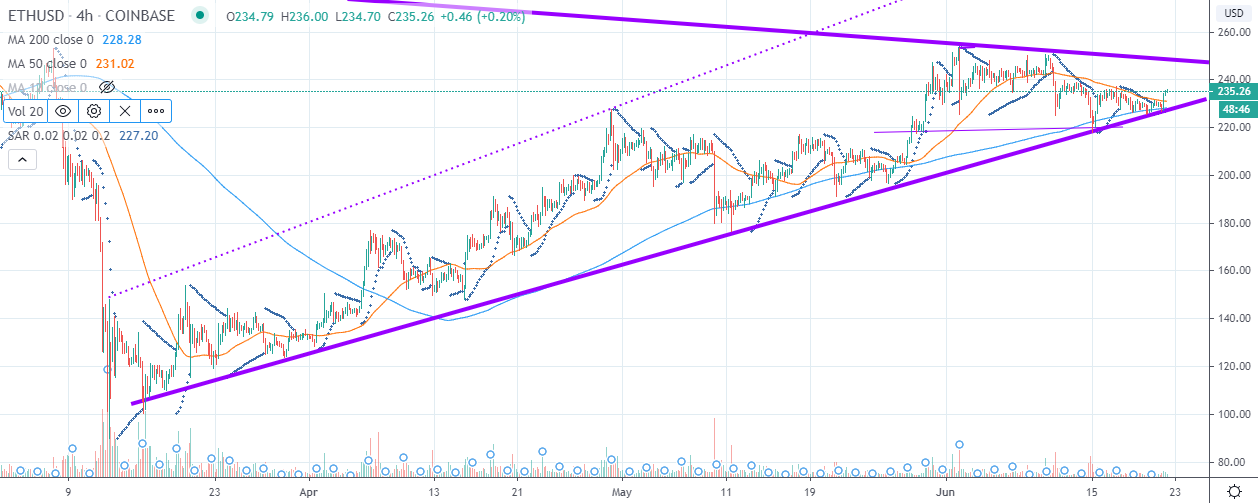
ETH/USD H4 Chart
Source: Tradingview
