Inflation Hits Hard

Bitcoin’s price dropped to new yearly lows Monday morning as the global markets responded to a 40-year inflation print on Friday. The U.S. government reported Consumer Price Inflation (CPI) of 8.6% in May—the highest level this year. For reference, March’s figure was around 8.5%, which was the previous peak for inflation this year.
The significant increase in U.S. inflation boosted the chances of more rate hikes from the Federal Reserve. Thus, traders’ appetite to take on decisive positions ahead of the Fed meeting this week is also questionable, leading sellers to outweigh buyers.
Aside from the CPI print weighing on the market, another problem has arisen. Half of Shanghai is back under restrictive measures after authorities discovered a fresh outbreak of COVID-19. China’s zero-COVID strategy has adversely affected the global supply of manufactured goods.
Notably, we’ve also seen several positive developments, such as the introduction of a federal cryptocurrency bill that aims to bring regulatory clarity in categorizing cryptocurrencies as commodities under the Commodity Futures Trading Commission (CFTC) rather than securities under the Securities Exchange Commission (SEC).
Additionally, PayPal enabled crypto transfers from user accounts to other wallets and exchanges, effectively evolving from an IOU or investment-only model. However, none of these developments are potent enough to act as a bullish catalyst amidst the macro environment.
About the Fed
This Wednesday, the Fed is tipped to raise its key interest rate by 50 basis points in June. The fear lies in what the Fed Chairman Powell will announce for July and September. As the adage goes, “monetary policy is 98% talk and 2% action; additional tightening announcements by the Fed will likely encourage further selling.
According to a Reuters poll, economists do not see a pause in rate rises until next year. With this in mind, I thought it might be a good opportunity to take a deeper look at the Reuters survey.
85 economists predicted a 50 basis point federal funds rate hike. The economists penciled a similar hike for July by a majority vote.
Additionally, more than two-thirds of respondents expect a 25 basis point hike in September. The median of 43 responses to an additional question showed a 50% probability of a 50 basis point hike in September.
If Powell hints at a 50 basis point hike in September, it will effectively double the benchmark borrowing rate to around 2% by September. On top of that, the Fed also plans to stop bond purchases, drying up liquidity in the market. Usually, the constriction of liquidity in the markets does not fare well for risk-on assets.
Analysts saw the Fed funds rate breaching the estimated 2.4% neutral level by year-end to 2.50 to 2.75%. The survey showed a steady median 40% probability of a U.S. recession over the next two years, with a 25% chance of that happening in the coming year.
In conclusion, the above crisis puts risk assets, especially crypto, in a challenging position. Investors will likely shift their focus on risk-off assets like gold and other commodities until the Fed changes its stance or takes a breather from aggressive rate hikes.
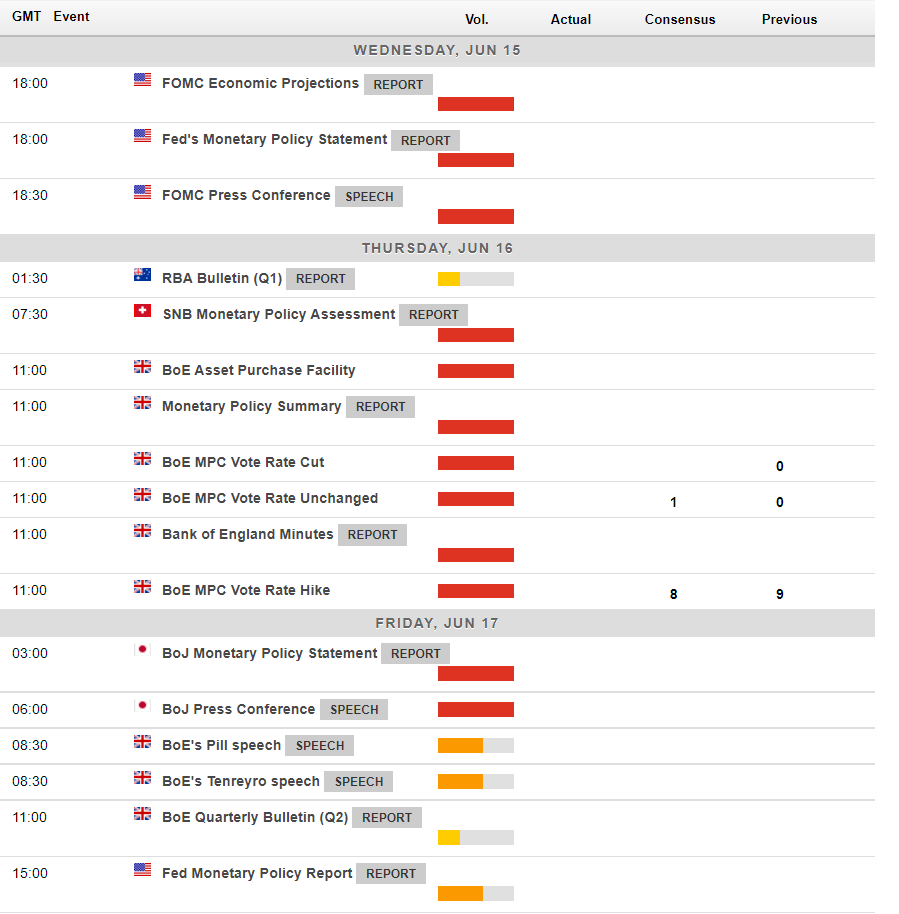
Economic calendar for this week. Source: Forexlive
On-Chain Alarms
Besides the ominous signs of recession, miner capitulation was confirmed on the Hash Ribbon indicator, which has inflicted significant short-term pain in the past.
The Hash Ribbon indicator tracks the 30 and 60-day moving average of the Bitcoin network’s total hashrate. When the 30-day MA moves below the 60-Day MA, it indicates that miners are leaving in large numbers. However, it is a lagging indicator.
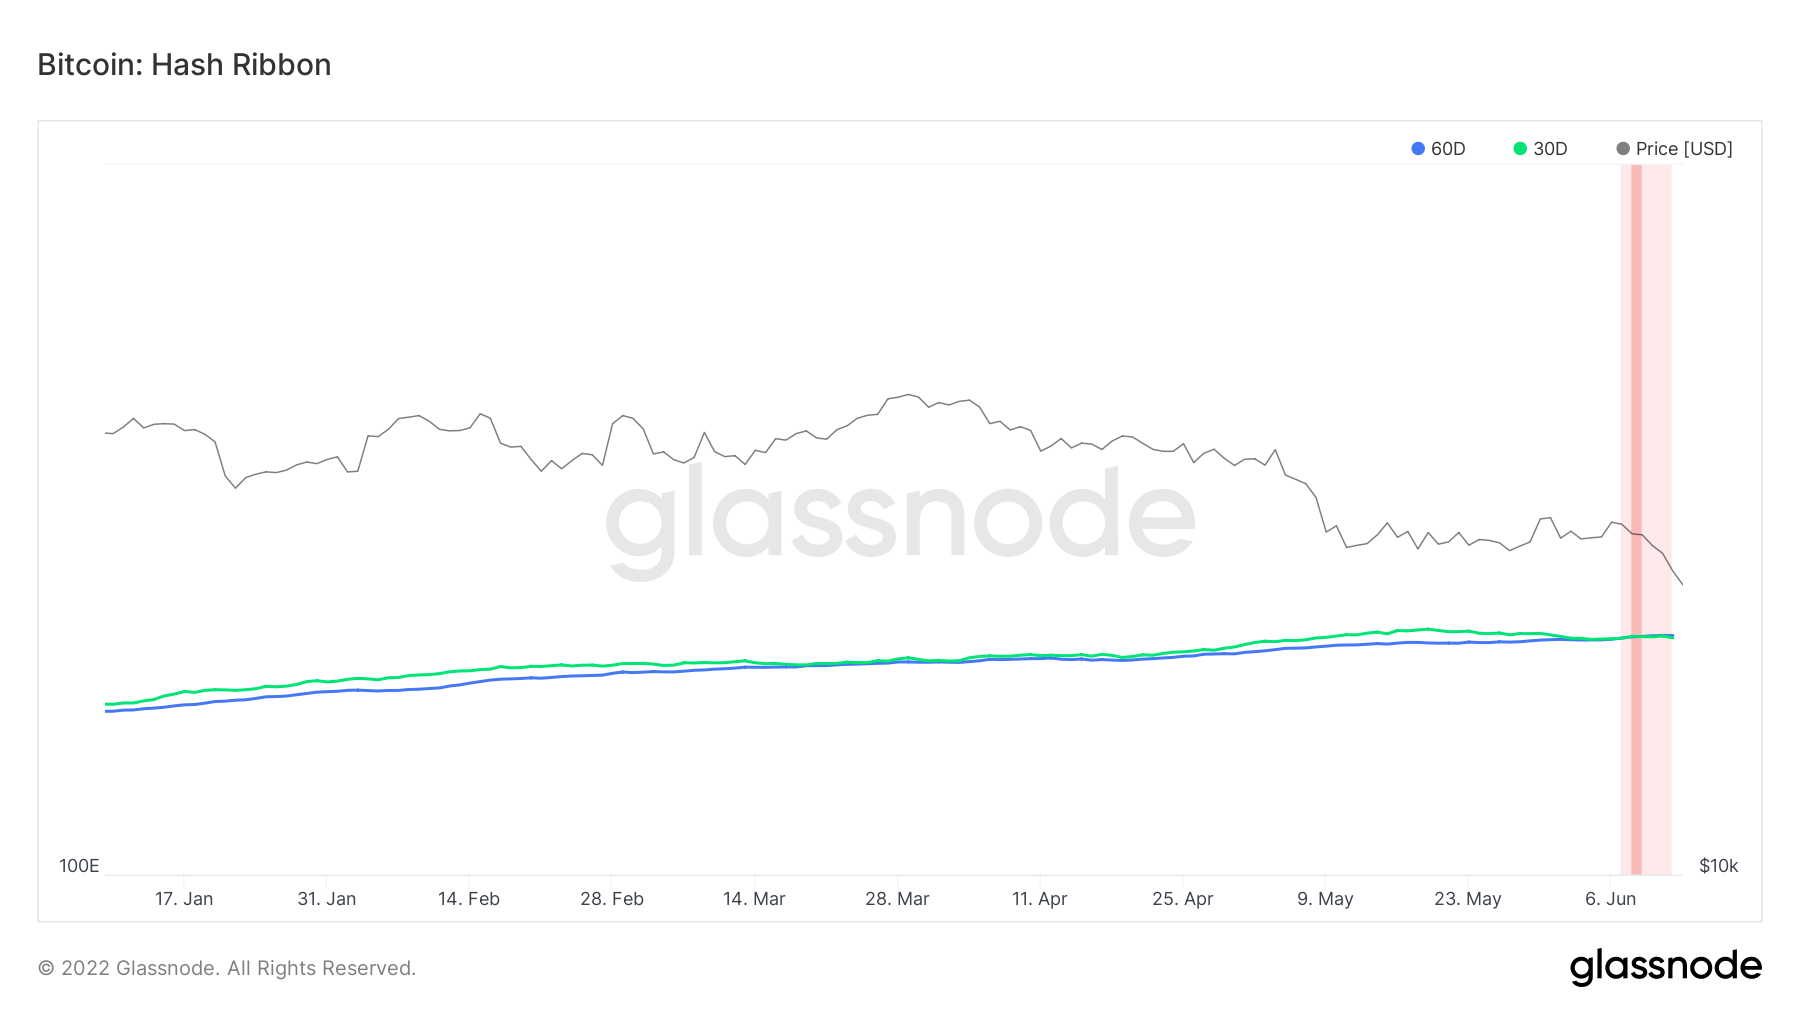
Bitcoin Hash Ribbon indicator signals capitulation as the green line moves below blue. Source: Glassnode
While the two lines are incredibly close, the hashrate has started increasing again after the recent difficulty adjustment on June 7. Thus, we may not see the divergence in the Hash Ribbon indicator similar to ones in the past.
The close proximity between the two lines of the Hash Ribbon indicator will probably stretch for another couple of weeks as miners hope to survive the negative price trend. However, this will likely add additional selling pressure in the market.
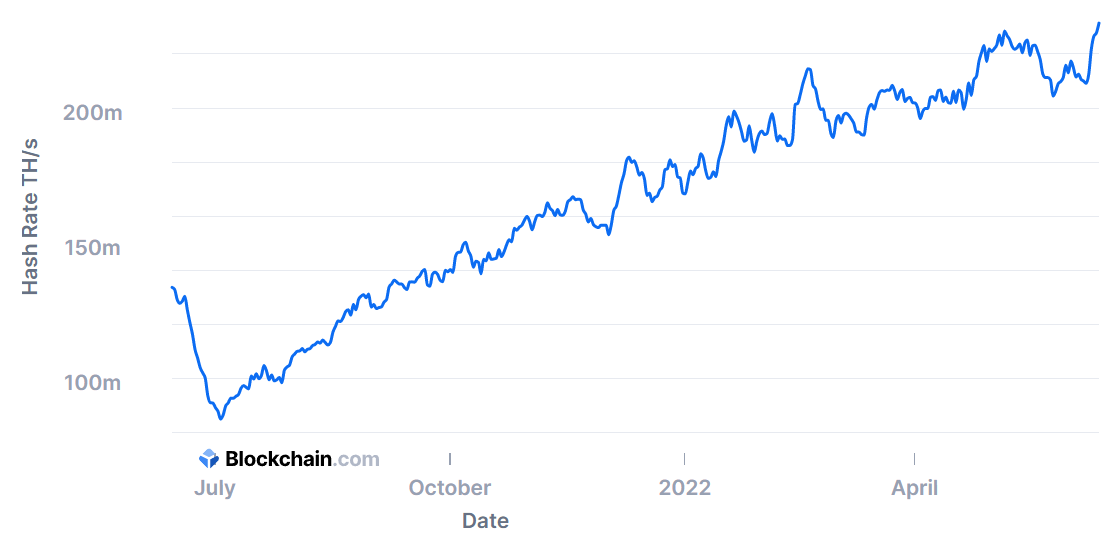
Bitcoin network hashrate spiking since June 7. Source: Blockchain.com
Currently, the primary narratives driving Bitcoin’s price are the macroeconomic environment and data from previous crypto bear trends.
One of the most potent bottom indicators is Bitcoin’s Supply in Profit. The indicator has reached 2020 bottom levels, but there’s still room to correct toward the 2015 and 2018 bear market levels.
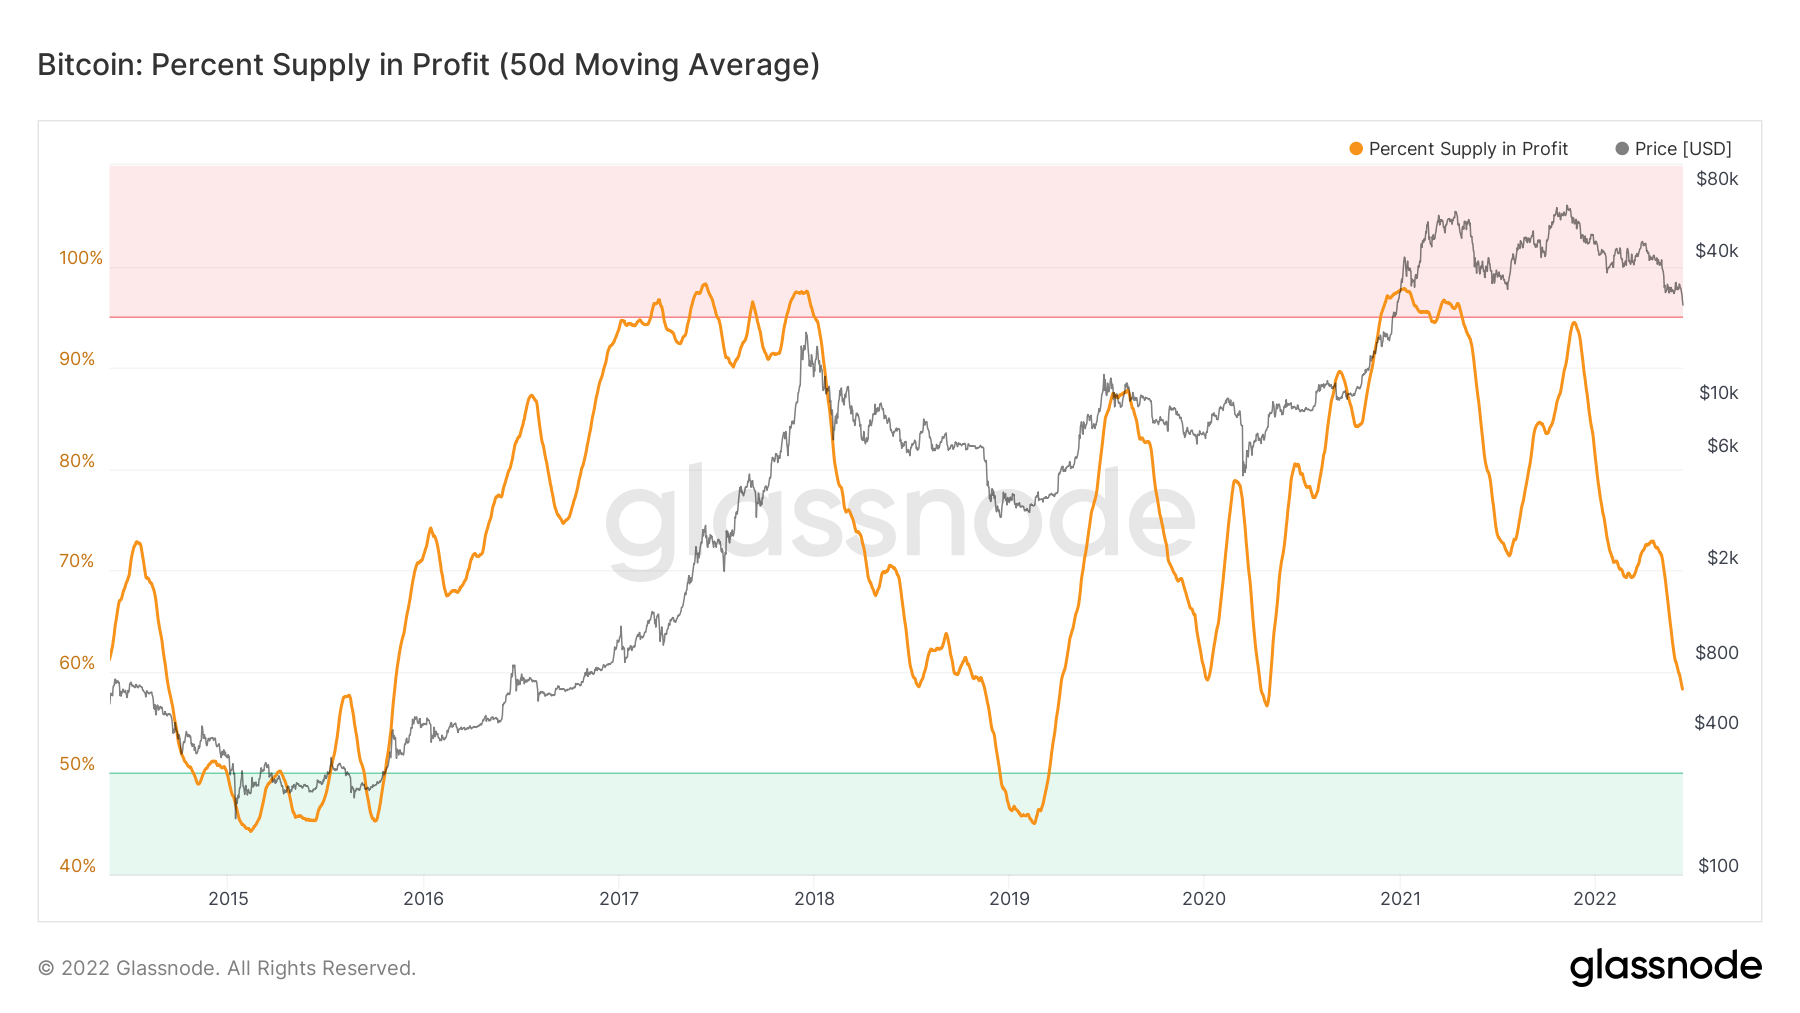
50-day moving average of Bitcoin’s supply in profit. Source: Glassnode
The situation remains the same on other long-term indicators like the Market Value-to-Realized Value chart. The current levels are close to long-term oversold levels but not quite there yet.
On the positive side, Bitcoin’s realized price—currently around $23,700—has acted as the bottom level in the past, although the price has moved below this support on all occasions. Thus, making values below the realized price ideal for long-term buying levels.
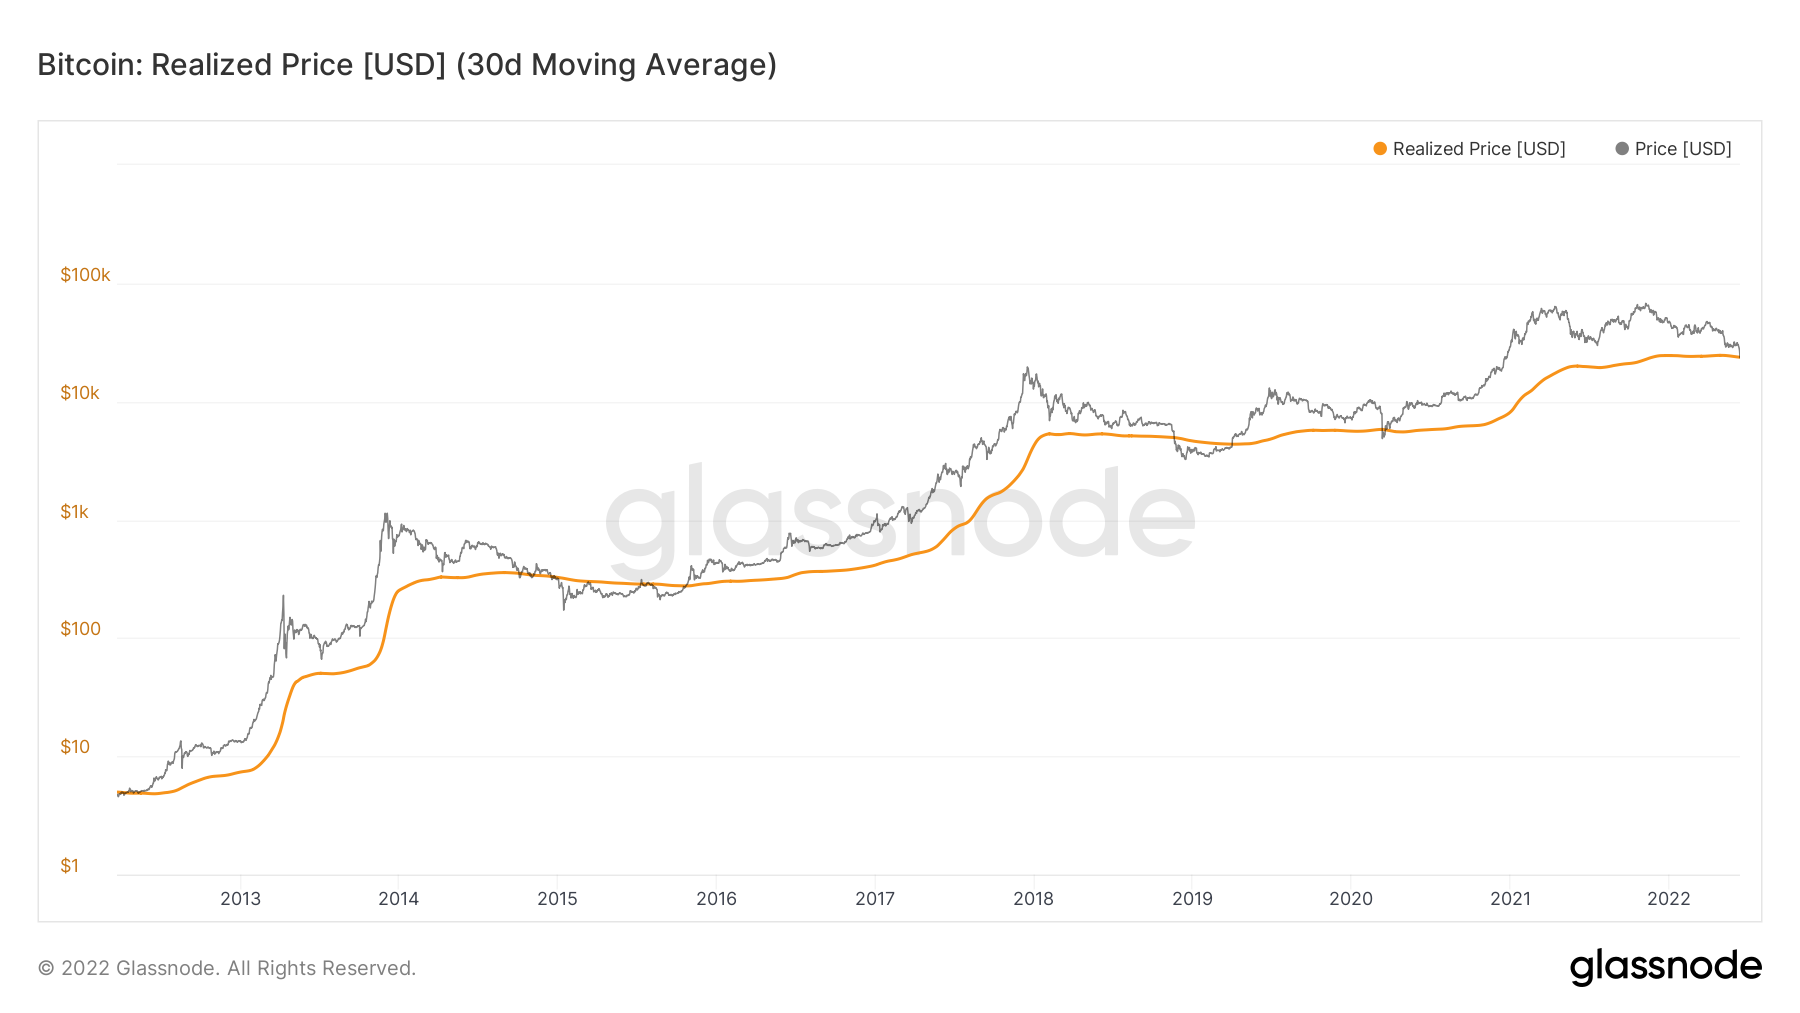
30-day moving average of Bitcoin’s realized price (Source: Glassnode)
Overall, there is a likelihood that the present bearish price action could finally mark the bottom levels, which should encourage buying. However, the headwinds from Fed’s actions will continue to weigh upon positive recovery.
Bitcoin’s Bearish Bias
It is difficult not to be bearish toward Bitcoin at this moment in time because traders are still selling rallies and the fundamentals surrounding the U.S. economy seem to be worsening quickly.
However, I cannot predict precisely where BTC/USD will find a meaningful price floor if we see a continuation of the downside that started last Friday following the release of U.S. inflation data.
Looking at the price chart on the daily time frame, it makes sense that BTC will eventually move back towards its 200-week moving average of $22,350 and probably test the former all-time high, close to $20,000.
I think many traders would be keen to buy around this type of price zone. However, it remains to be seen if $20,000 can hold the decline, as the BTC/USD price chart has other interesting price areas such as $18,000 and $16,300, which could also be favorable buy zones.
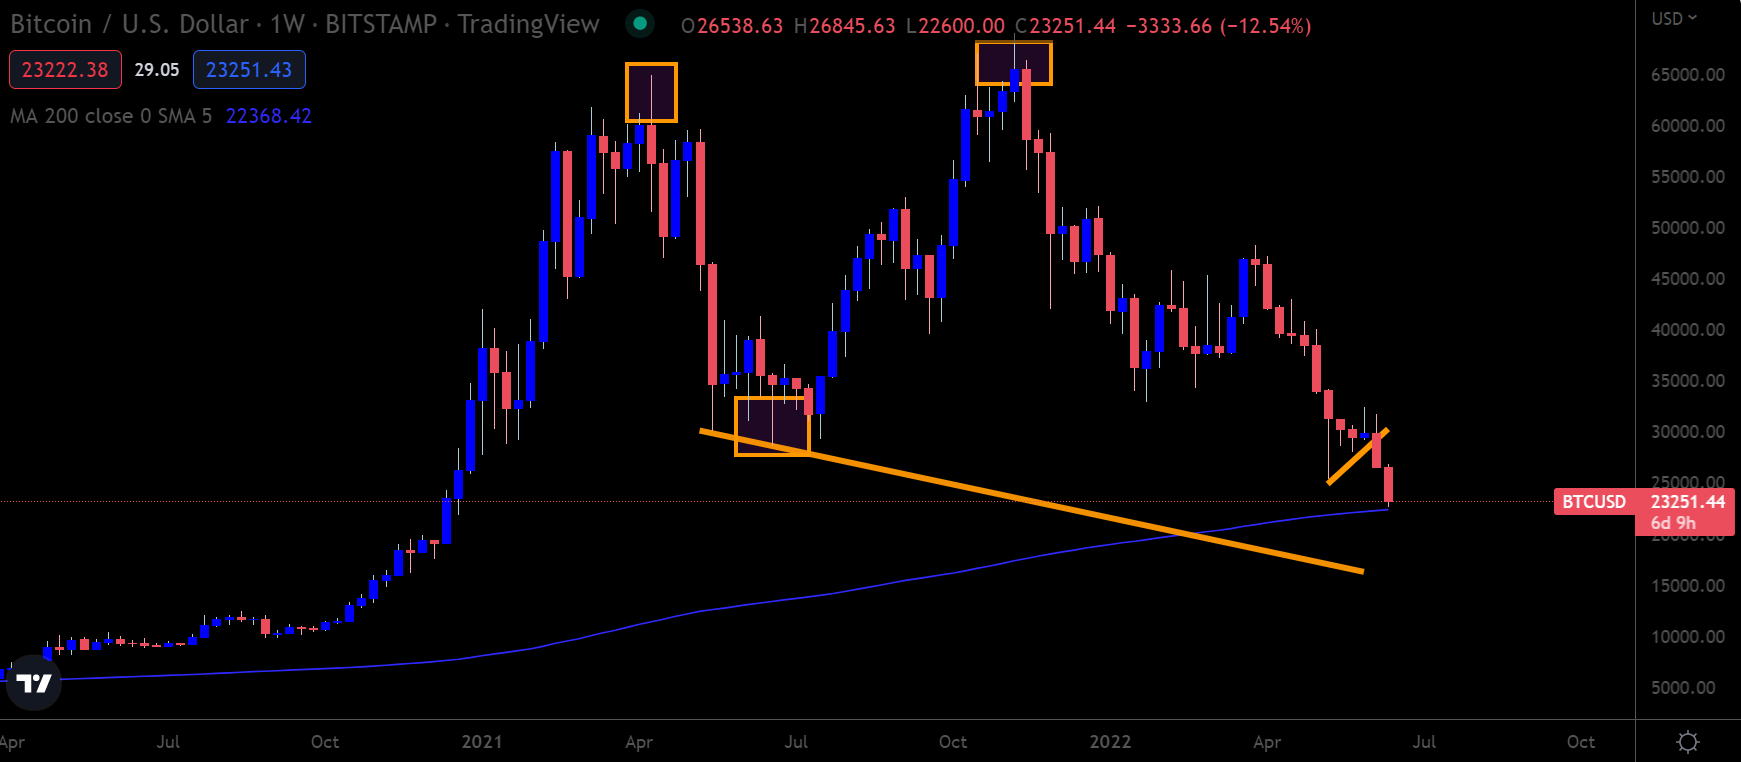
BTC/USD Daily price chart. Source: Trading View
ETH on the Ropes
ETH/USD has brushed aside the news that the Ethereum network is now in the final steps of its long-awaited Merge with the Beacon Chain and transition to Proof-of-Stake. In fact, the ETH on the Beacon Chain staked via Lido (stETH) faces a liquidation risk on various DeFi lending platforms due to a sell-off in stETH.
From a technical perspective, ETH has started to decouple from Bitcoin. Ideally, you’d want ETH/USD to fall proportionally to Bitcoin to strengthen its outlook as a sound monetary instrument. So far, ETH has moved in parallel with BTC. However, the recent decoupling is one of the reasons why ETH could reach sub-$1,000 price levels in the coming weeks.
Sustained weakness under the $1,400 level will strengthen the bearish outlook toward ETH/USD. It is the most compelling breakdown area on the price chart as it is the former all-time high from 2018. I am also not ruling out the possibility of a new range forming between $1,400 and $1,000.
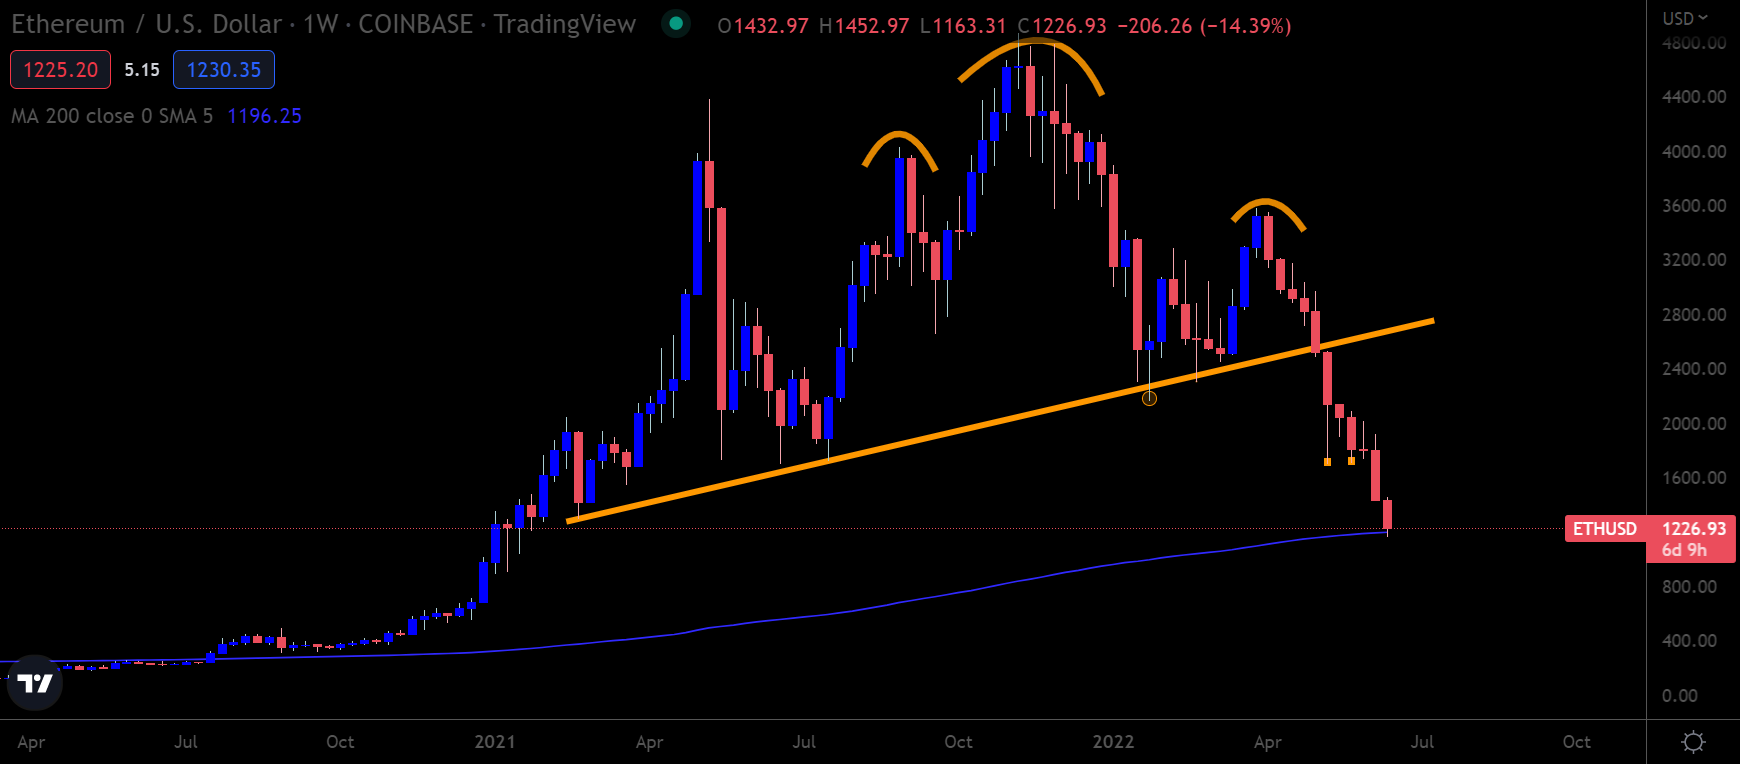
ETH/USD Daily price chart. Source: Trading View
Losing on SOL
Solana has surprised many people with how far it has dropped from its peak—SOL is coming close to losing nearly 85% decline from an all-time high of $260.
Alas! Many analysts tipped SOL/USD hitting $1,000. However, the price charts clearly showed that massive amounts of negative MACD price divergence had formed down to the $40 area last year; this divergence has been reversed.
I think, just like LUNA, you need to understand the fundamental backdrop behind Solana before you start to repurchase it. The frequent downtimes of the network are adding to investors’ fear about the robustness of the blockchain. Buying Solana because it is cheap has not worked since $70 or even $60. The value trade is not working right now.
For this reason, I will give Solana extra coverage in my usual War Room webinars this coming Wednesday. Breaking down what is happening with Solana during my educational segment with the SIMETRI analyst team seems to be the right thing to do, given that many subscribers are invested in this coin.
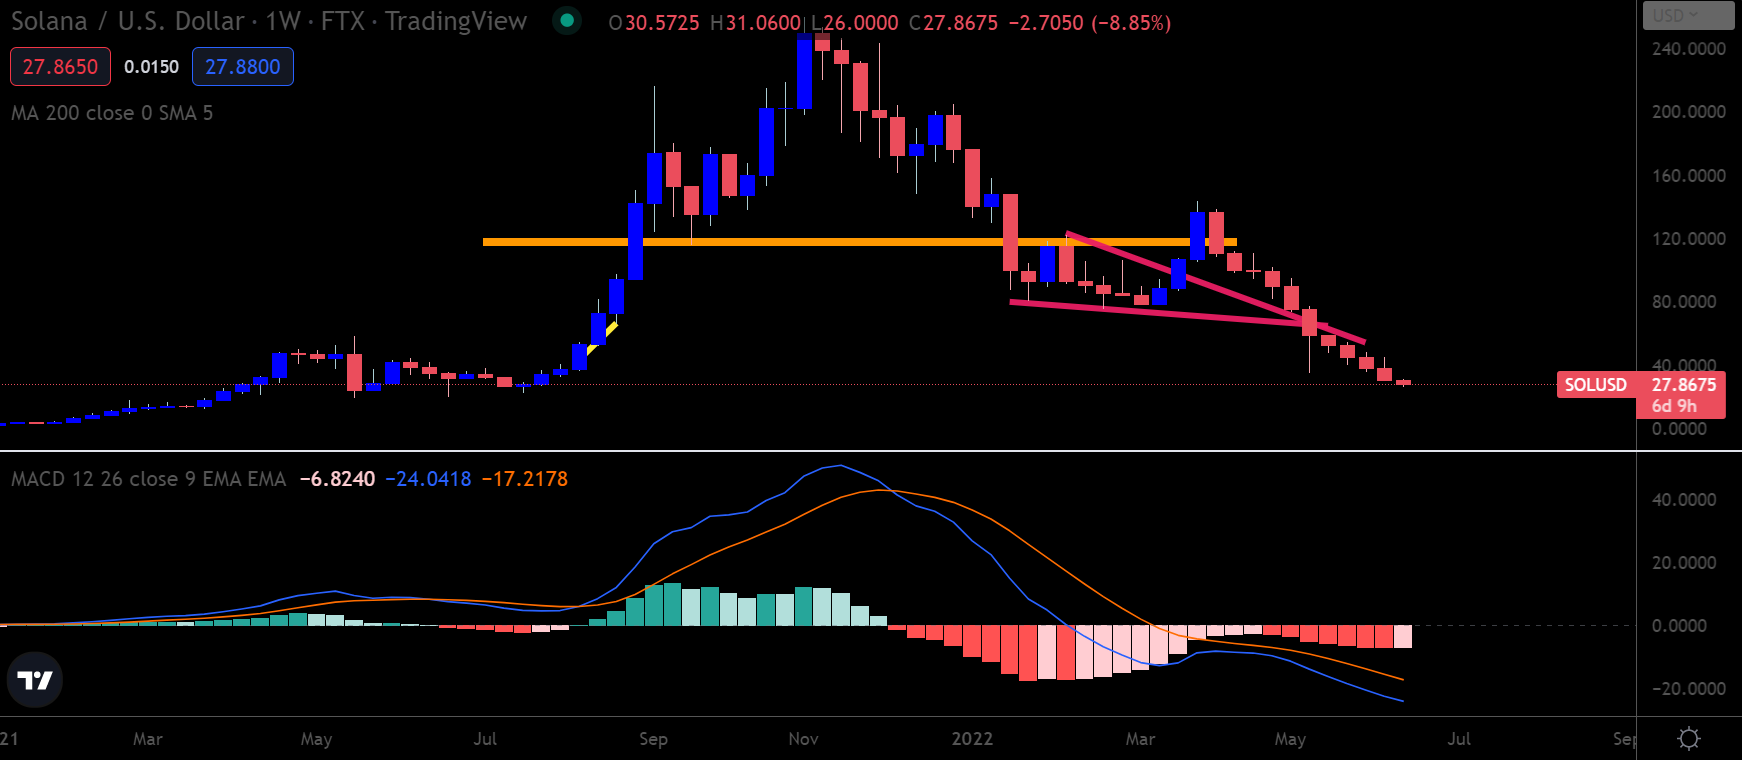
SOL/USD Daily price chart. Source: Trading View
Fear and Hype
It is fair to say that most of the losses in 2022 have been driven by fears of rising inflation, which warrants more aggressive rate hikes by the Federal Reserve. May’s inflation of 8.6% has further put investors on a back seat as they expect the Fed to continue its monetary tightening for the foreseeable future.
The only potential catalyst that can reverse this trend is the approval of Grayscale’s Bitcoin Trust shares to be traded as an Exchange Traded Fund (ETF). We’ll see the developments on that front starting next week.
For now, the sellers have the upper hand. There are few signs of buying volume, and the sell-off may continue until and after Wednesday based on the decreasing risk appetite and the extent of the Fed’s hawkish stance.
