Marginally Green Week

Bitcoin finally broke its record-breaking multi-week losing streak alongside the broader equities market last week. The cryptocurrency market posted its first positive trading week in over two months, closing the week at $29,900 with a 1.4% rise.
During the week, Bitcoin reached a high of $32,383 on Coinbase, but sellers soon arrived in numbers as the stock market began plunging over weak economic conditions.
The primary catalysts for last week’s price action in BTC and other cryptos were technical and fundamental. During the earlier part of the week, Bitcoin played catch up with the stock market to record gains. A continued rise in the S&P500 and the U.S. Nasdaq 100 further helped its surge.
News that China was scaling back on lockdown measures in Shanghai and Beijing boosted risk assets. The Government also introduced measures such as interest rate reduction to bolster the local economy, which alleviated some concerns about the ongoing global supply crisis. Weak Chinese growth has been a massive drag on risk-on sentiment.
However, towards the end of the week, Bitcoin started to give back gains. This was due to soft economic data from the United States, which gave further credence to the notion that the U.S. economy is slowing. A host of Fed speakers also responded with hawkish comments about further rate hikes.
The Fed & Grayscale
I see two competing narratives forming this month. First, and the more dominant one is aggressive rate hikes from the Federal Reserve, which are expected to come at the next Fed meeting, halfway through this month.
Second, Grayscale ETF decision by the U.S. Securities Commission, and the probable excitement leading upto the July 6 deadline.
For the first one, investors will look forward to the release of Friday’s U.S. CPI report for May as it will act as a key input before the Fed decides how much to hike rates next week.
Economists are expecting the recent trend of exploding prices to start to show early signs of slowdown. Make no mistake, this report will be pivotal going into the next Fed meeting, and it could have a substantial impact if we see a much hotter or lower number than forecast; the market expects core inflation around 5.9% and CPI print of lower than 8%.
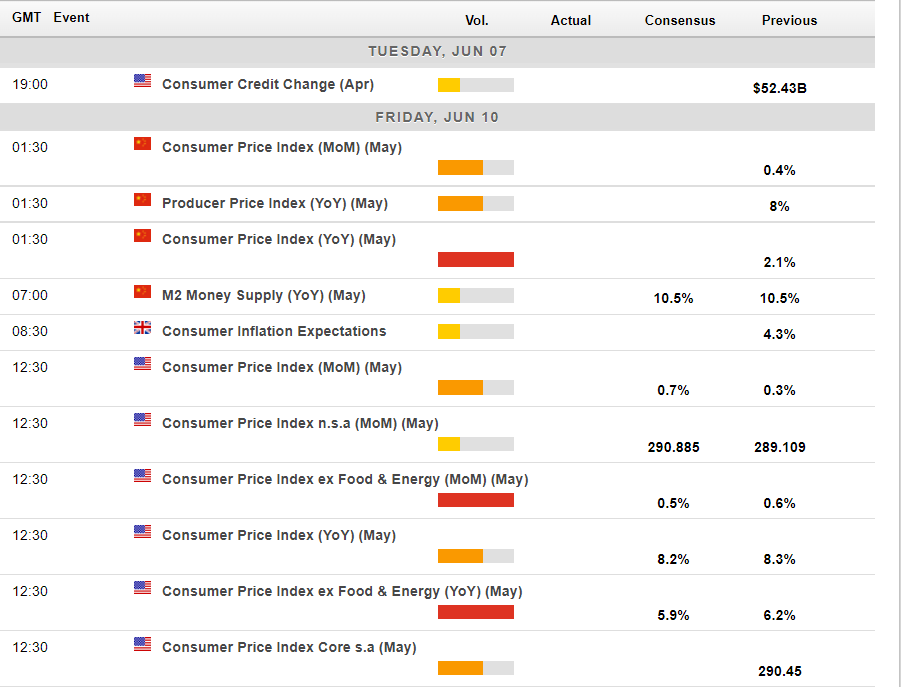
Economic calendar for this week. Source: Forexlive
The Fed’s monetary tightening policy narrative has dragged the crypto market into a poor shape. The ripples of the so-called “crypto winter” are now felt across the industry. For example, Coinbase recently announced that it would extend its hiring pause for the foreseeable future and rescind several accepted offers. Gemini, the brainchild of billionaire twins Cameron and Tyler Winklevoss, announced a 10% lay-off of its workforce, approximately 100 employees.
As noted in my webinar this week and in my daily emails, the crypto industry is really taking a hit right now. It may take weeks of solid stock market gains before confidence returns to the market or Bitcoin’s price action decouples entirely from the equities.
From a pure strategic point of view, and bearing in mind my above concerns, we probably need to be very careful leading upto the Fed meeting. Which means that timing could be important if you are expecting a recovery this month.
The one thing that could turn the crypto industry in less than one-months time is the Grayscale ETF decision. Grayscale said they intend to maintain an open dialogue with regulators and policymakers ahead of the decision.
Grayscale is confident that converting its marquee product, Grayscale Bitcoin Trust (GBTC), into an ETF would “protect investors and the public interest.”
In February, the SEC said it received close to 200 letters pushing for it to approve Grayscale’s application in response to a public campaign launched by the digital asset manager. The decision will be pivotal for market sentiment for the last two quarters of 2022.
On-chain
The on-chain picture remains strong with signs of long-term accumulation. However, there remains a risk of capitulation in the short to medium term.
The percentage of Bitcoin’s last active supply 1+ years ago, i.e. BTC unmoved for more than a year, reached an all-time high of 65%, suggesting strong hand sentiment among investors despite the corrective period of last year.
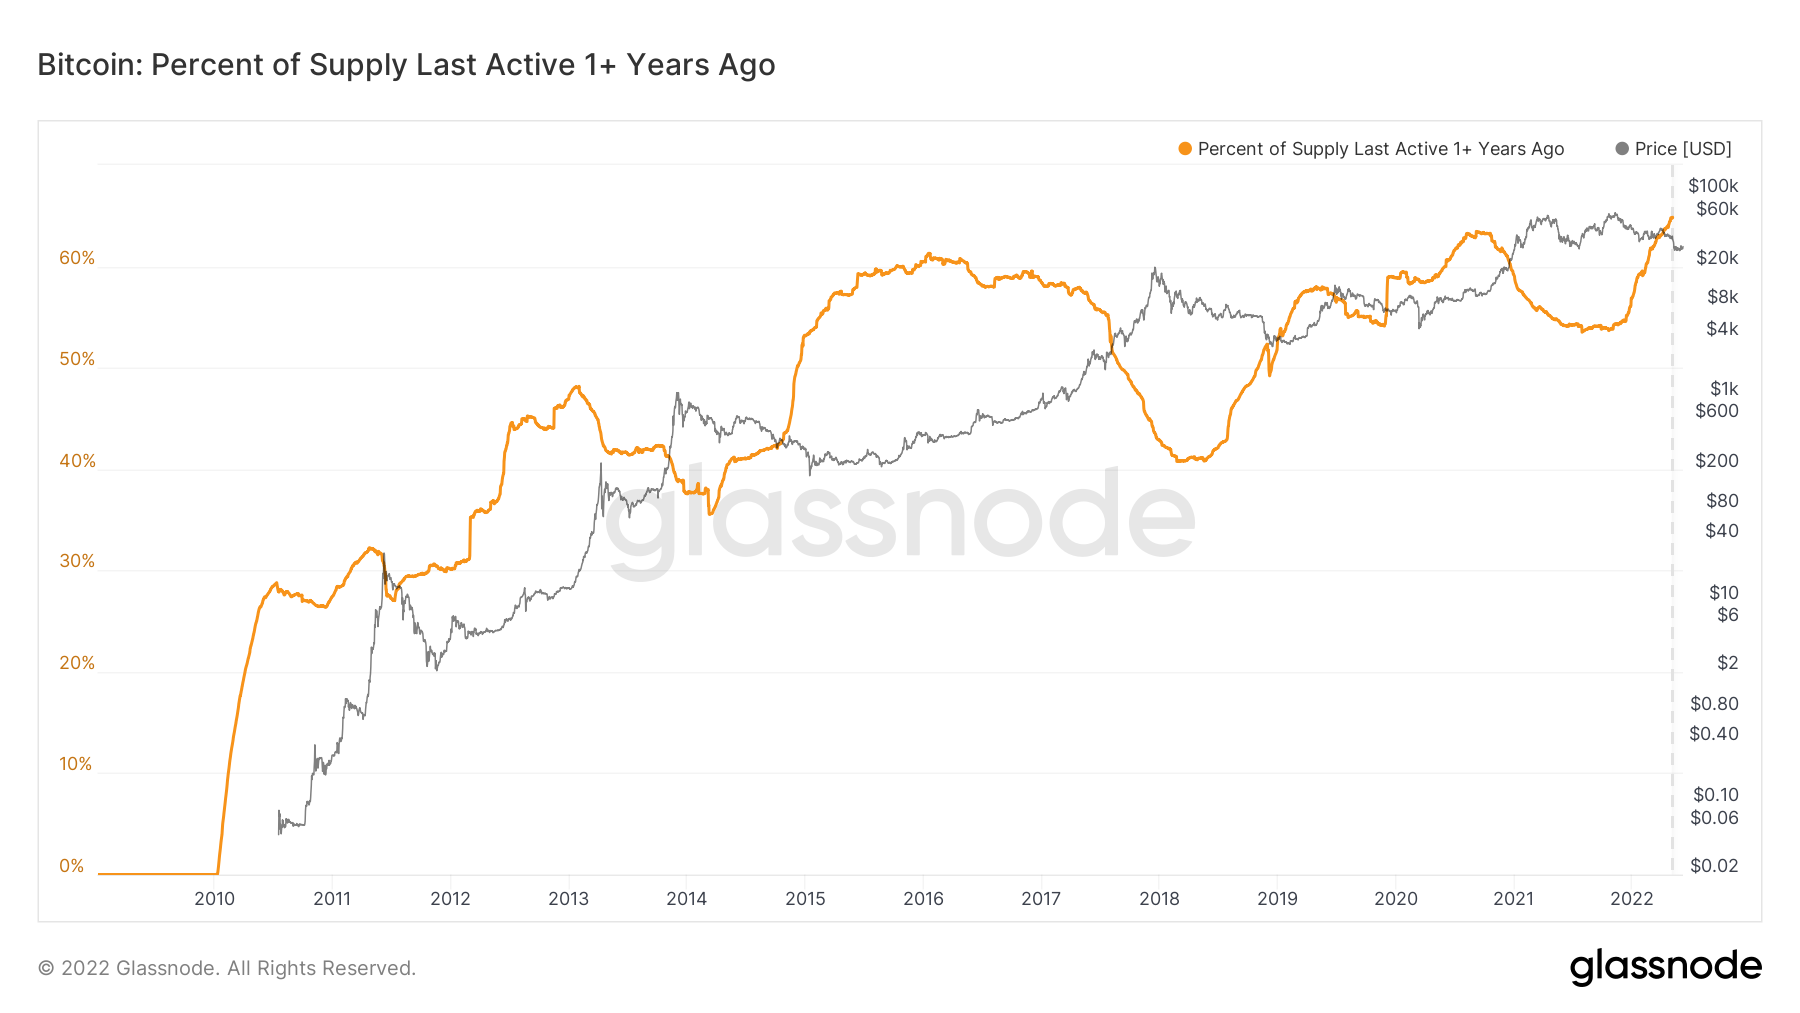
Percentage of Bitcoin supply unmoved for more than a year. Source: Glassnode
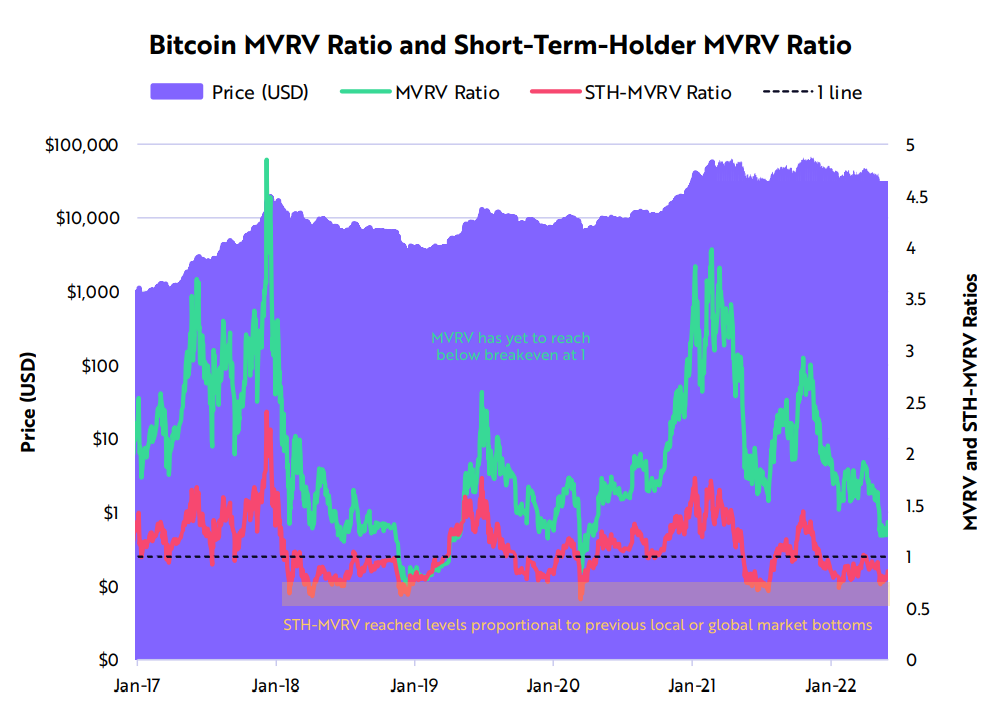
The HODL waves indicator of Bitcoin confirms the above observation that short-term holders have reached bottom levels. Ark Invests’ monthly Bitcoin report read that “short-term holders have capitulated,” however, the “aggregate holders— both short- and long-term—remains above its breakeven price,” demanding capitulation for these holders.
The Supply Distribution chart from Santiment is also sending mixed signals. According to the data, the supply held by super whales—addresses with 10,000 to 100,000 BTC—has reached an all-time high. While highly encouraging, it does not signal a rally in the short term because this cohort of buyers is usually not price sensitive.
The worrying part about the current distribution is the recent sell-off from mid-tier whales—wallets with 1,000 to 10,000 BTC, which now sees them at the lowest level of supply held this year. Moreover, increased holdings among retail investors—wallets with <10 BTC, also warrants a panic sell so that large holders can scoop from them at cheaper prices.
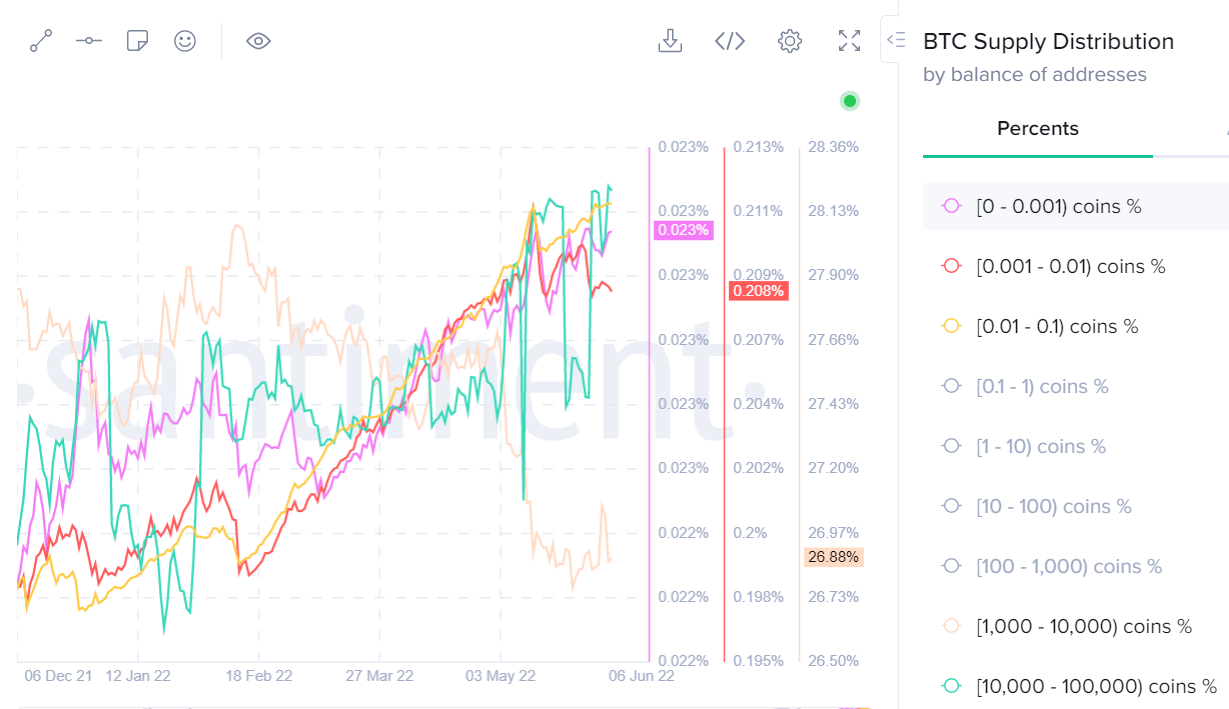
Bitcoin’s supply distribution chart. Source: Santiment.net
As mentioned over the past few weeks, the decline in Bitcoin’s price below the production cost of less efficient miners adds to the selling pressure as they struggle to cover operation costs or wind up permanently. Last week, the miner inflows to exchanges spiked to a three-month high, raising concerns about miner capitulation.
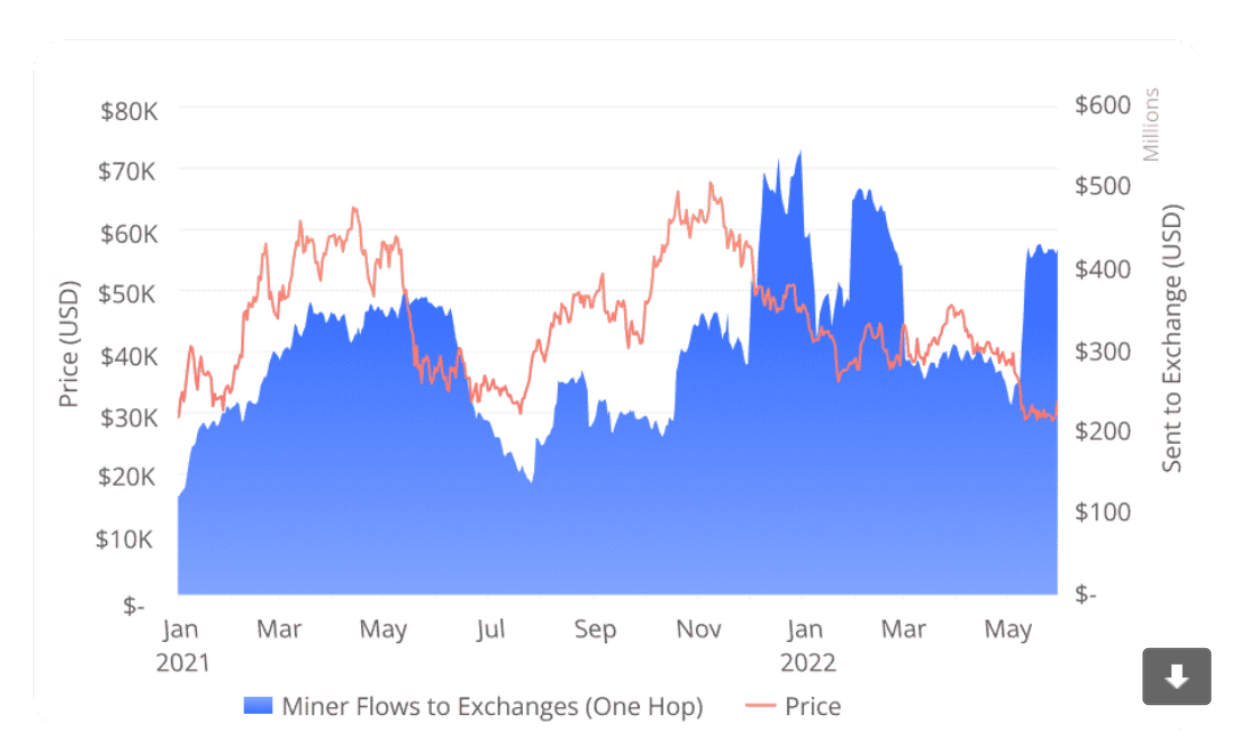
Bitcoin miners flow to exchanges. Source: CoinMetrics.io
If Bitcoin’s price prolongs below $34,000, i.e., the breakeven cost for least efficient miners, they would no longer be able to sustain operations and would have to quit en masse, which will likely accompany a price capitulation as well.
Overall, it appears that large buyers are taking advantage of two-year base prices to accumulate BTC, and we’ve seen some positive signs of long-term capitulation. However, based on previous bottoms, there will likely be more pain ahead; or at least, the accumulation between $30,000 to $40,000 should persist in the medium term.
BTC to 50-Day or 200-Week MA?
I see two possible scenarios for Bitcoin over the coming week. Both are equally as plausible, meaning that trading BTC/USD at the moment is still somewhat of a coin flip, which is not ideal.
The bullish scenario would see Bitcoin holding above its 20-day moving average (MA) and making a test towards its 50-day MA, around $34,700 over the coming weeks. This is plausible if dip-buying looks strong around the 20-day MA.
The bearish scenario would see Bitcoin continuing its broader downtrend, slicing through the $28,000 to $27,000 resistance cluster and breaking under the yearly low, close to $25,000 support.
Should the latter scenario happen, I think it is highly likely that the 200-week moving average gets tested, around $20,000. Since Bitcoin’s inception, the 200-week has been a pivotal launch, support, and longer-term trend watchpoint.
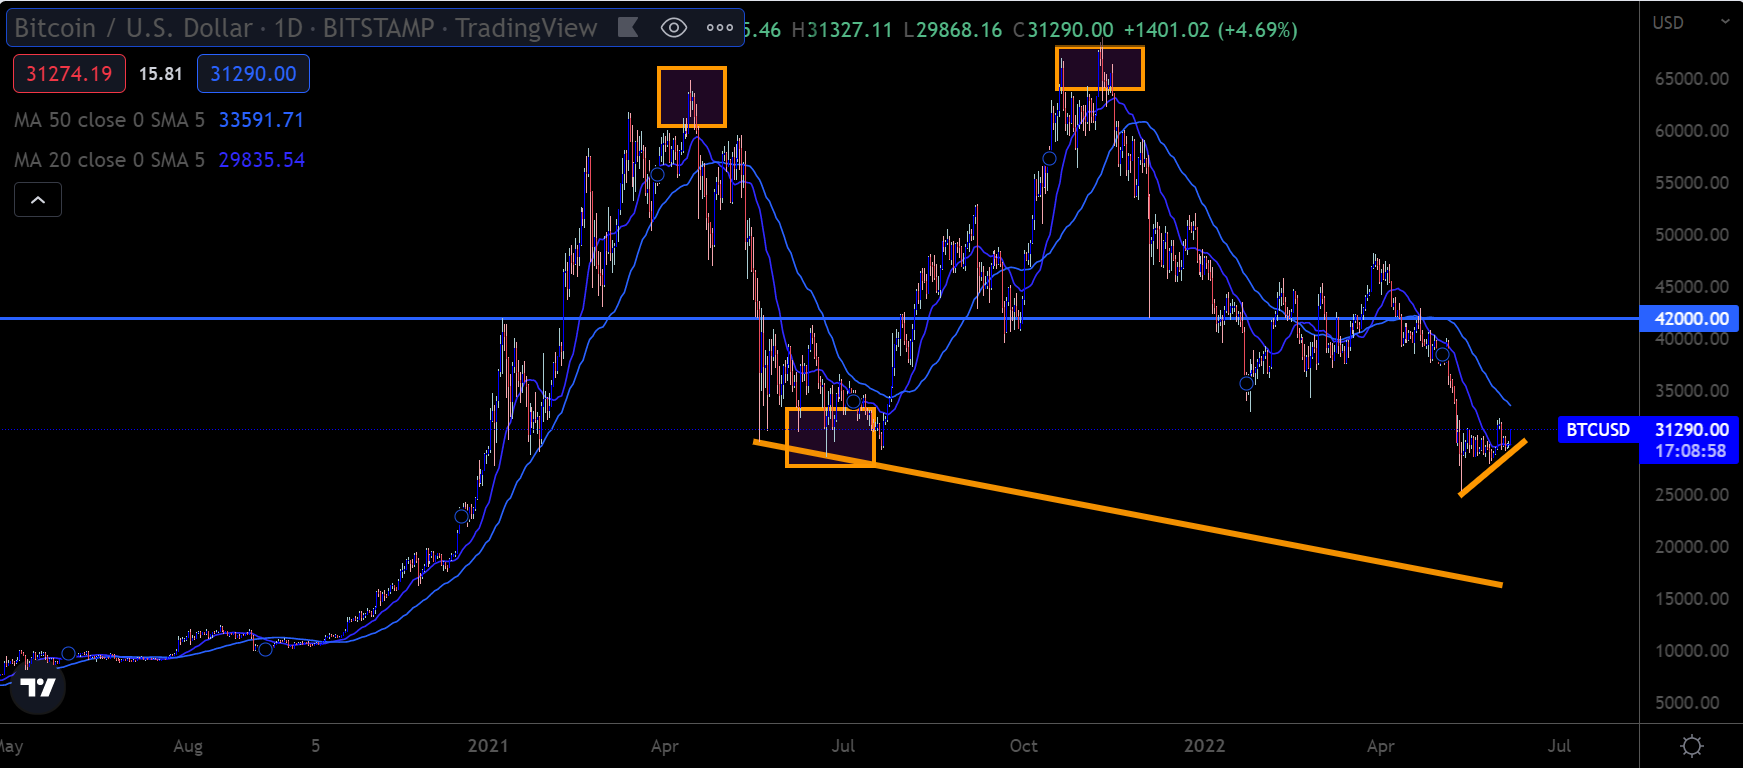
BTC/USD Daily price chart. Source: Trading View
Ethereum’s Decision Time
Ethereum finally showed some signs of life last week; however, the recovery was short-lived as the early-week move towards the $2,000 resistance level fizzled out quickly.
The emergence of the double-bottom price pattern failed to generate the needed upside momentum that could have taken ETH/USD towards the $2,200 or $2,300 level as the pattern first indicated.
This week it will be crucial for the ETH/USD pair to determine its path for the near future. It could be a break under the yearly low of $17,000 to test the $1,400 support level or consolidate and rise back towards the $1,900 or $2,000 level.
Much will depend on how traders start to get positioned going into the Fed meeting and the aftermath of the U.S. CPI report, which will more likely than not be a significant directional catalyst for the crypto market.
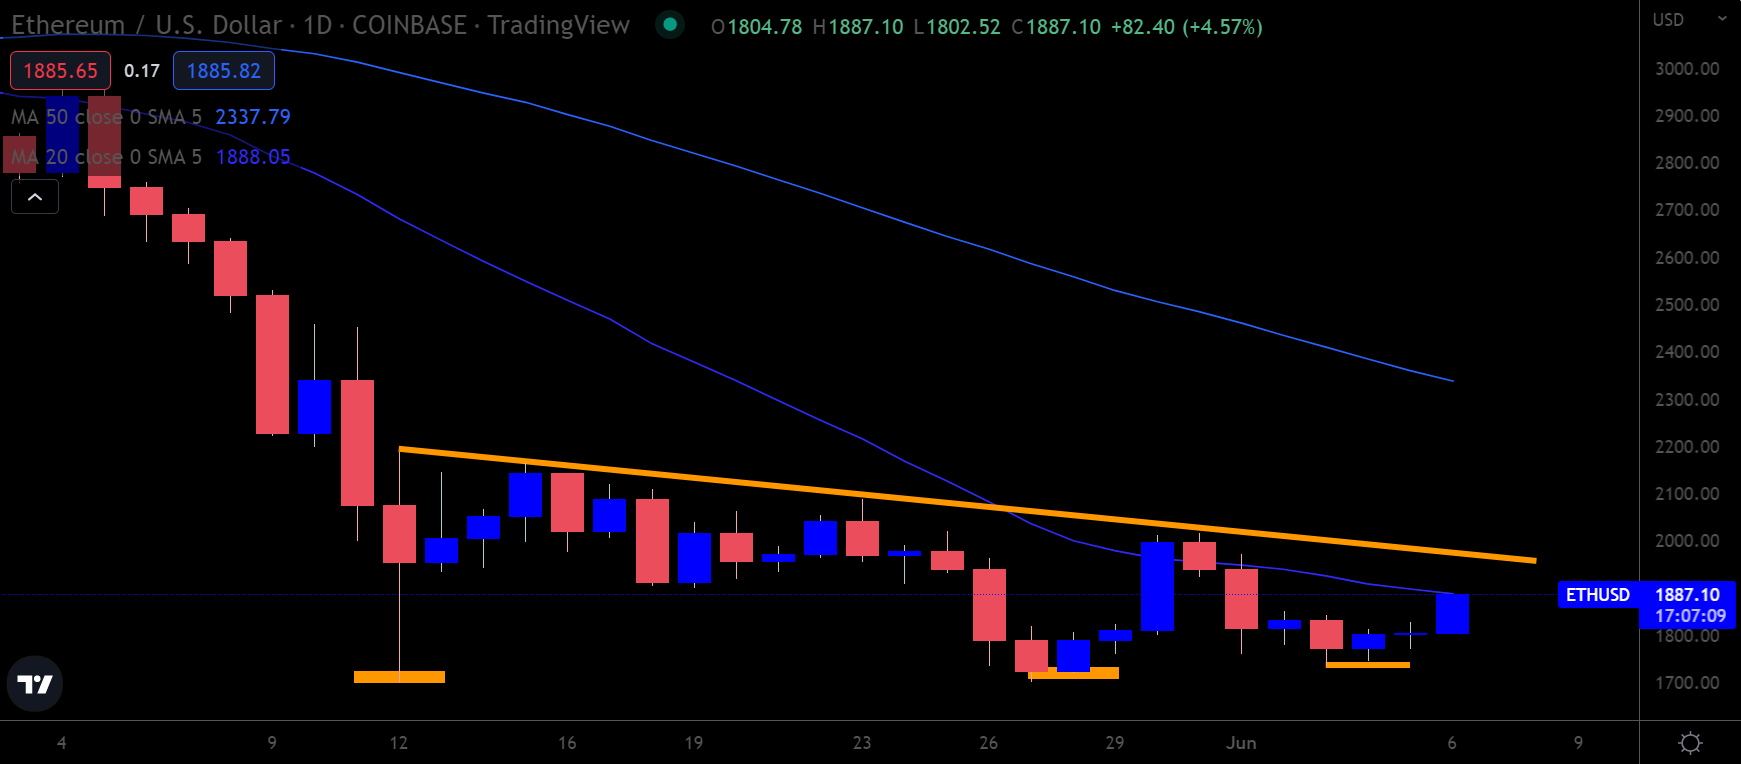
ETH/USD Daily price chart. Source: Trading View
Nothing Yet for the Rest of the Market
Unless you are short Litecoin from higher levels there is very little to be optimistic about at the moment. The technicals for LTC/USD look bleak over the medium-term. Without a new short or medium-term bullish trend in Bitcoin, Litecoin’s recovery looks bleak. The same applies to the rest of the market.
The price action is not really telling me much at the moment, except for it is probably not the best time to look to buy LTC/USD. As I mentioned earlier, LTC/USD is mostly worth a punt on the long side when BTC/USD is trending higher.
With that said, the short-term technicals show that a bullish double-bottom price pattern could be forming. Still, betting on a bullish reversal is going to require a lot of confirmation and hope in these current market conditions.
In terms of bearish targets, I think it really depends on what Bitcoin does. If we see Bitcoin hitting $27,000 or even $25,000, we could well see Litecoin starting to break under $50, which would be extremely negative from a technical perspective.
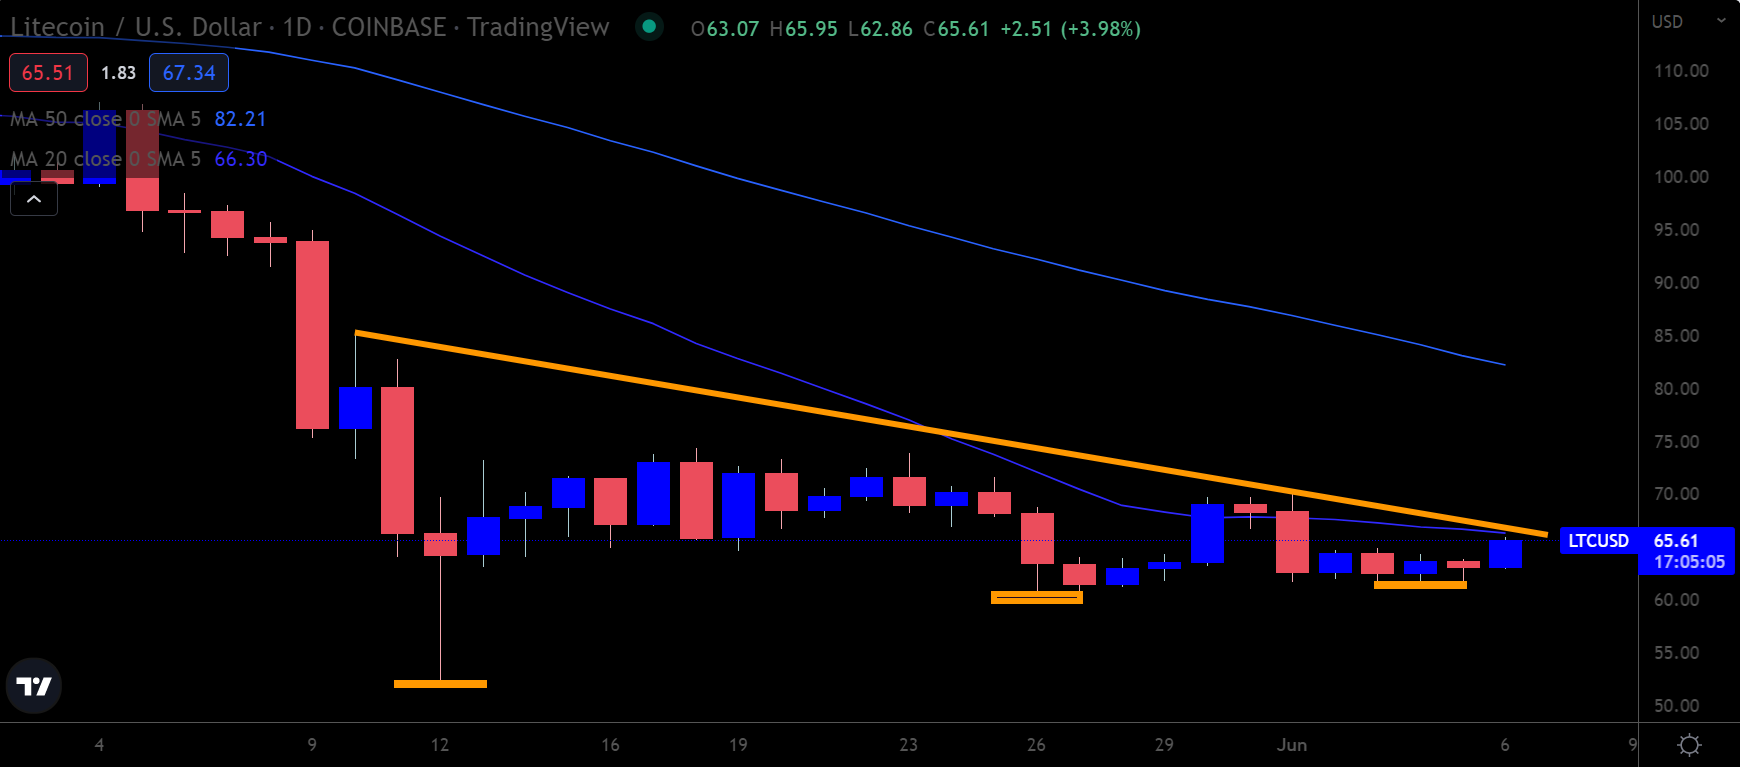
LTC/USD Daily price chart. Source: Trading View
Looking for Certainty
Despite a marginal recovery last week very little has changed in terms of the fundamental and technical background. In fact, one could make the case that the economic situation is getting worse.
Tesla CEO Elon Musk said last week that he has a “super bad feeling” about the U.S. economy in an email to executives seen by Reuters. Musk estimates that the recession will last between one year and eighteen months.
A major recession would be very bearish for Bitcoin over the medium to long-term, and this is just one reason why we could see a further significant decline unless a seriously bullish catalyst, such as the Bitcoin ETF, emerges, or the Fed changes its hawkish stance.
