On the Fence

Last week, bitcoin crashed towards the $25,000 area due to a bank run in Terra’s stablecoin and global inflationary worries. The selling pressure broke the market’s threshold on Thursday, causing one of the biggest sell-offs in crypto market history. The total crypto market capitalization dipped by 40% to $1.09 billion.
After the market crash, another threat became apparent. If Bitcoin’s price falls below $21,000, MicroStrategy’s $205 million BTC-backed loans will get liquidated. Given the company’s extensive treasury holdings of 129,218 BTC, its CEO is confident of avoiding the crisis by putting more collateral. Still, the $21,000 level now holds considerable psychological importance. A breakout below this support can cause a price drop of a similar proportion to last week.
On the macro front, risk-on assets face significant headwinds due to inflation and the consequent quantitative tightening by the U.S. central bank.
The U.S. consumer price inflation (CPI) report for April was 0.2% higher than the expected value of 8.1% last week. The statistics painted a grim picture of the economy where inflation continues to rage near historically high levels. In all likelihood, the Fed will be forced to raise interest rates throughout the year, putting pressure on stock and crypto.
Elsewhere, the world’s second-largest economy faces a slowdown due to the recent resurgence in COVID-19 cases. The extended lockdowns in Shanghai and mandatory testing in Beijing further delay the restoration of normal output levels. This will further reduce the supply of goods in the global economy, increasing inflation.
The crypto market has effectively plunged into a full-fledged bear trend. There’s a slight possibility that last week’s capitulation event marked the bottom of this cycle. However, I remain skeptical because of the negative market fundamentals and some on-chain indicators.
More Concerns
Last week I wrote about my “genuine concerns” for the market, and this was based on the wholly bearish price action I saw with Bitcoin below $40,000. My concerns have now amplified because of the grim macroeconomic outlook.
On Monday, China’s National Bureau of Statistics reported a slowdown in factory outputs, consumer spending, and a two-year high unemployment rate for April. As the world’s largest exporter, a slowdown in China’s output means additional supply constraints, increasing global inflationary worries.
Over the next couple of months, I don’t expect the inflation rate in the U.S. to start retreating soon. This will put a lot of pressure on the economy, and more interest rate hikes will continue to create an adverse environment for the growth of risk assets.
China also remains precarious, with a low prospect of a meaningful recovery. The People’s Bank of China will decide on the benchmark borrowing rate on Friday. While an interest rate cut sounds like the optimum solution for China to revive the economy, it can lead to a depreciation of the Chinese yuan as the U.S. dollar moves towards higher yields. Thus, adding to the uncertainty in the market.
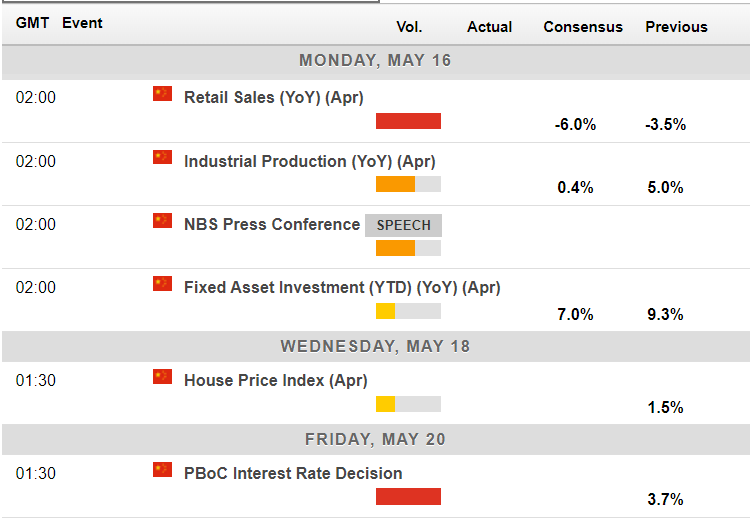
Economic calendar for this week. Source: www.forexlive.com
So Close to a Bottom Yet So Far
As Bitcoin tagged $25,400 last week, it resulted in long-liquidations of Bitcoin futures orders worth $500 million, with total crypto liquidations exceeding $1.2 billion.
A significant reduction in the total futures open interest (OI) volume from $17.4 billion to less than $14 billion suggests that many traders also exited their positions during last week’s volatility. However, there’s room for more downside as last year’s low for OI was $11 billion and before the 2021 bull run, it ranged between $4-5 billion.
Signs of panic selling were also visible with spot Bitcoin transactions. The net realized loss reached summer 2021 levels as BTC holders moved their holdings in losses. A spike in the exchange inflows confirms this theory of selling among weak hands.
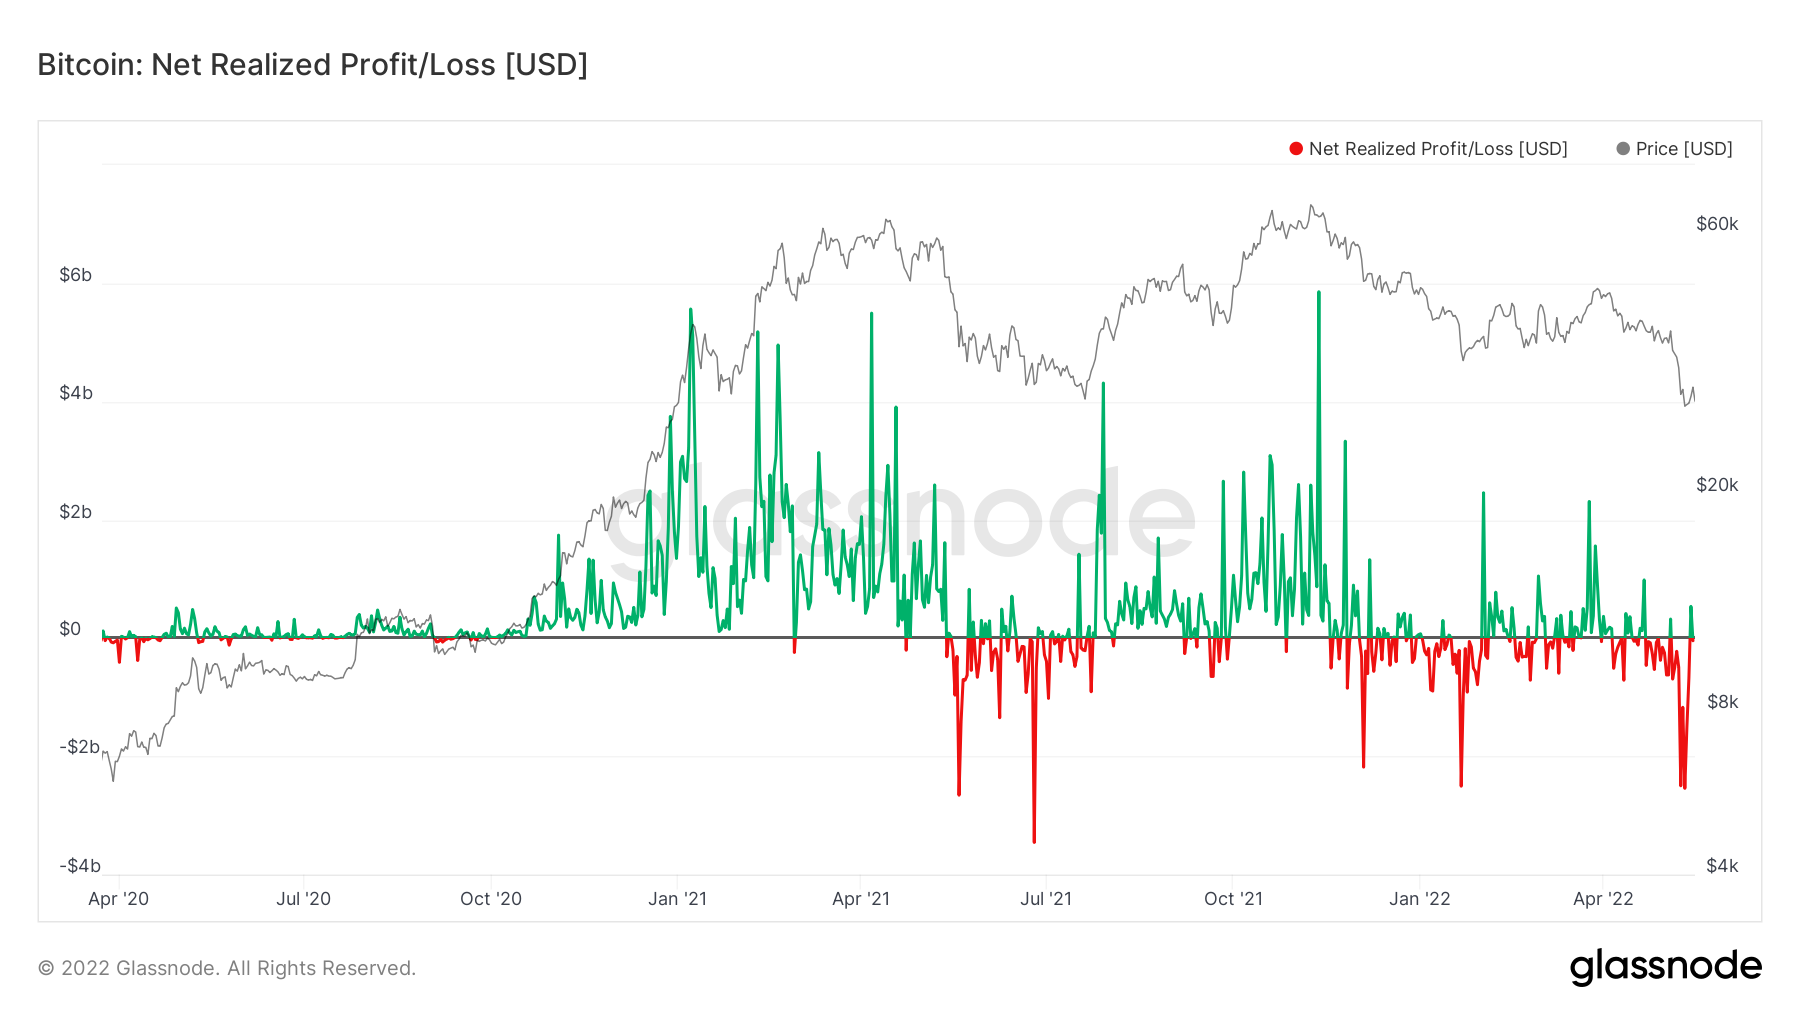
Bitcoin Net Realized Profit/Loss. Source: Glassnode.
The main question on every investor’s mind now is whether last week’s capitulation candle was the final one or there’ll be more to come. To answer this question, let’s look at the long-term bottom indicators.
Bitcoin’s MVRV Z-score reached close to the historical oversold region. The score determines the relative market value of Bitcoin to its realized price. The realized price is calculated by valuing each transaction by the price when it last moved.
Based on the previous bottom levels, there will likely be one more flush-out event before confirming the generational bottom. Nevertheless, given the price is extremely close to the oversold region, a relief rally to the upside shouldn’t surprise market participants.
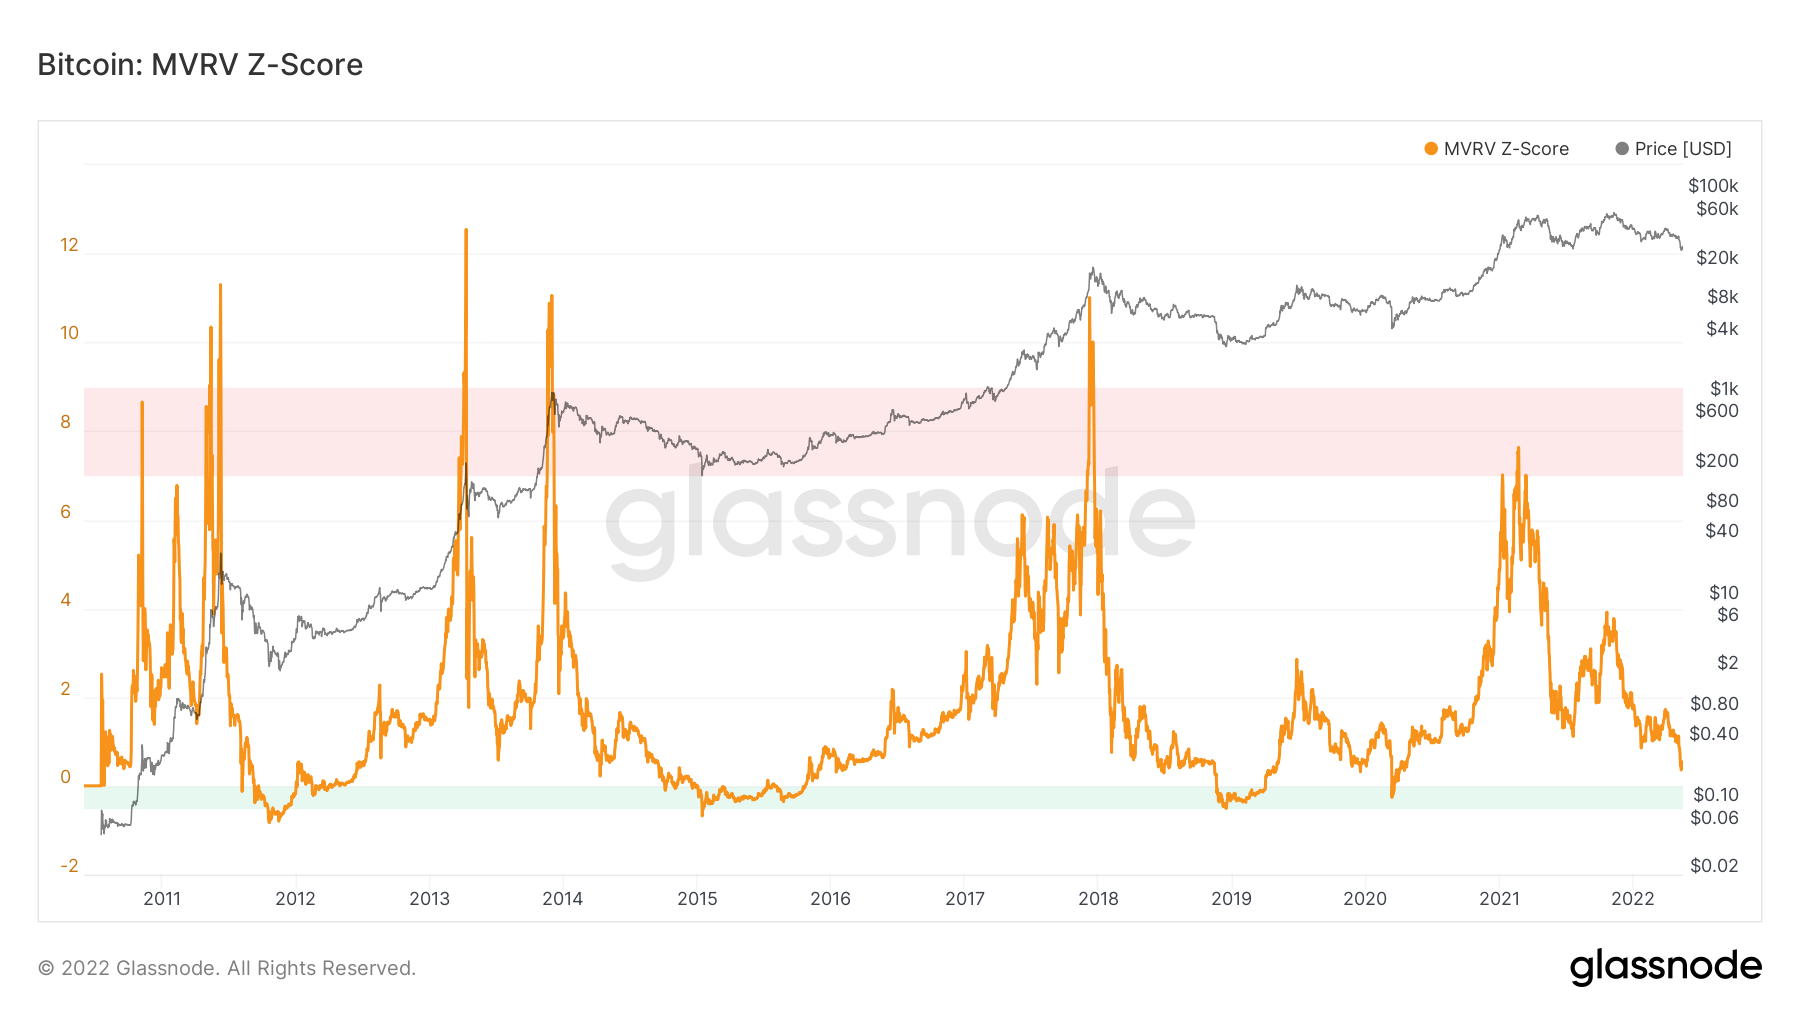
Bitcoin MVRV z-score. Source: Glassnode
Last week, I discussed the implications of BTC price moving into the product cost band between $33,800 and $20,300. The less efficient miners incur a net loss by operating their machines at the current price. A capitulation of these small miners will likely keep the selling pressure intact in the short term.
Moreover, another indicator that takes the supply side dynamics into account is the Puell Multiple. It measures the ratio between Bitcoin’s daily issuance in dollar value and the 365-day moving average, providing an insight into total miner revenue relative to market conditions.
This indicator dropped below 0.6—marginally short of oversold levels in last week’s sell-off. Based on the 2018 bear market, Puell Multiple reading currently mirrors the $6,000 price level, where BTC spent quite a bit of time before breaking to $3,000 lows. It is also evident in the MVRV z-score above.
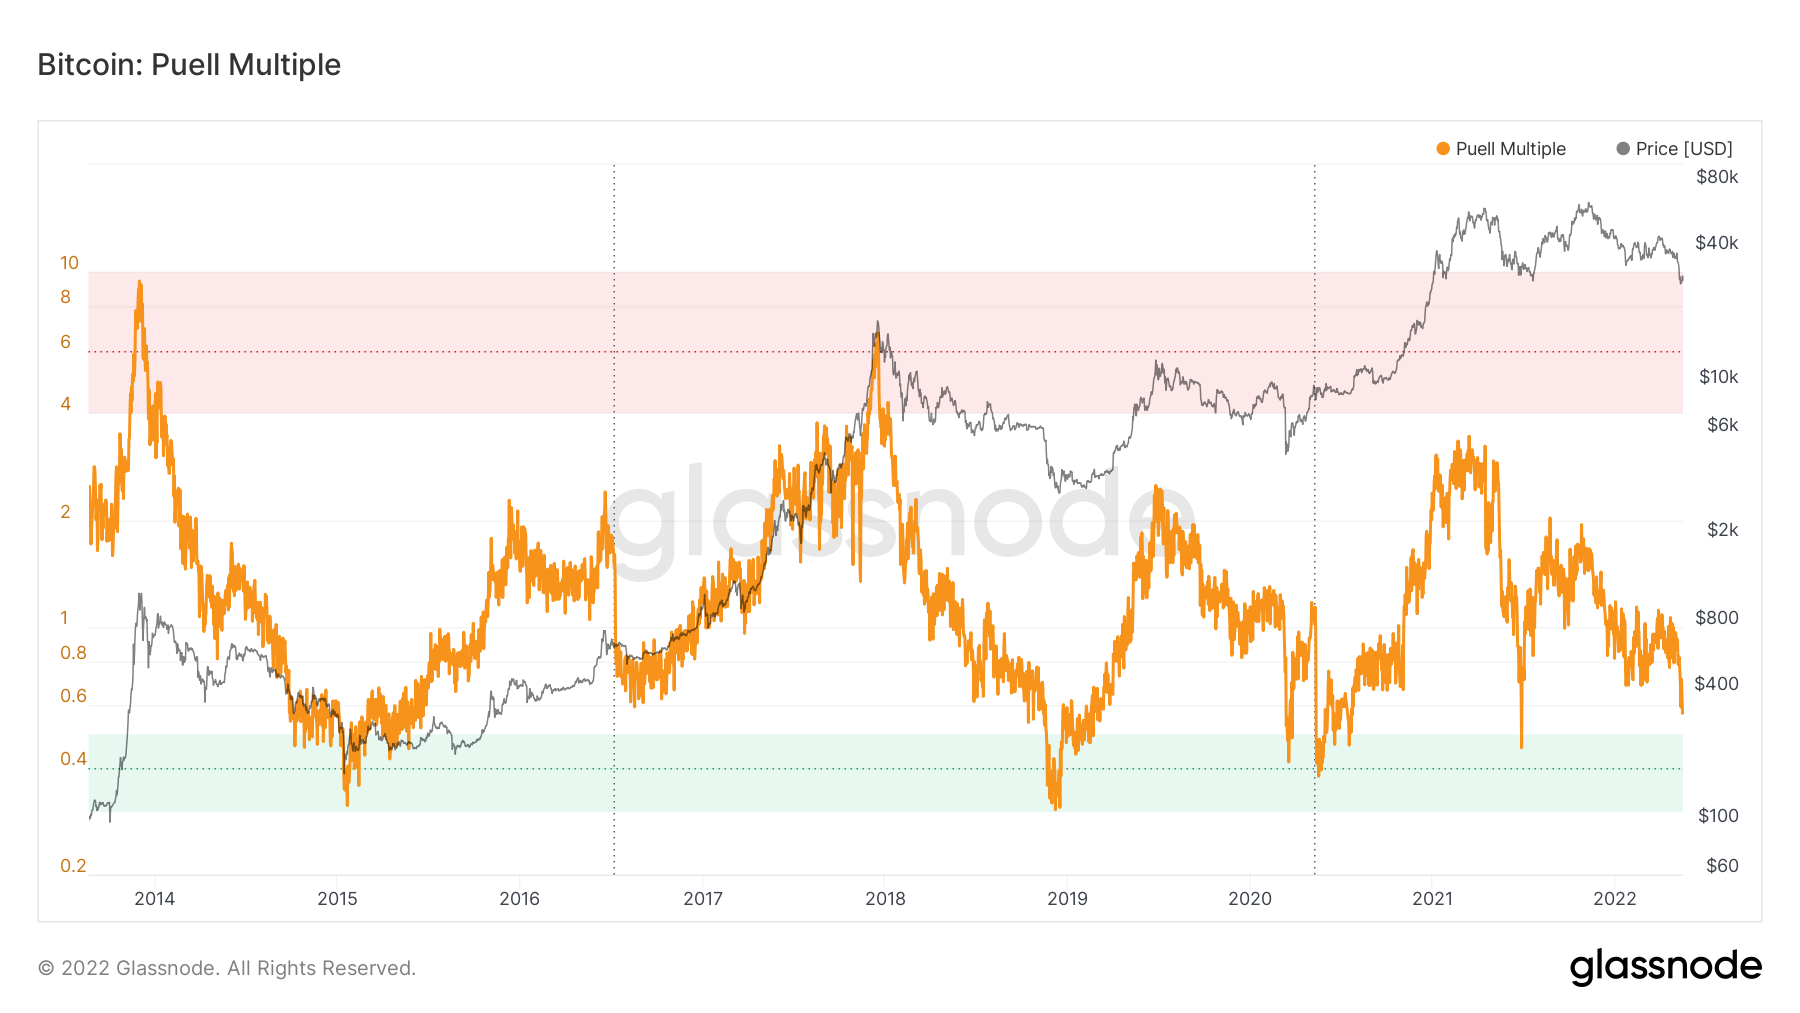
Bitcoin Puell Multiple. Source: Glassnode
Given how Bitcoin bounced from $30,000 last year, this region will likely resist further sell-off, forming a strong support area. However, if sellers are able to dominate the market, it will likely cause another dip, likely below the previous peak of $20,000.
In conclusion, it appears that BTC is close to optimum long-term buying levels. However, in the short-term, there’s considerable risk of another capitulation event.
Bitcoin’s Hung Jury
The most apparent chart pattern on a higher time frame for BTC/USD is the large head and shoulders pattern (H&S) that got activated last week. The target for sellers based on the formation is $17,000.
However, Bitcoin has a nasty habit of invalidating H&S patterns. I think some hope exists this week that BTC could reverse its trend if sellers fail to make a new yearly low below $25,400.
In the event of a positive reversal, a bullish double pattern would get activated with the $28,000 to $27,000 area as support. The neckline of the H&S pattern at $36,000 will be the initial target for bulls.
On the downside, should Bitcoin croak below the $25,000 support area, I would expect to see a test of $21,000.
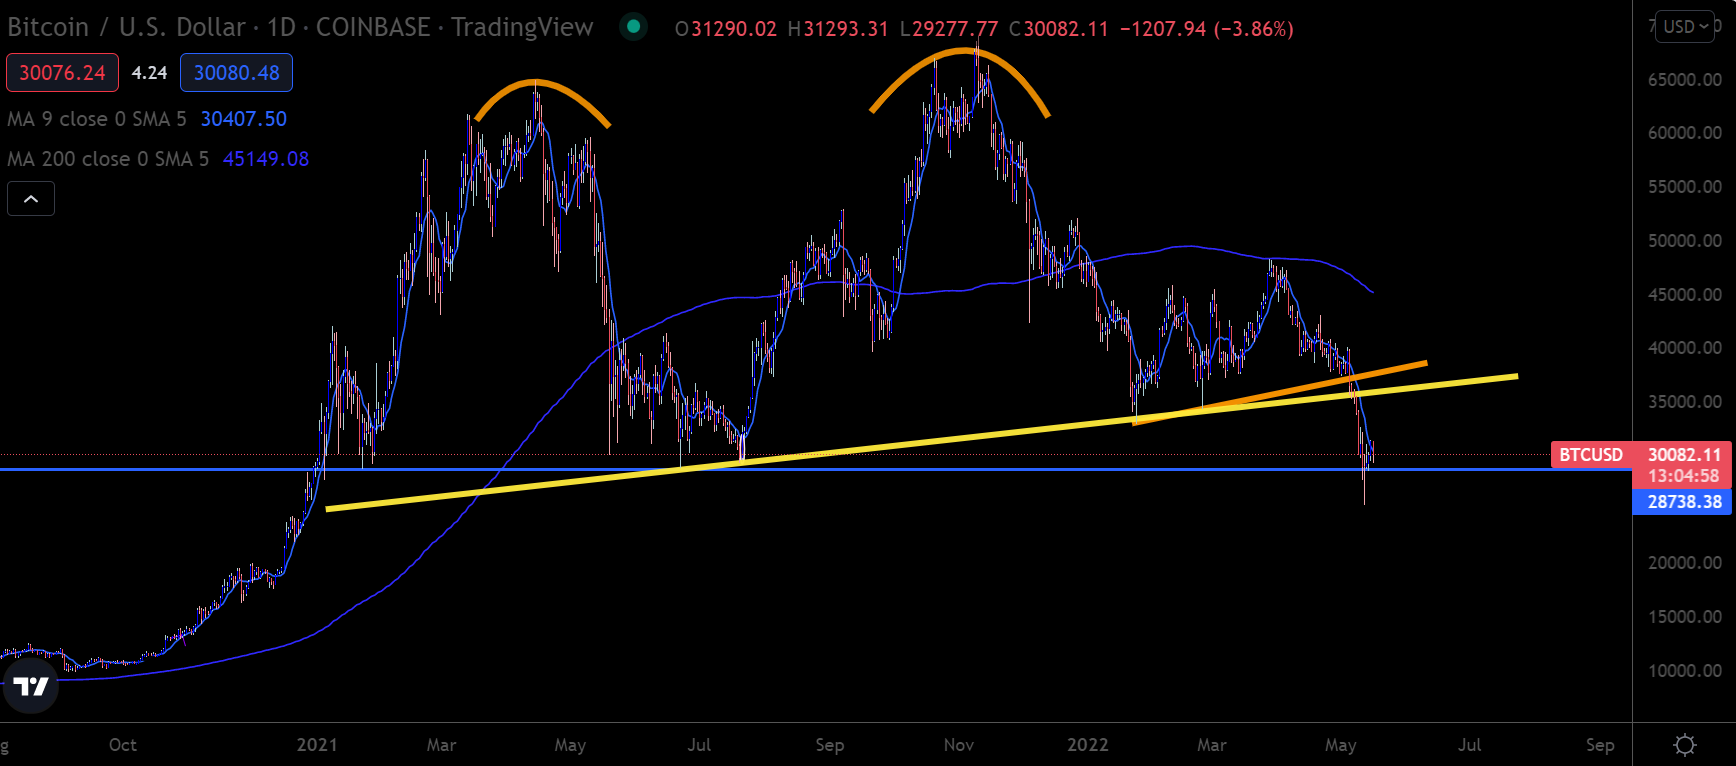
BTC/USD Daily price chart. Source: Trading View
Ethereum’s Triangle Watch
Ethereum sellers ignited a very nasty triangle pattern with a breakout below $2,500. As the downturn spills lower, ETH/USD chart appears to have formed a head and shoulders pattern with its neckline around $2,000. A breakout below this level threatens a decline towards $800.
Last year’s low of $1,700 is a crucial support area for the buyers. This level was tested during last week’s decline. Should the buyers fail to protect this level, ETH could swiftly move down to $1,200.
On the upside, a possible double bottom formation similar to Bitcoin is likely. If buyers hold the price above $1,700, we could easily see a test of support-turned-resistance level at $2,500.
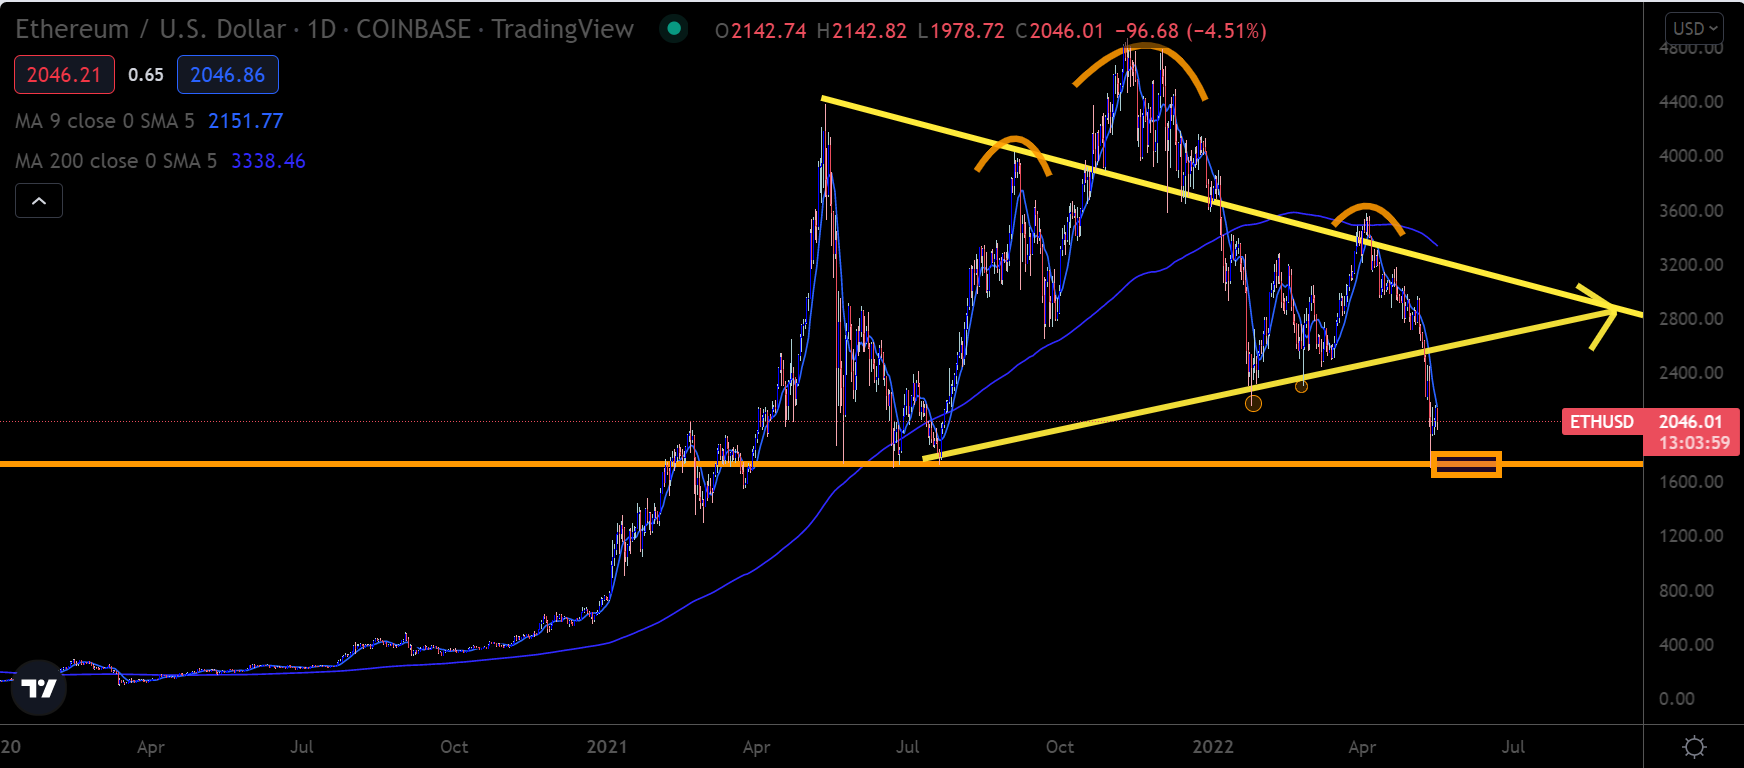
ETH/USD Daily price chart. Source: Trading View
XRP Proxy Work on Point
Last week I mentioned that I was looking for 0.35 cents support level in the XRP/USD chart as a possible proxy of a crypto market bottom.
Fortunately, the drop briefly extended below $0.35 before the market started to reverse.
The collapse of the crypto market was evident as XRP tagged 2020 levels. That’s why I like to use market proxies like XRP, while the charts look messy on top coins like BTC and ETH.
This week, if XRP buyers hold above $0.35, then XRP can stage a big rally towards $0.52. Moreover, that will have enormous implications for the market if true.
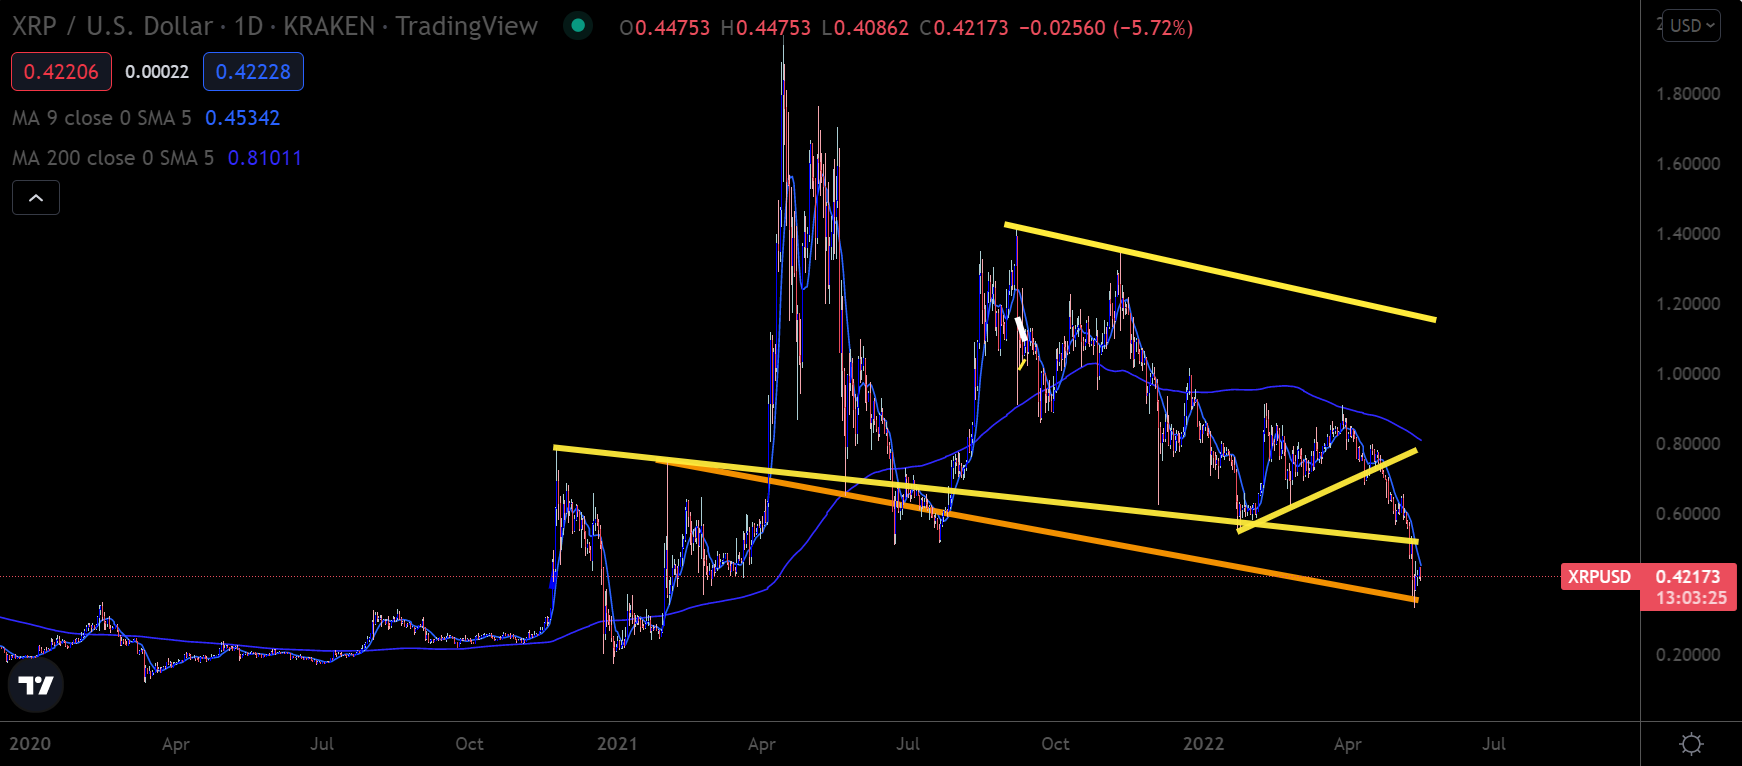
XRP/USD Daily price chart. Source: Trading View
Bottom Line
Last week’s decline shook the confidence in the crypto market. We are starting to see the hangover this week as things remain uncertain and fragile. The fragility and the susceptibility to speculative attacks is characteristic of a bear market. Presently, bad news appears to have a more intense outcome in price than good news.
Additionally, the market’s sentiment remains dull, with no prospects of a positive catalyst panning out in the near term. Sellers will likely maintain an upper hand until July, when the tentative approval of a spot Bitcoin ETF in the U.S. may come through.
There’s a slight chance that an intense buying action after last week’s capitulation event may lead to a positive recovery. However, the time for the price action to reflect the above theory runs out soon in the absence of positive fundamentals.
