Gazing into the Abyss

Bitcoin suffered a major technical rejection from the $40,000 level last week, falling drastically alongside stocks.
Initially, Bitcoin started to follow traditional risk-on assets higher after the U.S. Fed rate decision announcement, which saw the U.S. central bank taking a less hawkish stance than some expected. However, the uptrend was short-lived.
The optimism faded quickly as the assets failed to break above key resistance levels. It was evident in Bitcoin price action once it failed to conquer the $40,000 psychological resistance level.
The market had a delayed response to the Federal Reserve’s biggest rate hike since 2000, as traders mistakenly believed that the bearish event was “priced in.”
Inflationary worries aided by the deteriorating war situation in Ukraine weighs heavily upon the traditional markets. The futures market for stocks opened in the red for this week, which is highly discouraging. This week, the focus will remain on the U.S. consumer price inflation (CPI) percentage for April.
Genuine Concerns
I have some genuine concerns about the events of last week. I will touch upon the negatives for Bitcoin in the technical analysis section below, but the macro picture remains equally apprehensive.
The global economy has been showing increasing signs of stress, especially with out-of-control inflation, ongoing China lockdowns, and the Ukraine war. Markets, particularly tech stocks, are now starting to break lower as Wall Street starts to acknowledge that the economic picture is not good.
Initially, I thought the stock market and the global economy may hang in there until the Autumn of this year before serious cracks started to show. It appears that the cracks are wide open, creating a harsh environment for cryptocurrencies, which have enjoyed a strong correlation with the stock market since late 2020.
The long-term U.S. Treasury bond yields (10-year) surged above 3.1% last week, while the short-term yields fell from 2.722% to 2.696%. The divergence between short and long-term bond yields suggests that investors are not expecting aggressive interest rate hikes but remain uncertain in the short term about Fed’s decision. The U.S. dollar remains king as the most liquid global reserve currency as uncertainty prevails.
The U.S. CPI data from April will help gain some clarity about the possible actions of the Fed in next month’s policy meeting.
Last month, many pundits predicted that the worst might be over concerning the inflationary rise. However, China derailed that theory by placing major port cities under lockdown, restraining the supply-chain industry further.
Experts predict that Wednesday’s numbers will project 8.1% year-to-year inflation in April, which is still a 40-year high, but will be the first slowdown this year, falling from 8.5% last month. Anything above or below the expected level will profoundly affect asset prices. Moreover, as the current trend remains bearish, only values below 8% can revive growth in risk-on assets.
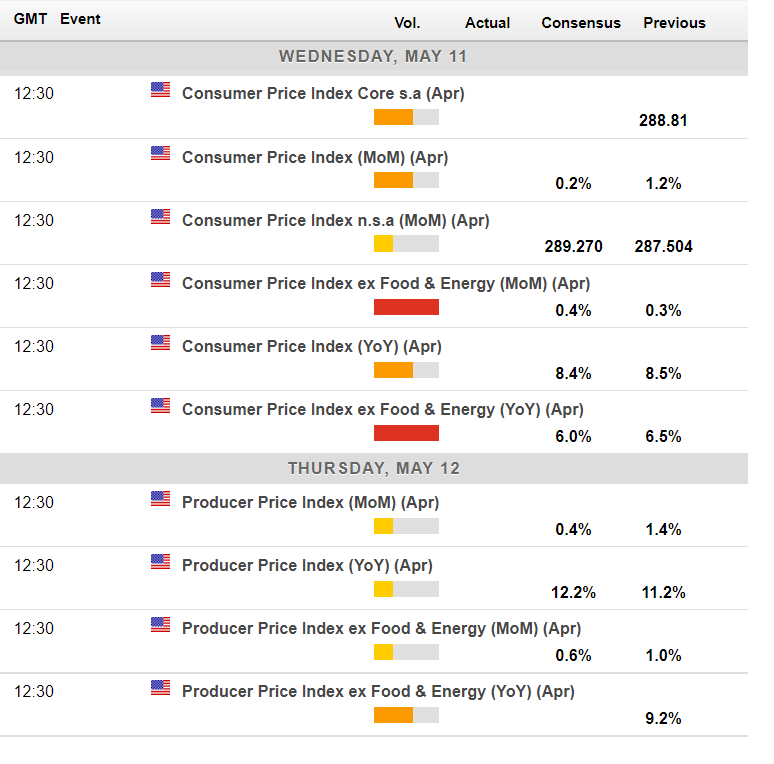
Economic calendar for this week. Source: www.forexlive.com
Miners Capitulation Risk
The market’s sentiment flipped towards extreme negative after last week’s price drop. The Crypto Fear and Greed Index reached all-time low values of 11, except for the crash in March 2020. Other sentiment metrics from Santiment, like Weighted Social Media sentiment, also scream local lows.
While market sentiments suggest that a reversal is close, some on-chain indicators signal that a complete flush-out is still due.
Bitcoin’s price has moved below the production price of the least efficient miners in the market. A further slump in prices will put these miners—usually small-scale businesses with old machines—under pressure, forcing them to shut operations.
Over time, the situation creates more profit for large-scale miners, increasing accumulation. But the impulse reaction of the capitulation among weak miners is accompanied by a sell-off by them to cover the cost of winding up, which accelerates the decline.
Notably, in September 2021, the upper level of the product cost band marked the bottom in prices. There is a likelihood that another bounce could occur from the top of this band. But if the price persists below $33,800, the risk of capitulation increases significantly.
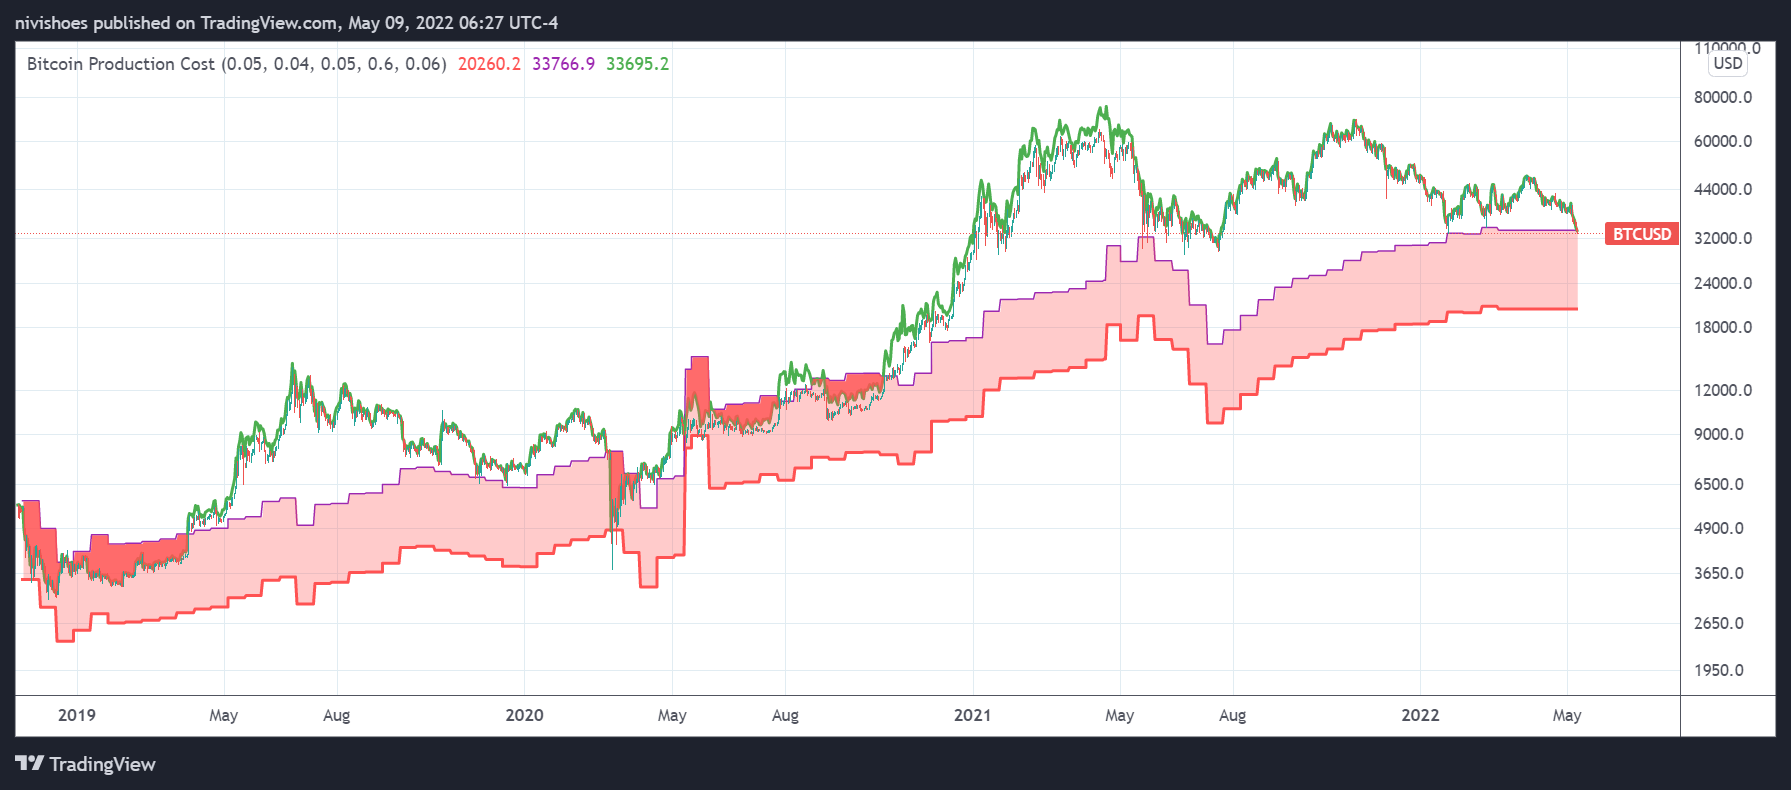
Bitcoin price chart with product cost indicator. Source: Trading View
Another thing that has kept me worried is the strong retail interest since Q4 last year. The Supply Distribution data from Santiments shows undeterred buying among addresses holding less than 1 BTC. This is a negative sign as the price usually reacts opposite to retail holdings.
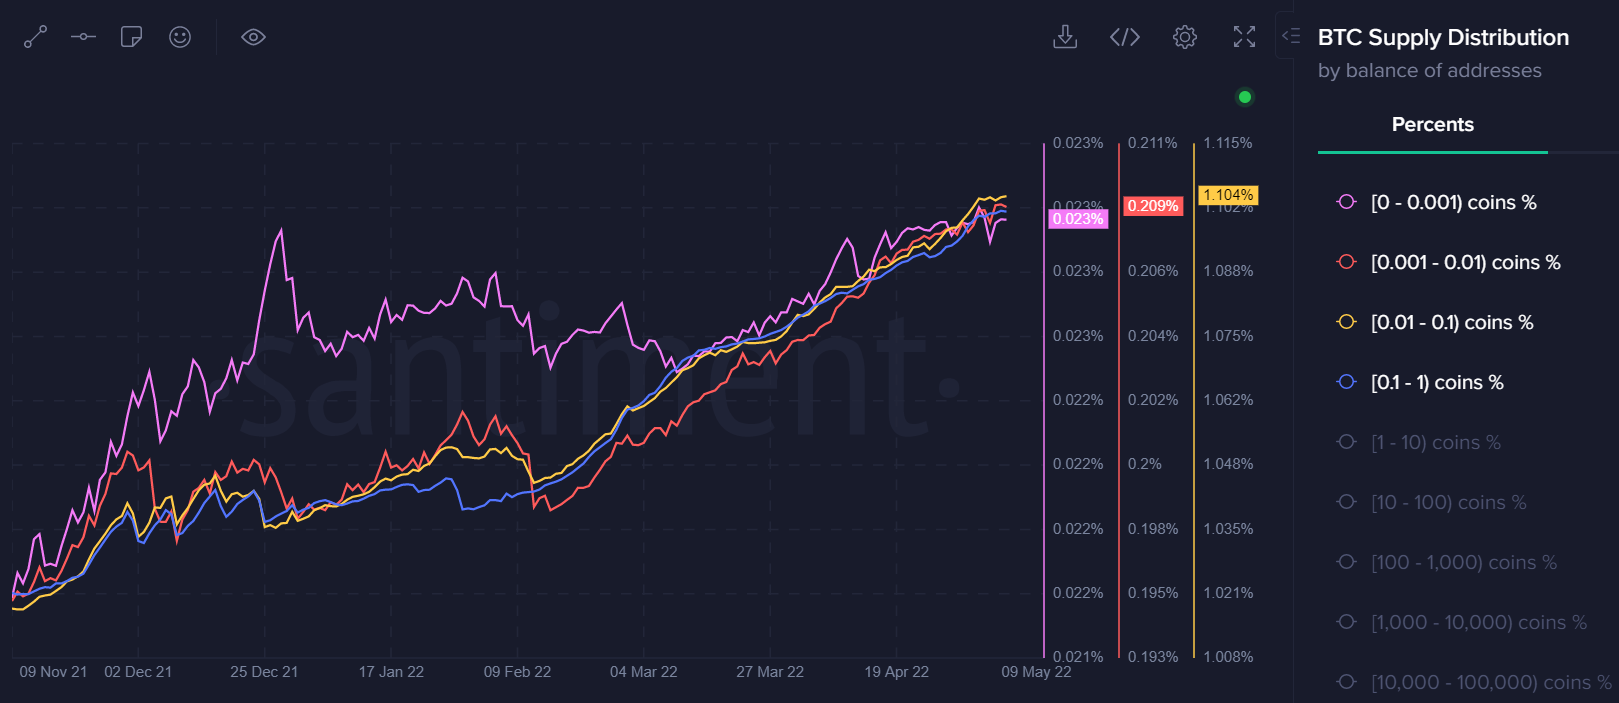
Bitcoin holdings among retail investors (wallets <= 1 BTC). Source: Santiment
At the same time, mid-tier whales—addresses holding between 1,000 to 10,000 BTC—which hold a track record in buying low and selling high over short to medium term timeframes, have reduced their holdings to a yearly low. The sell-off among this cohort is a solid reason to practice caution at current levels.
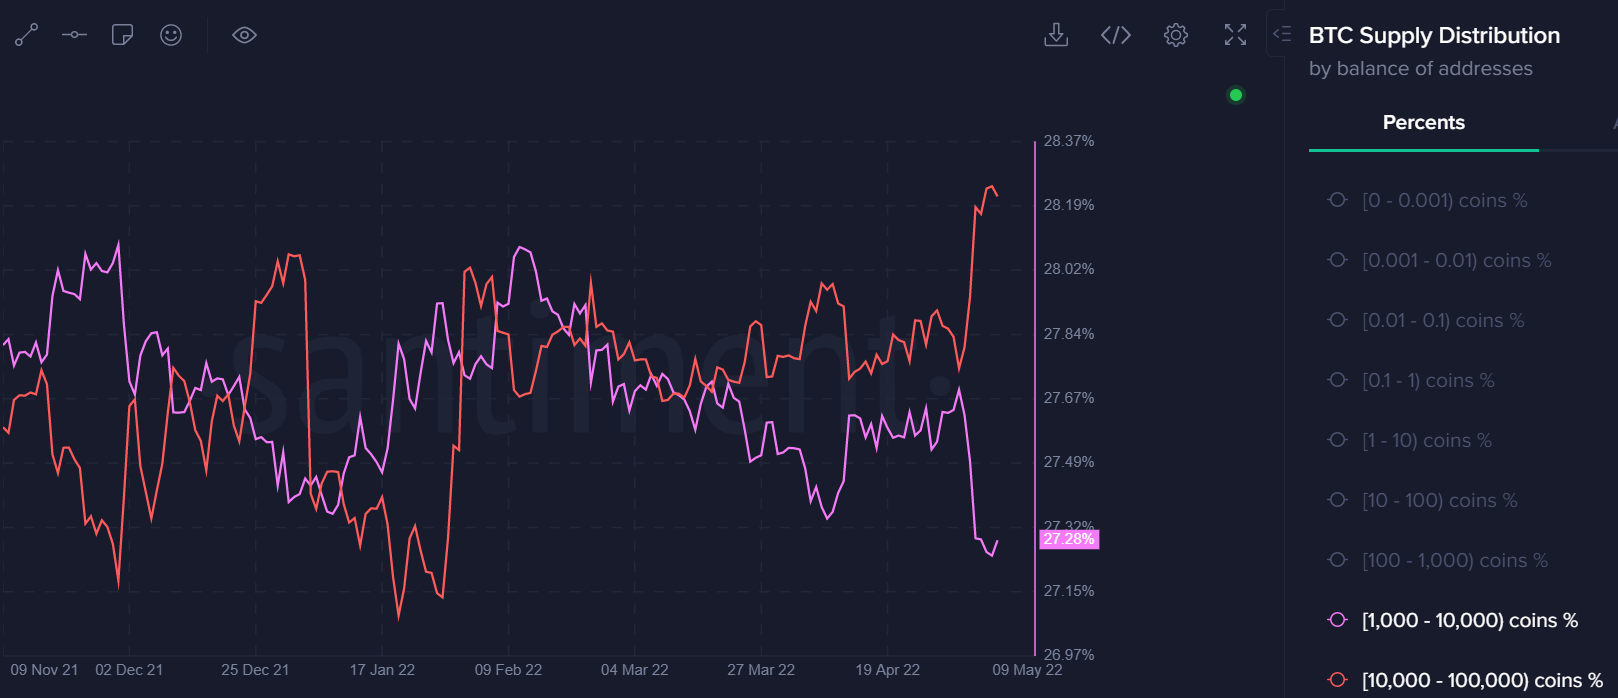
Bitcoin holdings among whales. Source: Santiment
$38,000 Threshold
Bitcoin is starting the week under tremendous pressure after breaking below a well-defined rising price channel on the daily time frame, formed since the start of the year.
If we measure the size of the price channel, then last week’s clean break under the channel’s support at $38,000 sets up the mouthwatering prospect of a potential $11,000 downside move, which would take BTC to $27,000.
Buyers will look forward to retesting the support turned resistance level at $38,000. Rejection from this point would signal a continuation of the downtrend at some point during this trading week.
Of course, the risk is that BTC could continue lower from current levels for traders looking to short. The clue that BTC can test the formerly weekly breakout area would be price stabilization around the $37,000 to $37,400 region in early-week trade.
But the fact is that BTC is struggling to surpass $36,000, so I don’t know how valid the theory is about a recovery towards $37,000 to $38,000. A break under the yearly low and a run at $30,000 seems the more potent risk.
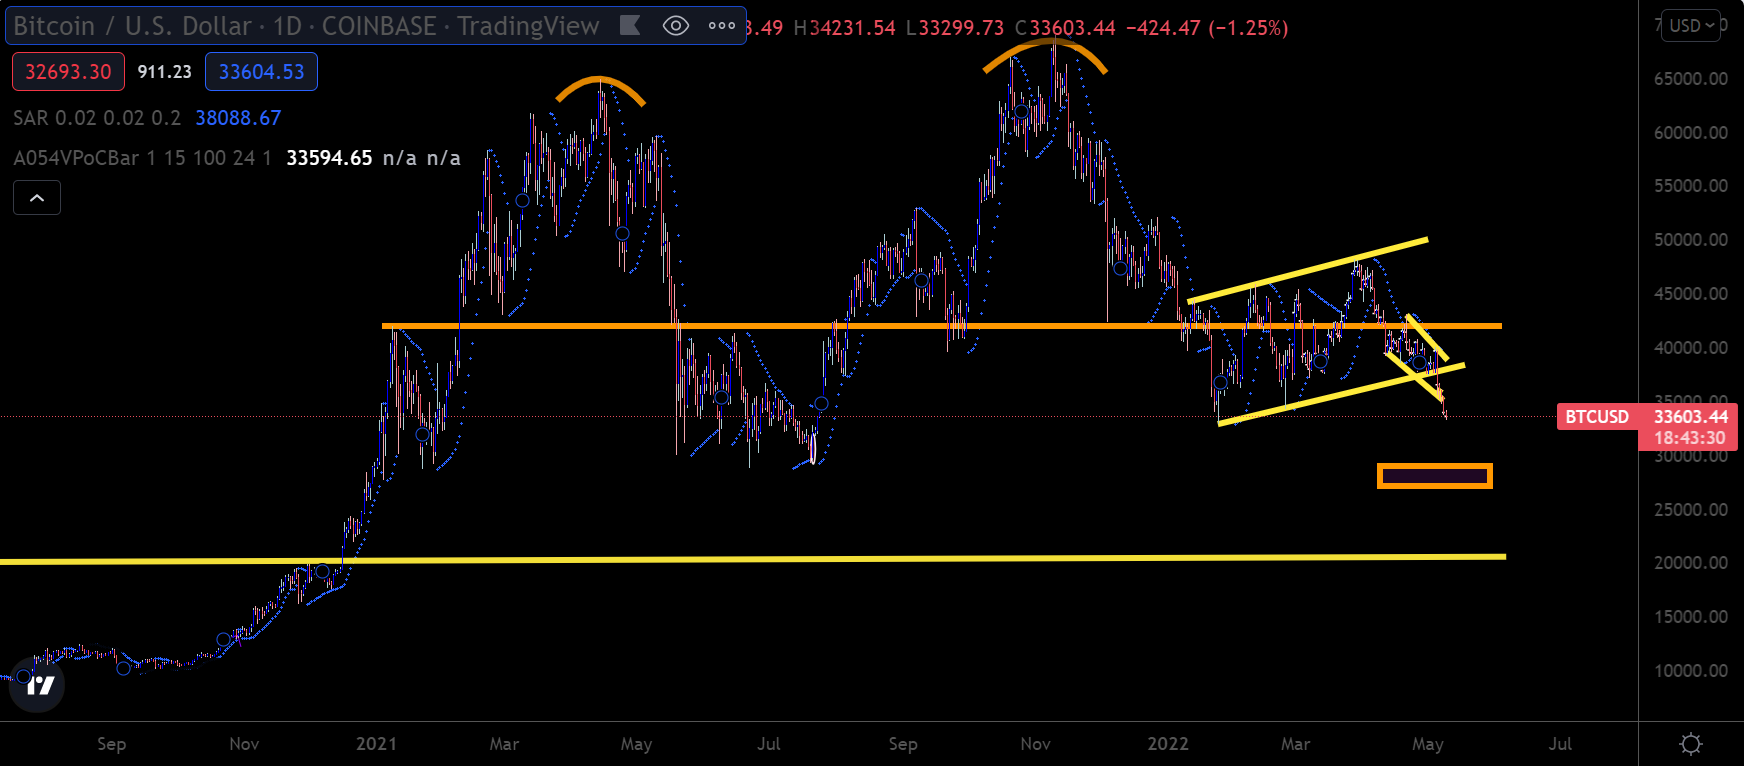
BTC/USD Daily price chart. Source: Trading View
ETH Ready to Offload
The technicals for ETH/USD pair shows that the price is hanging by a thread.
A daily close below $2,450 would ensue a massive head and shoulders pattern accompanied by a nasty triangle breakout. This is almost the reverse situation of last year, when ETH actually broke above the triangle.
In order for me to be wrong, we need to see ETH acting rock solid above the $2,900 level this week, and breaking above the post-Fed meeting high of $2,940 from last week. That would be a major clue that all is not lost.
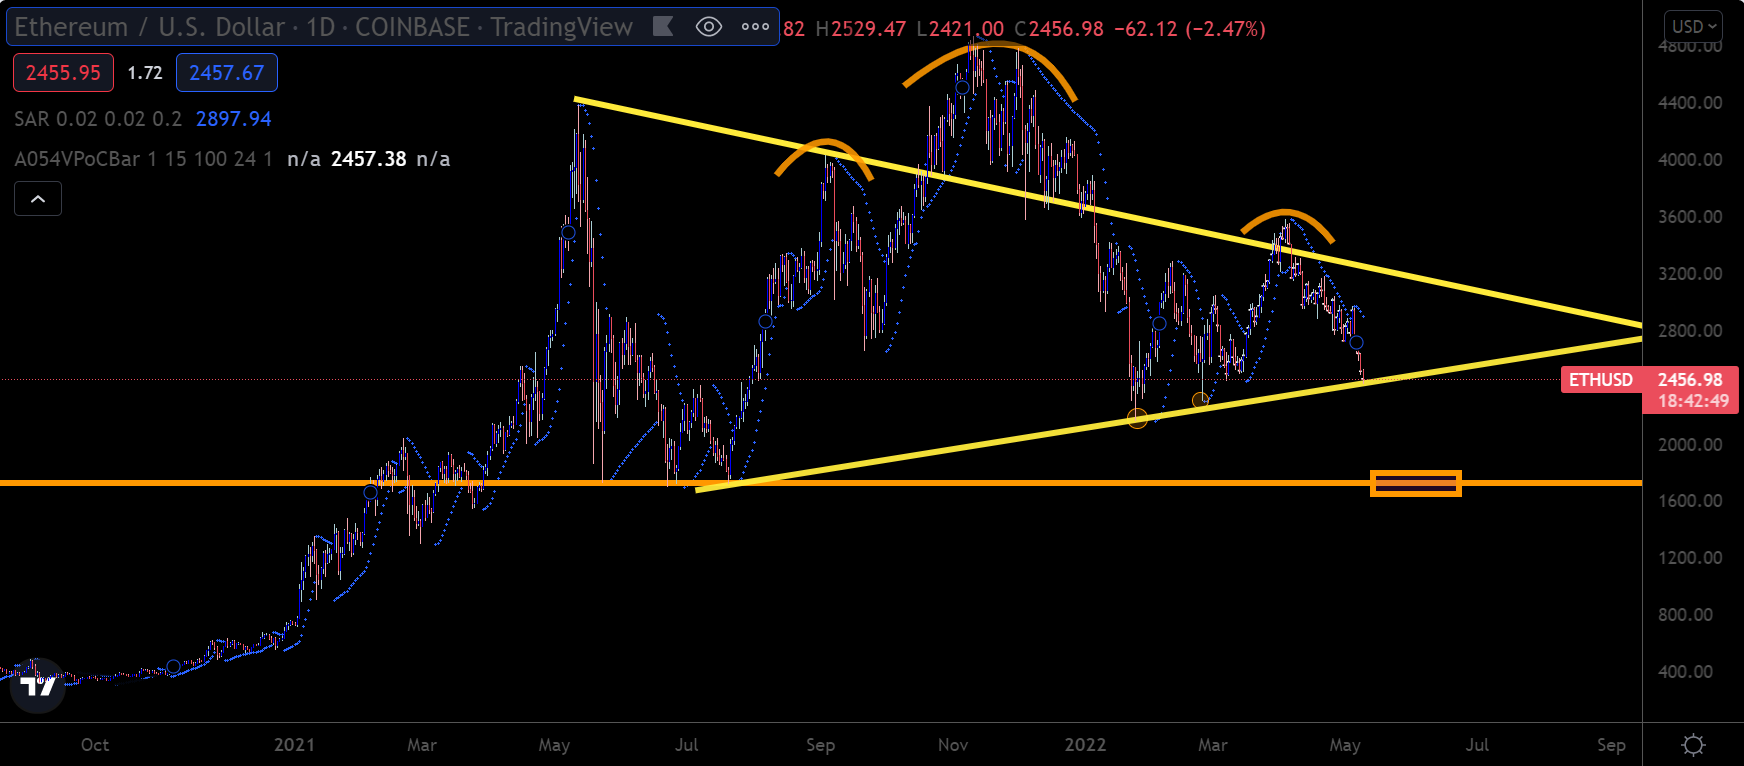
ETH/USD Daily price chart. Source: Trading View
A Great Proxy
Ripple has been an excellent proxy throughout the time I traded crypto. While XRP does not lead the market, the charts are so clean on the higher time frame that they can provide fantastic insights into where the broader market is headed. This obviously assumes there are no Ripple-specific catalysts behind the potential price moves.
Using this logic described above, I noted earlier this week that if XRP/USD started to lose the $0.7000 support, it would probably not be a good sign for the broader cryptocurrency market. And that was correct.
Using the same logic, it would appear that XRP/USD could be at risk of a dramatic fall back towards the $0.3000 area if we see sustained weakness below the former weekly, not too far from the $0.5600 level.
To get me even slightly excited about a potential bottom forming in the near term, I need to see XRP/USD move above the $0.9000 resistance level, which does not look plausible at the present moment.
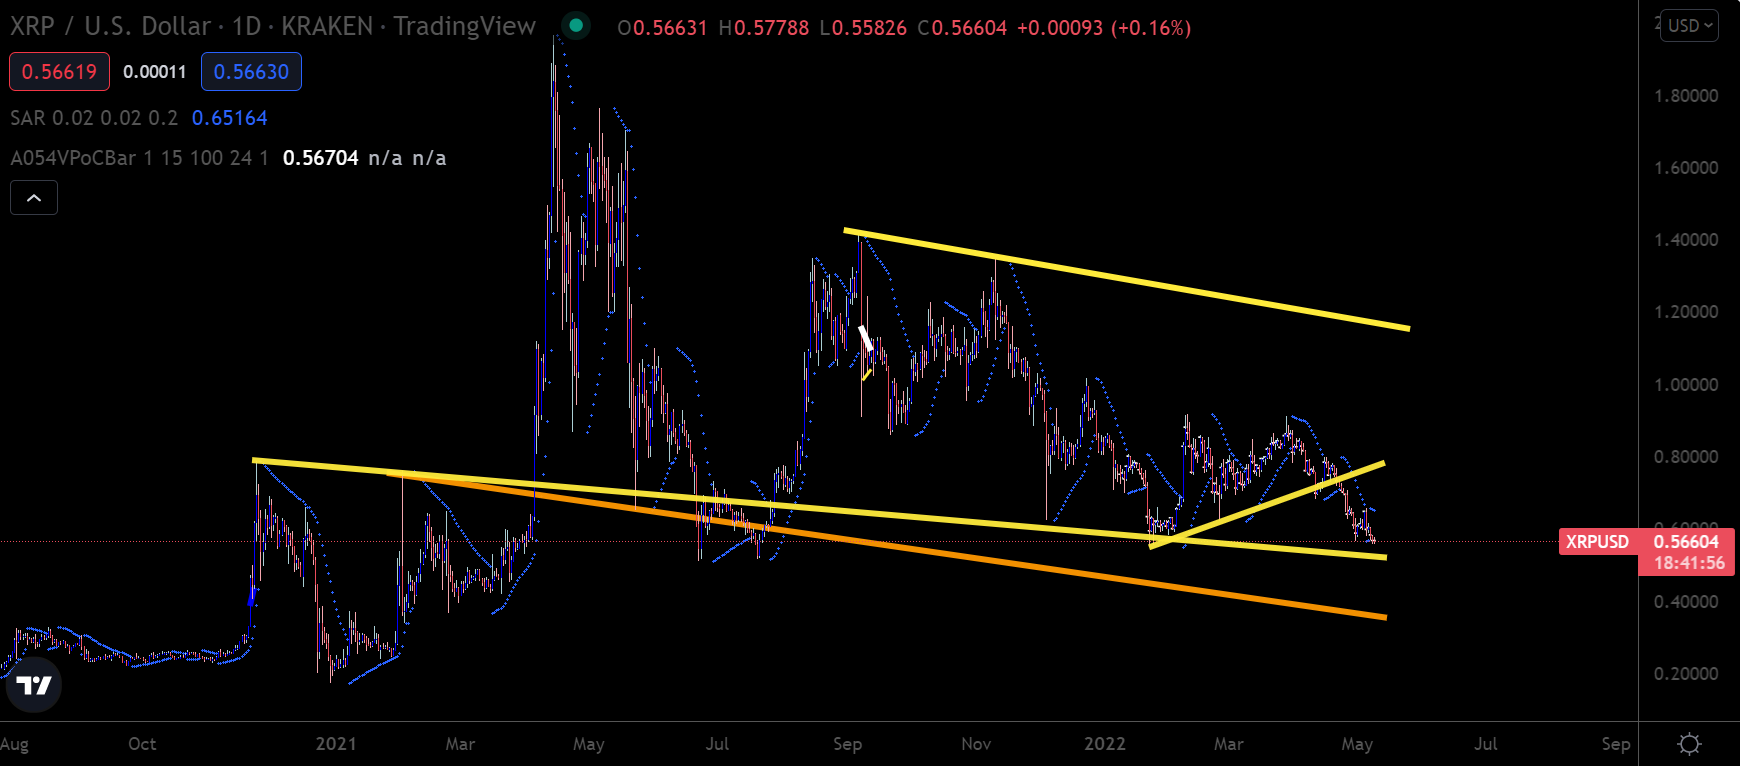
XRP/USD Daily price chart. Source: Trading View
My Take
I do not currently have a very optimistic view of the current market situation. Unless we see a dramatic turnaround this week, Bitcoin is at risk of staging a painful price correction under last summer’s low of $32,950.
The obvious problem is that the economic situation is much worse than last year. Without QE underpinning confidence and liquidity, the risk of increased rate hikes is apparent.
Last week’s rejection around the $40,000 price level looked very bearish technically. I do not wish to sound overly concerned and one-sided, but I do have some worries about a 50% price correction back towards the $20,000 area this year if the market does not quickly start to recover.
The possible catalyst for a positive breakout is progress towards spot Bitcoin exchange-traded fund (ETF) approval by the U.S. securities regulator or a resolution to the Ukraine war. However, the present situation is that both the scenarios are far-fetched while the trend remains negative.
