Downbeat April

Bitcoin fell to a fresh monthly trading low last week, hitting $37,700 and ending April on a downbeat note.
Bitcoin’s price correlation with the Nasdaq index hit peak levels of 0.7. The Nasdaq dragged Bitcoin lower as it broke through critical technical support and fell to a new yearly low of 12,800 points.
The negatives:
- The Chinese economy continued to suffer due to the recent spate of COVID-19 lockdowns on the world’s second-largest economy.
- A positive breakout in the U.S. dollar index against other currencies above the March 2020 peak of 103 points put further pressure on Bitcoin.
- The euro also dropped as Russia halted its natural energy exports to Poland and Bulgaria, raising concerns about Europe’s economy, which will likely suffer from an energy crisis if the conflict is not resolved before the countries run out of their reserves.
- The most widely-discussed issue amongst crypto social media was “Buy Bitcoin,” which continued to outweigh “Sell Bitcoin” calls across social media. Typically, this is not a good sign as retail traders have poor market timing, and this could hint that the timing for a coming Bitcoin rally is still slightly off.
The positives:
- The Central African Republic, a landlocked African nation, made Bitcoin legal tender, becoming the second country after El Salvador. The recent addition will likely fuel a bullish sentiment among retail and institutional investors worldwide.
- Fidelity Investments revealed plans to roll out Bitcoin investing for 401(k). The financial services firm will begin the offering by summer this year.
- MicroStrategy, famous for its large and aggressive Bitcoin accumulation, announced plans to offer employees access to Bitcoin retirement plans through Fidelity’s service.
- Goldman Sachs issued its first-ever loans backed by Bitcoin.
This week is all about the Fed. I am starting to consider that the crypto market has already priced in the most hawkish action by the U.S. Fed at this week’s meeting. However, given the current macroeconomic scenario and residual signs of retail hype in the crypto market, it is not enough to confirm a bottom yet.
In the Hands of Fed
Does the Fed really want to come out ultra-hawkish this week and risk a further bloodbath in the stock market ahead of the midterm elections? I think and hope not.
If inflation is being driven by supply-side factors more than quantitative easing over the last two years, it will fall dramatically, and the economy will need less tapering to get there.
However, with yield curves and recession indicators flashing mourning signs, investors have been flocking to the bond market as a safe asset when equities fall.
In all probability, the market has accounted for a 50 basis point hike and stocks could start to recover and drag crypto higher after the announcement. However, ultra hawkish comments from the Fed chair about future plans could be disappointing for risk assets.
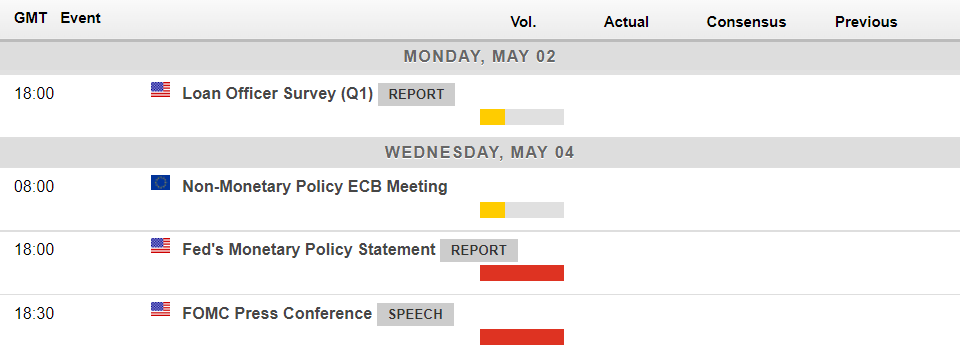
Economic calendar for this week. Source: www.forexlive.com
If the Fed member’s outlook toward future interest rate hikes comes out severe, risk-on assets will likely suffer a substantial downfall. But if they plan to relax future tapering, we can expect Bitcoin to break its five-week losing streak.
We really and truly need to wait until after the Federal Reserve decision to know Bitcoin’s true intent and confirmation that the market has gotten too bearish about aggressive Fed rate action.
On-chain and Sentiment Dilemma
Last month, Bitcoin’s balance on exchange hit a four-year low, reaching February 2018 levels. A downtrend in exchange balance suggests that BTC becomes illiquid as the supply moves to non-custodial wallets. While it is a sign of positive accumulation, retail investors dominated buy orders.
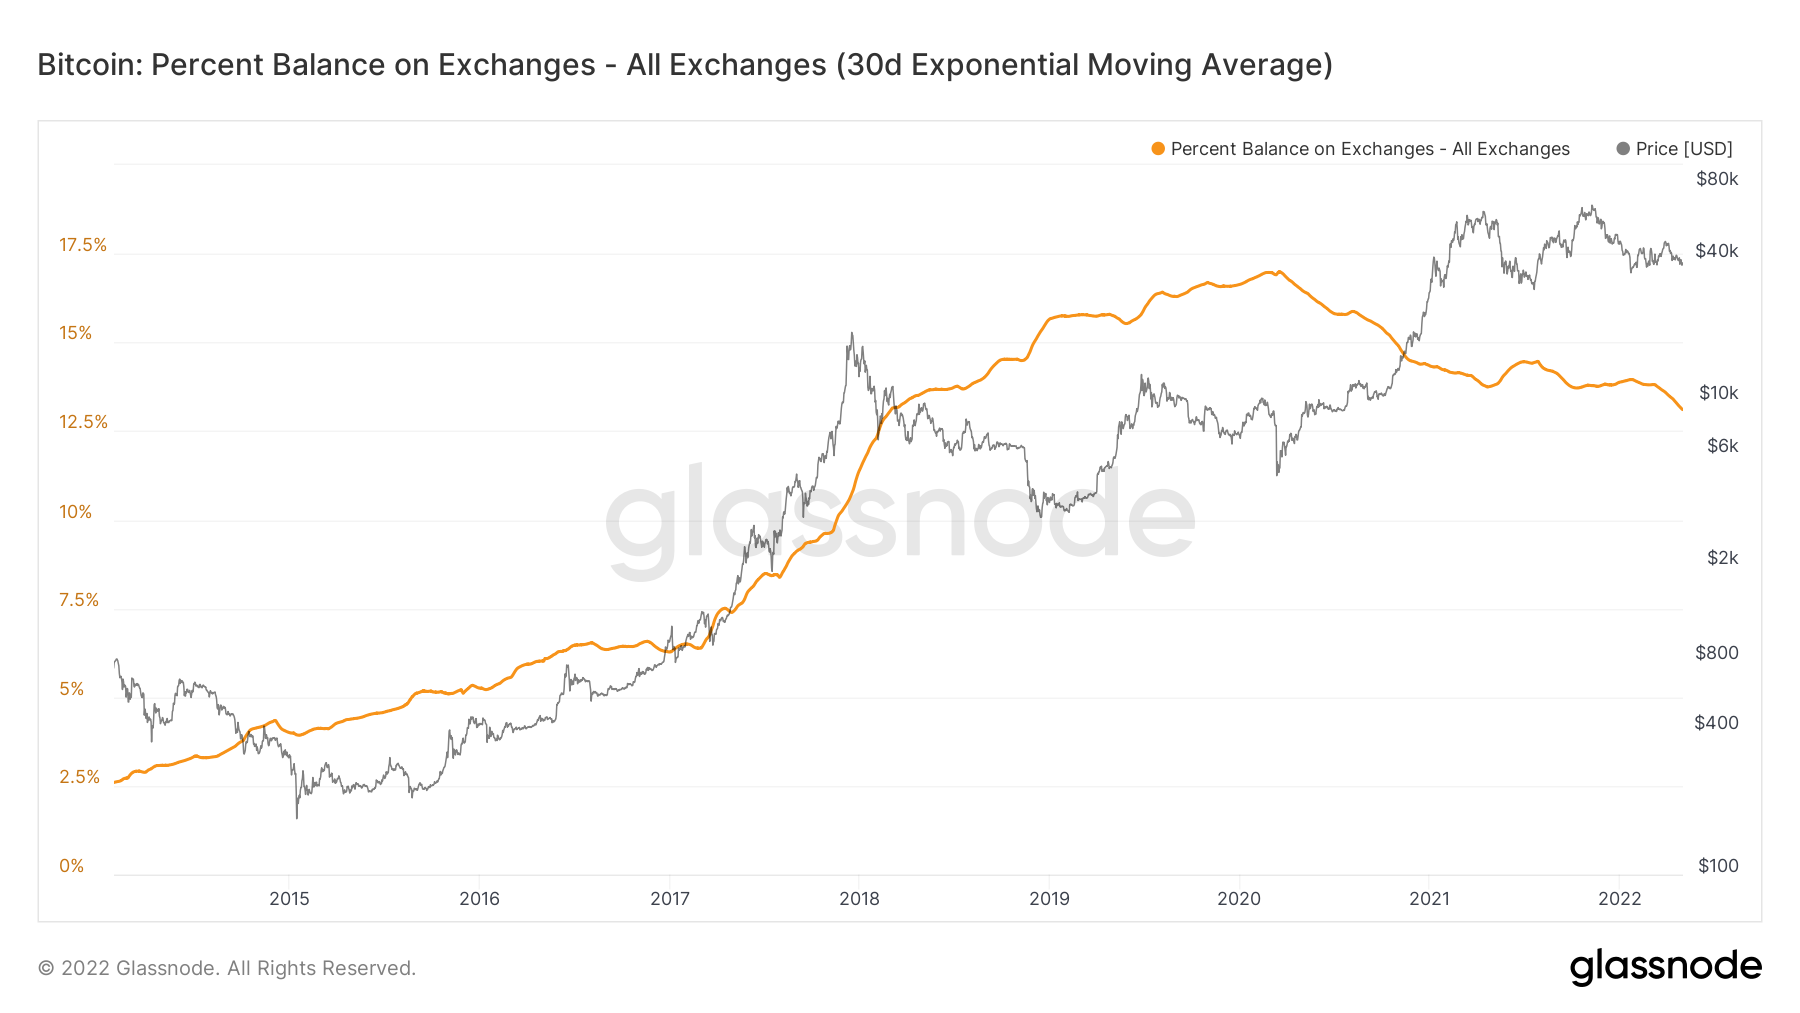
The 30-day moving average of Bitcoin exchange balances. Source: Glassnode
The supply distribution chart of Bitcoin shows heavy accumulation among retail investors. Bitcoin addresses with a balance between 0-1 BTC added to their position, while wallets holding between 1,000 to 100,000 BTC stayed put near the monthly opening balances.
Interestingly, “smart whales”—holding between 1,000 and 10,000 BTC—unloaded significantly in the first half of April. However, the network recorded positive accumulation among them during mid-April. Since then, however, this cohort of investors has stayed relatively inactive.
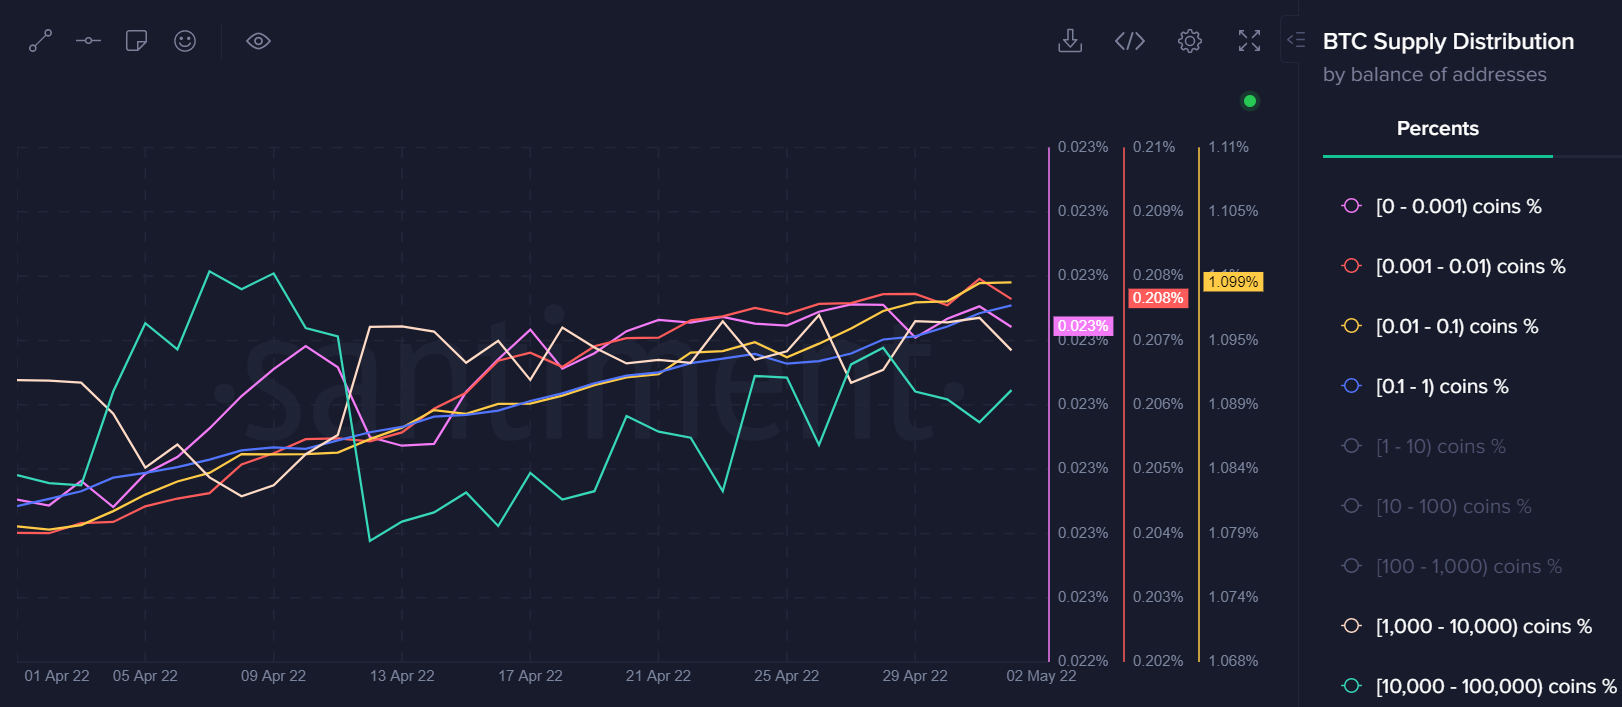
Bitcoin’s supply distribution chart. Source: Santiment
The sentiment indicators are also sending mixed signals. Last week, the Fear and Greed Index slipped near yearly lows of 20. This level has often marked a reversal point, encouraging buyers.
However, at the same time, Buy BTC calls on social media are still vastly outweighing Sell BTC, which is a concern as both metrics are contrarian indicators; therefore, sentiment capitulation is not entirely upon us.
There are other reasons to believe that the bottom may not be in yet. The total percentage of addresses in profit is at its historical mid-point with nearly 60% of the supply in profit. Usually, a bottom is reached when less than 50% of the reserve is in profit. Thus, it suggests that there will likely be more pain before the current bear cycle ends.
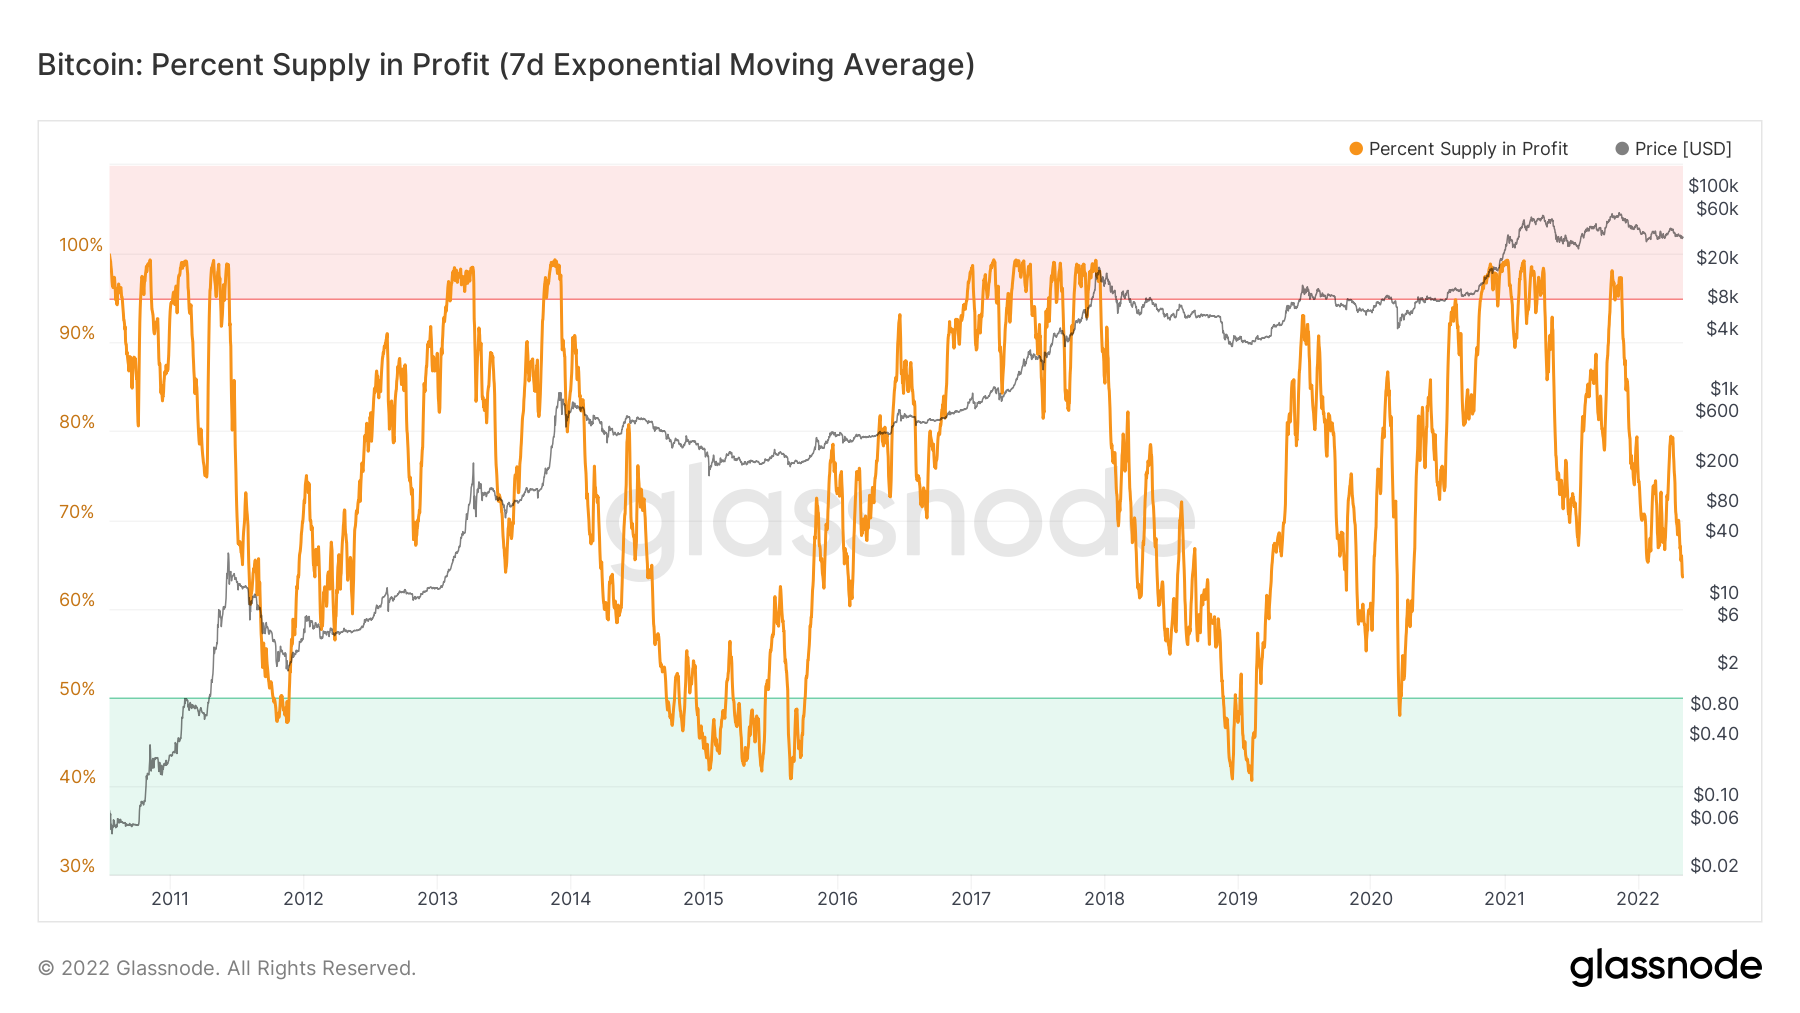
Bitcoin’s percentage supply in profit. Source: Glassnode
Tipping Point
This should be a crucial week for Bitcoin on the technical front. BTC needs to move away from the current danger zone, around the $37,000 to $38,000 support level, for a positive swing action.
If BTC can get away from the danger zone after the Fed meeting, we could finally see the start of a meaningful price recovery. The big clue will be a series of daily price closes above the $42,000 price area.
On the downside, a break of the $37,000 support level, currently denoted by the trendline following the January and February lows, could raise the risk of a fall to a lower price range between $34,000 and $30,000.
This should be one of the most anticipated and exciting trading weeks of the year for Bitcoin. Traders waiting on the sidelines for the dust to settle could be preparing to ape in after the Fed result.
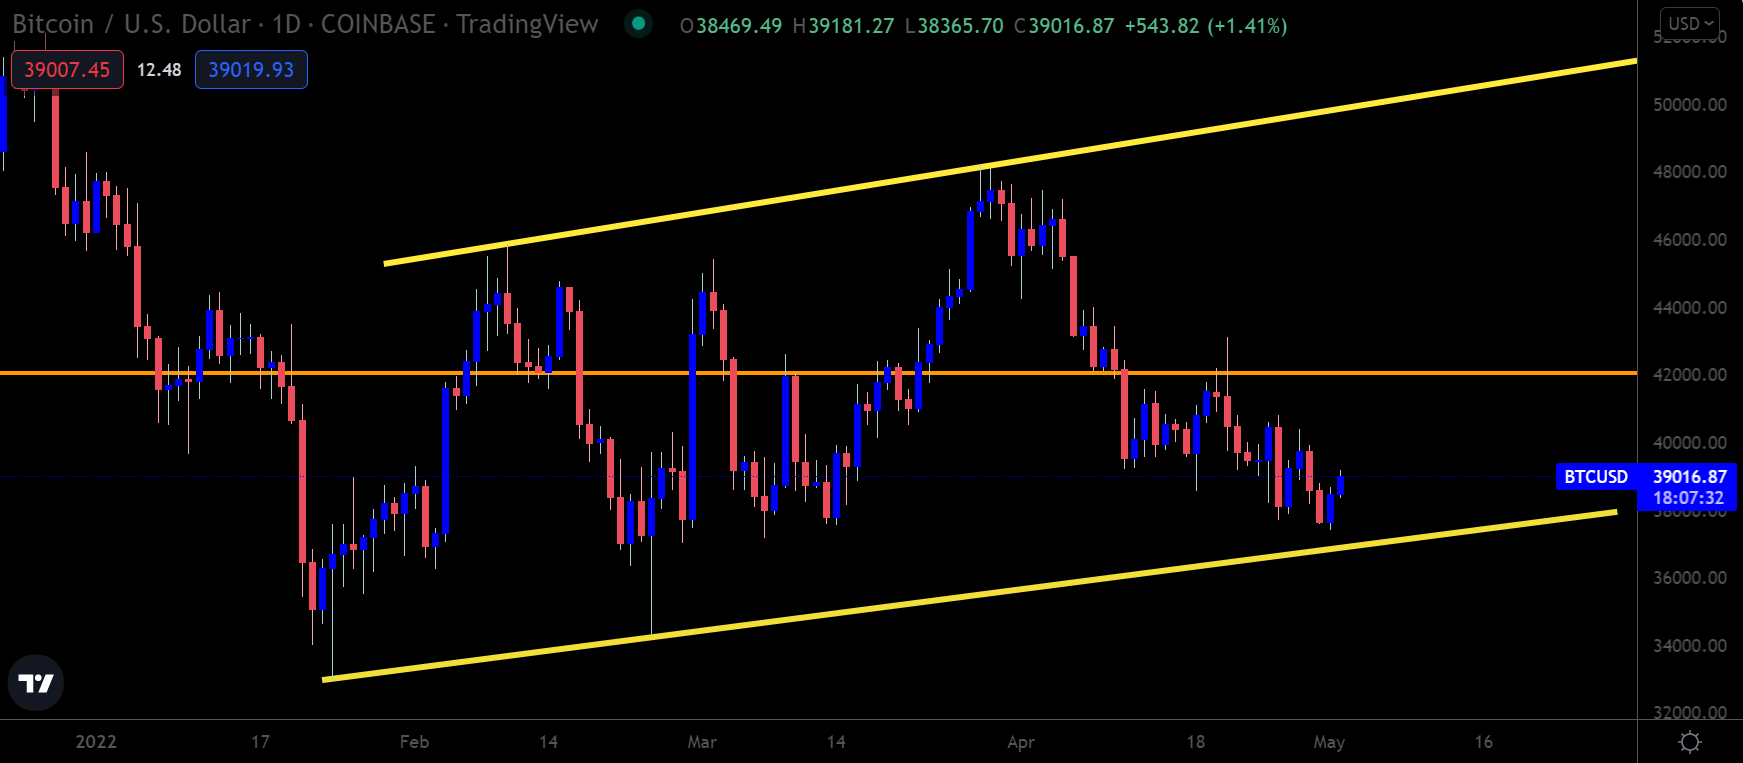
BTC/USD Daily price chart. Source: Trading View
ETH Holds Support
It is still very early days for Ethereum in terms of whether we are about to see a meaningful price recovery over the coming days. The ETH/USD pair will likely hinge on which side of the $37,000 to $42,000 price range BTC ends.
In case of a positive price direction, bulls would target the $3,500 to $3,600 resistance zone. Buyers need to move above this resistance zone to get the green light for a much stronger price rally.
On the downside, a sustained breach of the $2,800 support level could see the ETH/USD pair falling towards the $2,500 area and performing a solid test of the 2021 summer lows near $1,700.
Should we see a neutral price reaction, I would be encouraged if bears were repeatedly unable to breach the $2,800 level. Even if the Fed outcome is mute, a solid technical base around $2,800 would suggest positive accumulation in the coin.
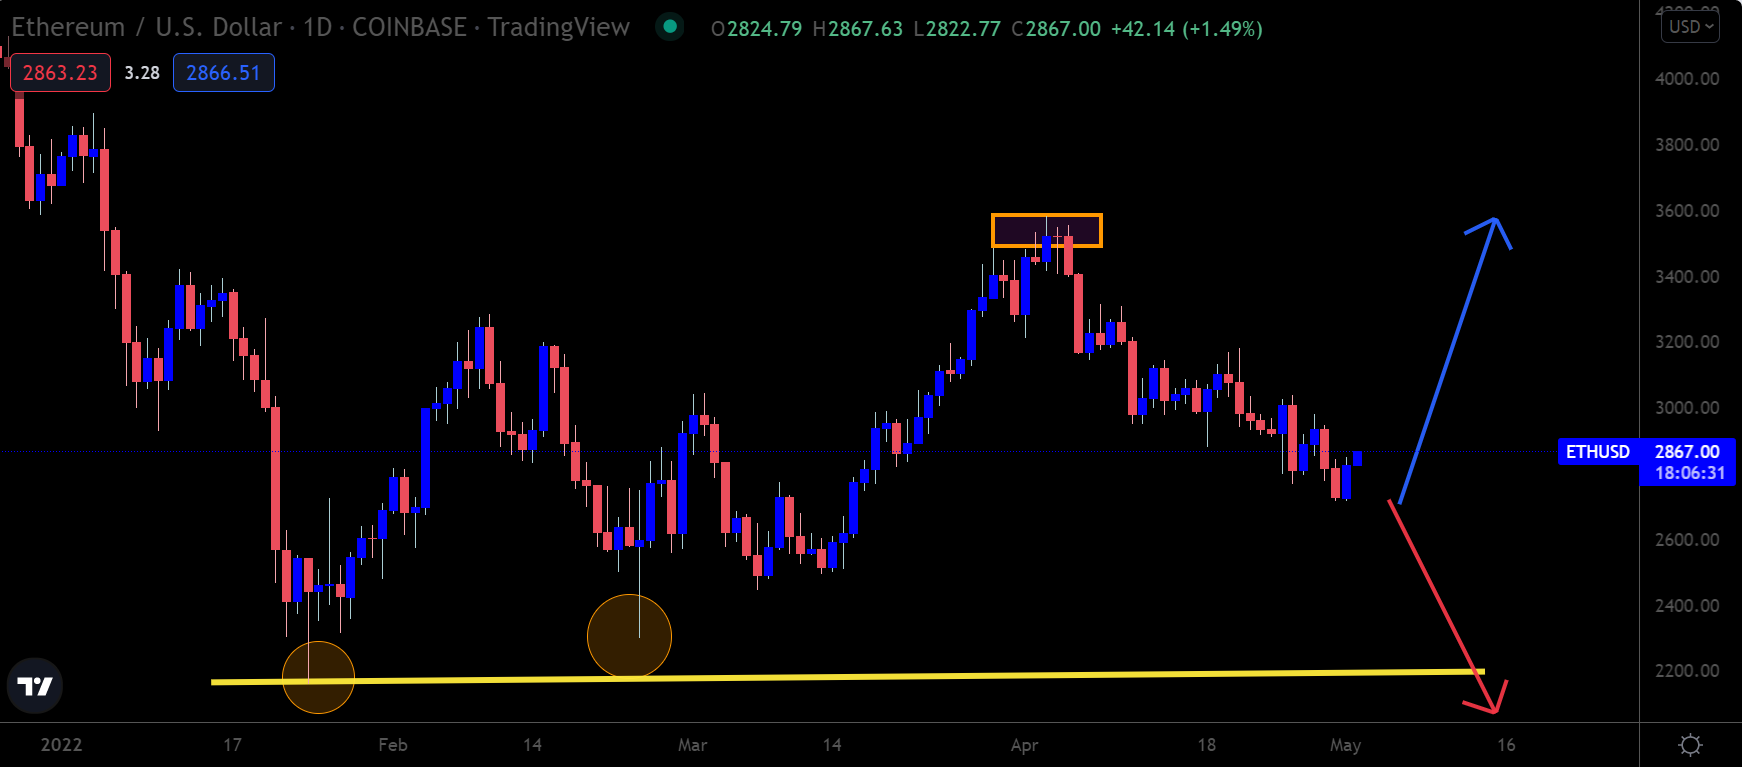
ETH/USD Daily price chart. Source: Trading View
Litecoin And $90.00 Support
Litecoin starts the week in a precarious position after repeatedly failing to move the 50-period exponential moving average of the 4-hour chart at $101.34.
Nevertheless, it has been holding above the yearly price low of $91.52, providing a glimmer of hope that a rebound is possible on the technical front.
LTC bulls have failed in their upside attempts to get past the technically critical $130.00 resistance zone over recent months, keeping me on edge and cautious about predicting a major rally yet.
Technically, a move above key trendline resistance, at $122.00, would be encouraging in the short term.
Sellers will gain further traction if LTC breaches the $90.00 level this week. It would open the door toward the $80.00 and $70.00 support levels rapidly.
LTC has a firm price correlation with Bitcoin; in line with the old crypto adage, where Bitcoin goes, Litecoin is likely to follow.
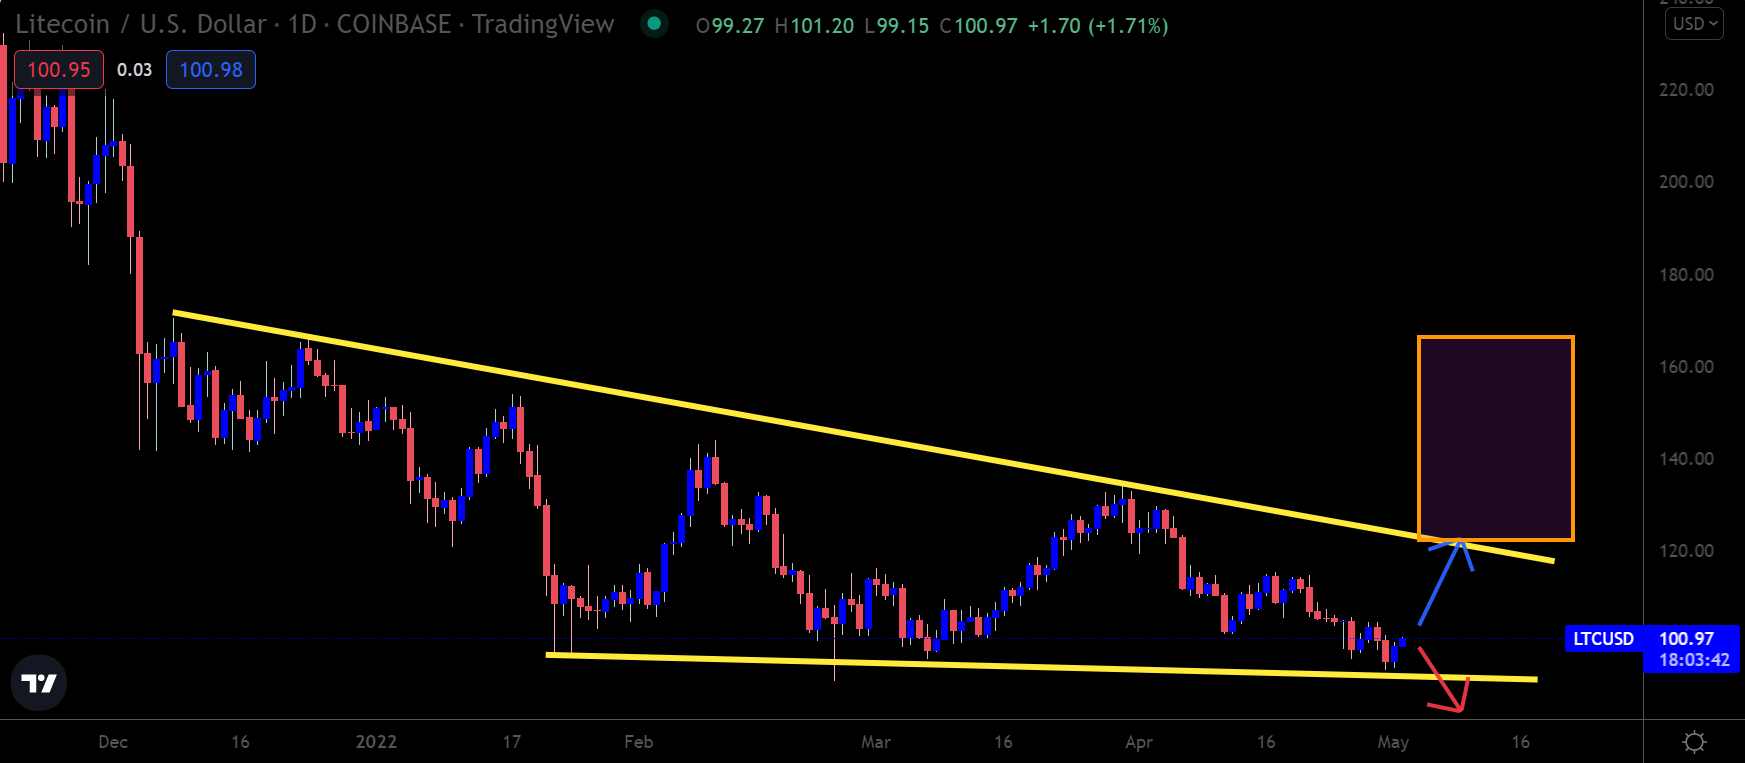
LTC/USD Daily price chart. Source: Trading View
Putting It All Together
BTC still faces headwinds from stocks, a rising U.S. dollar, Ukraine war, the COVID-19 outbreak in China, and a worsening global economy. Therefore, a high percentage chance still exists that we could see a continuation of the April downturn spilling over into parts or even all of May.
However, despite all the headwinds, Bitcoin is still holding up very well compared to stocks and other currencies against the U.S. dollar, which is mildly encouraging.
Of course, this week’s million-dollar question is where Bitcoin will end up trading at the end of the week after the Fed meeting.
A clear price path exists on the charts towards $42,000, while a worsening decline towards the yearly low is also possible if the $37,000 support level cracks with conviction.
I’d rather keep the powder dry and wait for things to become more apparent after the Fed’s announcement. I hope that all the bad economic news is already priced along with the future Fed rate hikes. However, the trend is still your friend and currently its very bearish, so this week’s best crypto strategy is keeping an open mind to all possible scenarios.
